CORN - Gold: The Perfect Storm In 70 Years!
- The fundamentals usually lags the markets, and Main Street seems to be behind in relation to the fundamentals.
- We had another high inflation report as earnings season begins.
- Bond yields are falling as inflation fears swirl.
- Inflation talk is all over the news, the Internet, and Main Street.
Deflation, Not Inflation
The fundamentals usually lag the markets, and Main Street seems to be behind in relation to the fundamentals. We had another high inflation report as earnings season begins. Bond yields are falling as inflation fears swirl. Inflation talk is all over the news, the Internet, and Main Street.
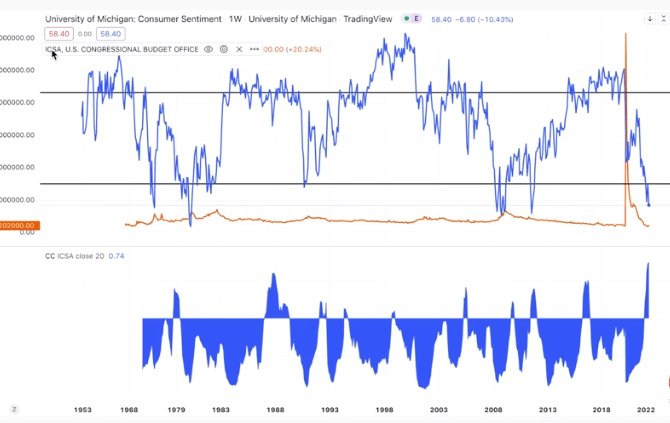
Consumer Sentiment (University Of Michigan)
Game of Trades recently reported that the University of Michigan Consumer Sentiment Index shows that consumers are the most depressed they’ve been in 70 years. This level of consumer sentiment usually occurs during recessions. The only time it didn’t happen was in 2011. They have also coincided with some of the best buying opportunities for stocks in history. This is a time to take advantage of widespread pessimism in the market.
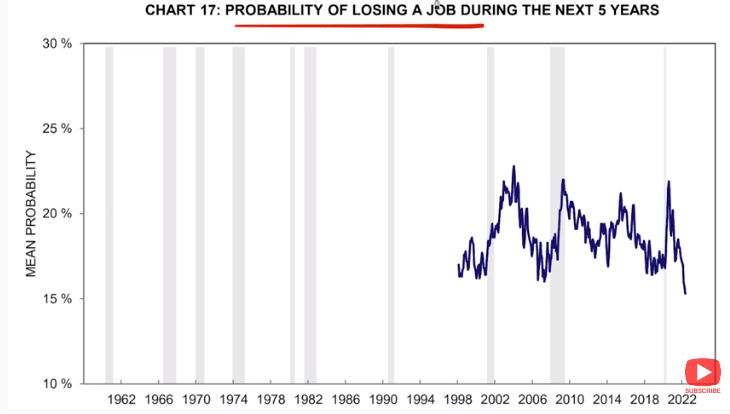
Loosing Your Job (Game Of Trades)
The probability of losing your job in the next five years is a survey that is at a record low. This is strange, since people are optimistic about their job, yet not about their financial situation in the consumer sentiment index. Initial jobless claims have been declining. Other times when this has happened were in 1979, 1987, 2005, and in 2011. In each of those times, in the months, after stocks performed well. This is perhaps evidence that when consumer sentiment falls, yet jobs appear secure, it is a false signal of a recession.
Consumer Sentiment (University Of Michigan)
It appears that we may just be rebalancing after the pandemic, with spending readjusting after the boom after the economy opened up.
People appear to be pessimistic because of inflation. In the 1970s, as inflation rose, consumer sentiment declined in a proportional manner. The bottom of inflation corresponded with the bottom in consumer sentiment, as did the peaks. The same thing appears to be happening now.
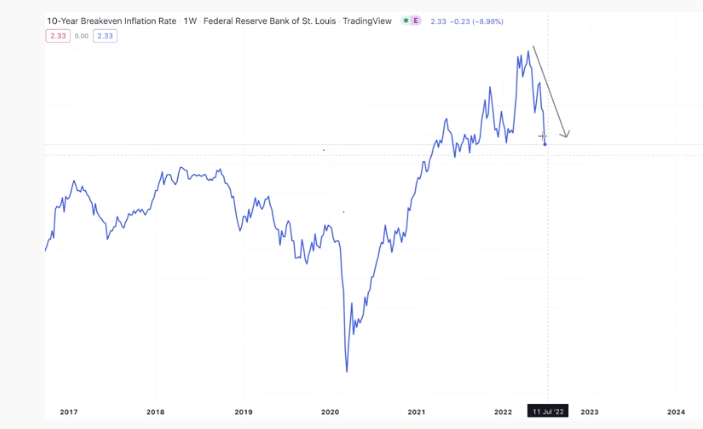
Inflation appears to be peaking, especially since oil prices are trending down and they are a major cause of inflation. Oil has been contributing to the CPI in a major way.
Each inflationary cycle since 1940 has been shorter than the one we’ve seen now, which has reached 24 months. It would be surprising to see inflation continue much longer and not see it fall in relation to historical inflation cycles. That should then make consumer sentiment rise again, as people have more buying power. A lot of the consumer negativity should be relieved, at least for a few months, as inflation falls.
Consumer Weakness (Game Of Trades)
Over the past 70 years, returns on stocks when consumer sentiment rebounded were extremely high, especially when stocks were purchased in the first month of the rebound. Annualized returns based on buying during the first month after consumer price sentiment hit extreme lows reached 70 percent.
Yield Curve
The 10-Year Note is at 3 percent. We have inflation at about 8.6 percent, which means we have a gap of about a negative 5 percent yield.
“Either the Fed has to raise interest rates more aggressively or inflation needs to come down,” Equity Management Academy CEO Patrick MontesDeOca said.
Commodities
Soybeans
Soybeans (SOYB) reached a high of 1784 on June 9, 2022. The market has collapsed to a low of 1304; a move of almost $5 in June. Soybeans are a leading indicator of food prices. The high priced in the Russia-Ukraine war. We have eliminated about 30 percent of the world’s soybeans, but the market has discounted those fundamentals.
Wheat
Wheat (WEAT) reached a high of 1363.50 on March 7, 2022 as Russia invaded Ukraine. The market priced in the war at that point. Wheat came down to a low last week of 7.85, which was a huge drop of more than 40 percent. Wheat is another main source of the inflationary spiral that everyone is talking about.
Corn
The high was 824.50 on April 25, 2022, right after the invasion. Corn (CORN) then came down to 301. All the grains came way down, which suggests inflation may not continue.
Crude Oil
Crude (UCO) hit a high of 130.50 on March 7 and then it came down to a low of 95 on July 4. Again, crude is a major driver of inflation, yet it has come down significantly from the high.
Precious Metals
Gold (GLD) spiked to 2078 on March 7, and then came down to a low of 1726 last week. Yet another huge move in a short time.
Silver (SLV) on March 7 reached a high of 27.50 and low of 18.70 last week. Again, the invasion of Ukraine sparked high prices which have since fallen.
NASDAQ
The NASDAQ (NDAQ) reached a high of 15,198 on April 4, 2022 and it came down to a low of 11,068.50. Another huge move in a short time.
These indicators show that the inflation news we are getting now are behind the market. It is old news. We have seen a deflationary move over the past few months, which contradicts all the media attention on inflation. The moves in commodities and stocks will now be reflected in the next few months in inflation data, by showing deflation, not inflation. When everyone is talking about one thing; question it. Most people follow that sentiment, but they are almost always behind the markets.
The 10-Year Note is an indication of the cost of money. It is now below 3 percent, which is a very bullish indication–contrary to the fundamentals which say that inflation is running wild and that interest rates will have to rise.
“I believe that the market has already peaked in terms of interest rates,” MontesDeOca said, “and the market has already discounted a rise in rates after the next Fed meeting.”
No one is talking about the deflationary move we have seen in the markets. We will hear about it soon.
Gold Standard Deviation
Measuring the Standard Deviation with Variable Changing Price Momentum Indicator (VC PMI), Nikki the Robot reports that for the weekly gold report, the weekly trend momentum of $1824 is bearish. The weekly VC PMI of $1761 indicates a bearish weekly price momentum. A close above $1761 will negate this bearish price momentum to neutral. If short, take profits at Buy 1 and 2 levels of $1706 to $1672. If long, take profits at the Sell 1 and 2 levels of $1795 and $1850. The reports are available in the Marketplace section of Seeking Alpha.
Even though the trend is bearish, if we close above $1761, that bearishness is negated to neutral and the trend momentum starts to shift. A second close above $1761, activates a bullish trend momentum.
The VC PMI gives us a detailed mathematical map of where the market is likely to go based on standard deviations and reversion to the mean. It gives us levels to watch to know when to buy or sell. The Buy and Sell 1 levels are one standard deviation from the mean, while the Buy and Sell 2 levels are two standard deviations from the mean. The 1 levels have a 90 percent probability of the market reverting from there toward the mean, while the 2 levels have a 95 percent probability of the market reverting from that level back toward the mean. It is not 100 percent, but it is a good way to trade by taking emotion out of your trading.
For further details see:
Gold: The Perfect Storm In 70 Years!