GDEN - Golden Entertainment: Special Dividend Doesn't Outweigh Economic Hurdles Rate Hold
2023-09-15 07:00:00 ET
Summary
- Golden Entertainment announced a special dividend of $2/share recently, but this doesn't outweigh the economic hurdles present.
- GDEN's pre-tax earnings and revenues were flat compared to Q2 last year, with a drop in core EBITDA.
- Economic earnings are flat, and large reinvestments are required to maintain its competitive position, with potentially low rates of return.
- Net-net, rate hold.
Investment operations
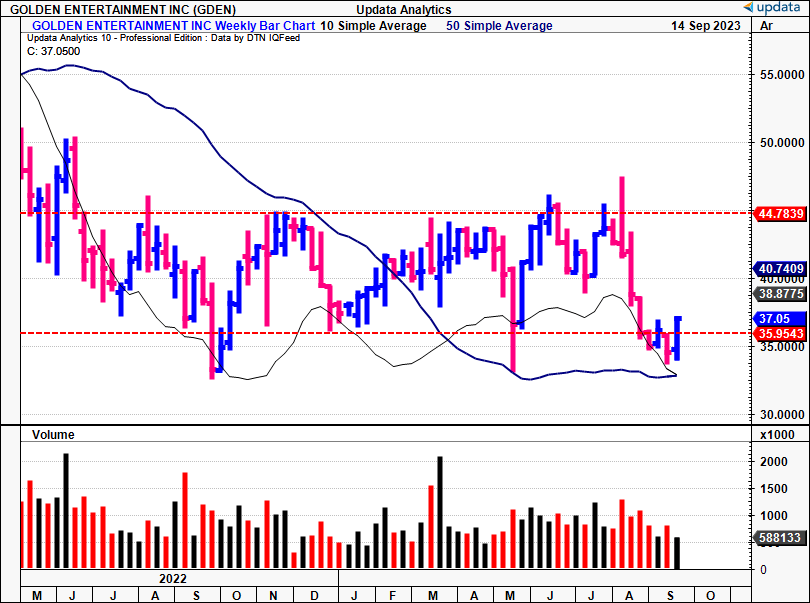
For investors in Golden Entertainment, Inc. ( GDEN ), 2023 has been a fairly bleak ordeal. Shares bounced off a low into the new year, rating from ~$35 to highs of $45 by mid-year. It has sold of sharply leading into the second half, and broke the lower support line of the channel shown in Figure 1.
The company's Q2 numbers didn't help, with revenues and pre-tax earnings down substantially on '22 figures. The company's economic performance, discussed in detail here, hasn't provided the bedrock to warrant a reversal either.
Figure 1.
In fact, in all my coverage of the sector in 2023 I've observed several common themes that reside throughout the majors. I've detailed my thoughts on this below:
- All casinos offer a relatively similar 'product', even in online gambling. It is therefore difficult to differentiate from each other. In this vein, casinos are a lot like mines. Just like iron ore miners—for example—they all sell the same thing: iron ore. No choice on price either, the market sets that. It comes down to how the business can generate sales, how efficient costs are, what level of investment, technology, etc. Casinos are much the same. There's no major differentiation in the product, nor is there any cost leadership, i.e., you can only offer better odds/margins to the customers. Then you're hurting the bottom line.
- Most of the games are the same (tables, slots and so forth), and it's much the same online. What, therefore, makes one casino more attractive to another (for the customer)?
- You could say, " It's the experience, the entertainment, the exclusivity of both" . But then, how long is it before competitors adopt the same methods? How much is it going to cost to retain this competitive position?
- Moreover, the economics are borderline psychotic. For one, you're relying on a constant flow of gamblers. Second, the running costs of the physical assets are exorbitant—the online casinos as well, with hosting and licensing and so on. Then you've got the actual economics of the model itself—wagering, which is based on odds and margins. But we circle back to point (1) here—it's all relatively similar, hard to differentiate.
Relating this back to GDEN, I rate the company a hold based on the factors outlined here today. There is scope for it to rate back to the $40's, but I have a hard time seeing it thrust beyond there for the time being. Net-net, rate hold.
Critical investment factors forming hold thesis
1. Brief overview of operations
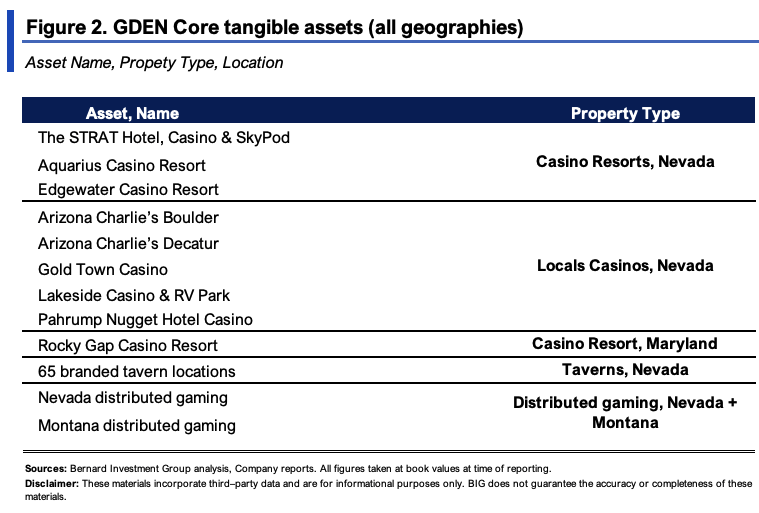
GDEN is a diversified casino and entertainment company. It was founded in 1998, and was formerly known as Lakes Entertainment, before changing the brand in 2015. It runs a platform of gaming assets with a focus on casino operations and distributed gaming. This includes gaming in its branded taverns (located in Nevada). It owns 8 casinos and/or resorts in Nevada as well, along with multiple assets in the rest of Las Vegas. Some of the offerings in its distributed gaming business include the installation and operation of slot machines and amusement devices in non-casino locations (think restaurants, bars, taverns and so forth).
The company's core tangible assets, made up of the various casino and resort locations listed above, are observed in Figure 2. I've included the Rocky Gap asset on this list, but I would note the company divested from this during the latest quarter (discussed later). As you can see, its footprint in Nevada is the central driver to its operations.
2. Overview of latest numbers—downsides in pre-tax earnings
GDEN clipped Q2 revenues of $287mm , flat on Q2 last year, on core EBITDA of $57mm. Gaming revenues were $182.3mm, whilst it brought in $30mm of turnover from accommodation and another $46.5mm from food and beverage sales ("FNB"). Operating income on its gaming business was ~$77mm, down from c.$87mm last year.
Before moving to the economic performance, here's a look at the critical highlights from the quarter:
- Nevada casino resorts pulled in ~$103mmm in turnover, down 4.6% YoY, accompanied by a 28% drop in core EBITDA. For the first half, the division did ~$203mm in turnover, and pulled this to around $60mm in pre-tax income.
- The company also fully divested from its Rocky Gap casino resort, which made up its footprint in Maryland. It sold the asset for $260mm, equivalent 11x TTM EBITDA. Management utilized 67% of the proceeds to pay down the balance of its original term loan.
- It's STRAT business was down 10% YoY and did a substantial 44% drop in EBITDA. This was partly attributed to 15% of rooms being unavailable for the majority of the quarter due to ongoing room renovations. Completion of these renovations occurred in mid-June, but it was estimated that GDEN incurred a revenue loss of approximately $3mm and an EBITDA loss of around $2mm in Q2 due to this disruption. The STRAT's numbers were also influenced by increased labour expenses, reduced per-guest spending, and decreased table game volumes—not the best for the firm's unit economics in my view. Following the completion of the renovation for 537 rooms at The STRAT in June, GDEN initiated renovations for another 118 rooms at the property. It allocated a budget of $8mm from internal cash, the rest financed through proceeds from its Rocky Gap sale.
Figure 3 outlines the company's long-term sales growth and EBITDA margins, and illustrates the H1 FY'23 top-line breakdown. You can see sales are most sensitive to its Nevada casino resorts, which made up 54% of turnover in H1. Sales have also grown at a 5.5% geometric rate since 2018–TTM '23, on rolling EBITDA margins of 19–22% in this time.
BIG Insights
I'd also point out the special dividend of $2 per share announced during the quarter, along with the increased buyback authorization to $100mm. These are factors to consider, and the question in my mind if the special dividend will turn into a recurring one. There's been nothing on this from management to date, but it could be a meaningful driver of value if it is instated, in my view anyway.
As to liquidity—GDEN had $240mm to access on its credit revolver and left the quarter with ~$166mm in cash on hand. Following the sale of Rocky Gap, the net leverage stood at 2.5x, and management wants to reign this in to 1.7x EBITDA by yearend. This is positive in my view, and could separate GDEN from competitors who are highly leveraged and exposed to the rates volatility we've seen last 12 months or so.
3. Economic performance, value drivers and steady-state expectations
- Economic performance 2020–date
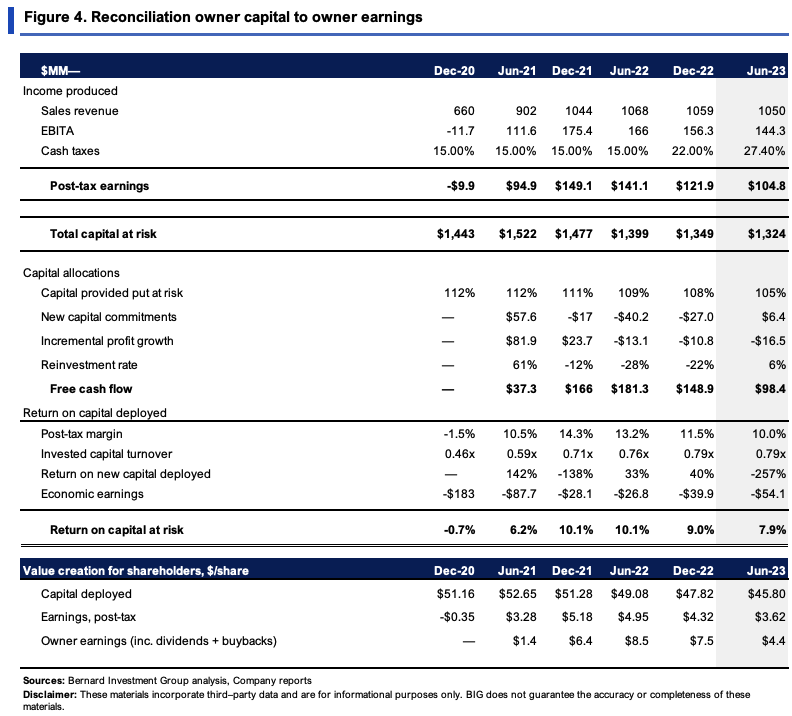
The company has divested heavily over the past 2 years and has disposed $198mm off the balance sheet since 2021. Figure 4 provides a detailed overview of the rate of earnings produced on capital and the incremental investments made.
It now takes $1.32Bn or $45.80/share of invested capital to run the business. The $45.80/share produced $3.60/share in post-tax earnings last period, just 7.9% return on investment. This has been tightening since 2021 as well, placing questions on GDEN's competitive position, in my view.
Circa 8% return on capital deployed isn't a fantastic value proposition. Moreover, the drivers of this aren't either. Around 10% post-tax margin, 0.8x capital turnover. With each $1 in sales bringing in just $0.1 in profit, $1 of investment is collecting just $0.80 in sales. Together, the economics don't square off with a firm that can compound its intrinsic value.
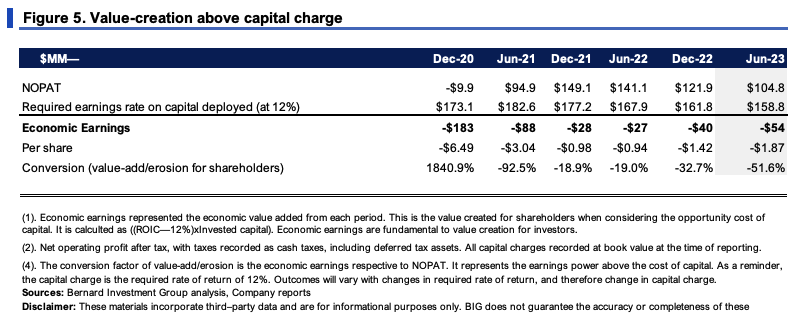
We employ a strict set of criteria with all equity holdings. One of these is producing a 12% return on business capital as a minimum. Buying productive assets is the aim, and we want long-term compounders who can throw off piles of cash, with plenty of opportunities to invest downstream. Not too much to ask, really.
Figure 5 shows what GDEN needed to produce on capital employed to hit this threshold. As noted, it's missed the mark at each point in the series. For example, I would have expected it to generate $158.8mm in trailing NOPAT last quarter on the $1.32Bn of capital invested to fire up the investment cortex. It did $104mm, missing the hurdle by $54mm, resulting in an economic loss of that amount. In December, I was looking for $162mm, but GDEN did $122mm, an economic loss of $40mm. As far as value creation, this certainly isn't it.
- Value drivers underlining performance
A thoughtful analysis of what's driving the above economics is seen in Figure 6. It shows the value drivers for GDEN the last 3 years. Critically, as has been the case in all my casino and gaming coverage, sales and operating margins have been key.
What's puzzling is the NWC density over this time. Casino operators often enjoy competitive benefits in WC, as they are paid upfront in cash (through betting/wagering) and don't have to pay purveyors until a while afterwards.
But each new $1 in sales has required $0.71 of additional NWC for GDEN over the last few years. Meanwhile, fixed asset intensity reduced by $0.67, in line with the asset disposals outlined earlier.
BIG Insights
A useful exercise is to take these steady-state numbers and use them as assumptions for GDEN's future expectations. I've changed the sales growth rate to 2%, upped fixed asset requirements to 5% per $1 in new sales. Figure 7 shows the output.
- To hit the 2% sales growth, it would theoretically need to invest ~$20mm/quarter ($80mm annualized), spinning off $90–$98mm in FCF per quarter. I'd estimate that ~17% of this would need reinvesting to hit the growth targets, resulting in a 2% compounding growth rate to GDEN's intrinsic value, based on an 8-8.5% return on capital.
- If GDEN were to continue the 5% sales growth, with a 5% rate on fixed assets, this would require ~$45mm investment per quarter ($180mm annualized) to throw off just $70–$85mm in FCF, producing the same 8-8.5% ROIC.
This is clear evidence of how growth can be destructive to shareholder value. Because of the low ROICs, GDEN would need to reinvest a higher amount of cash to hit a stated growth target. The higher the growth, the more reinvestment, but the smaller the returns. A vicious cycle.
BIG Insights
Valuation and conclusion
GDEN still sells at 25x forward earnings and 15x forward EBIT, 76% and 18% premiums to the sector respectively. In my view, these are pricey, and to pay $25 for every $1 in future earnings is quite the ask. Here's why.
For starters, investors have priced the company at just 1.4x invested capital, implying a lack of growth in their future expectations. Comparing this to the ROIC/12% spread (0.66x), it would appear GDEN's market value captures the growth potential on offer. For reference, <100% of growth priced into market value is desirable in this model.
BIG Insights
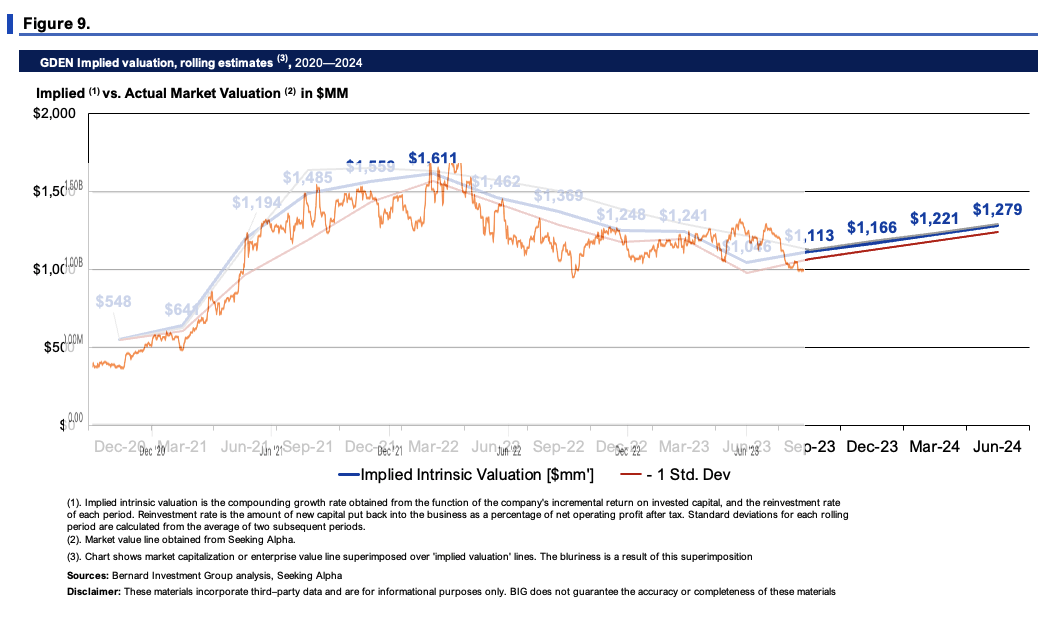
Secondly, compounding the firm's equity line at the function of its ROIC and reinvestment rates to date reveals the market may have it accurately priced at the current levels. As shown in Figure 9, it would appear the market has been a fairly accurate judge of the company's implied intrinsic value. Carrying the calculus out to FY'28 at the steady-state expectations in Figure 7, GDEN could push to $1.28Bn in market value, otherwise $44/share. I have reservations on this, as its 18% margin of safety, and I'd be looking closer to a 30% margin of safety on this name. This supports a hold rating.
In short, GDEN is incurring many of the same headwinds I've observed across the casino and gaming sector in FY'23. Capital-intensive business models, lower rate of earnings on capital invested, and high reinvestment requirements to maintain a competitive position. This is exemplified in the equity returns for GDEN seen this year to date, backed by its soft economic performance. This report unpacked all the equity drivers underlining GDEN's market value from an economic perspective. Findings corroborate a hold rating in my opinion. There is scope for GDEN to rate back to the $40s, but I'd need more of an asymmetrical risk/reward in this name, given the factors outlined. Net-net, rate hold.
For further details see:
Golden Entertainment: Special Dividend Doesn't Outweigh Economic Hurdles, Rate Hold