GLDG - GoldMining Inc.: Hard To Wrap My Head Around This One
2023-09-15 19:16:01 ET
Summary
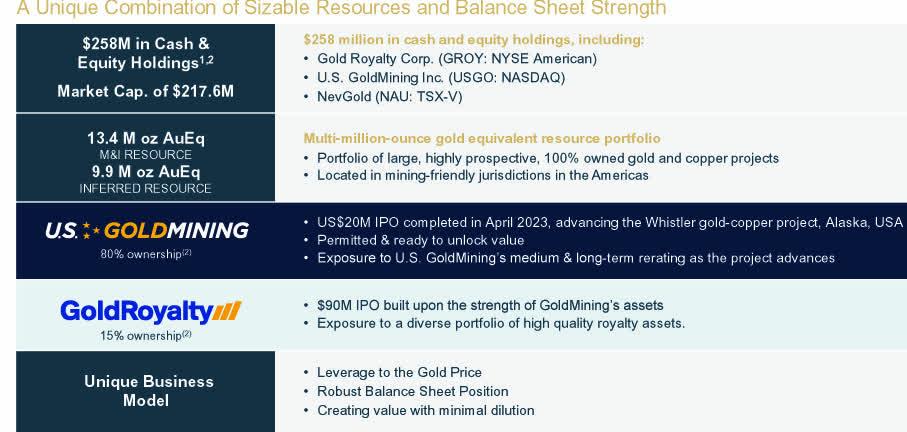
- GoldMining Inc. owns four entities, including GoldMining, Gold Royalty, U.S. GoldMining, and NevGold, with a total gold mineral resource of 13.4 Moz.
- The company's subsidiary, U.S. GoldMining, has commenced its 2023 Phase 1 Drilling Program at the Whistler gold-copper project in Alaska.
- I recommend buying GLDG between $0.80 and $0.79 with possible lower support at $0.77.
Introduction
The Vancouver, British Columbia-based GoldMining Inc. (NYSE: GLDG ) ( GOLD: CA ), a junior exploration company, announced its second-quarter results on July 13, 2023.
Note: I have been covering GLDG regularly since December 2020. This article updates my preceding article , published on June 20, 2023.
1 - GoldMining Inc. assets
As of July 2023, the company owns four distinct entities:
- GoldMining: a 100% owned US company with a total M&I resource of 13 Au Moz from large gold and copper projects.
- Gold Royalty ( GROY ) with a 15% ownership.
- U.S. GoldMining Inc.( USGO ) with 80% ownership.
- NevGold (NAU: TSX-V)
GLDG Recent Snapshot (GLDG Presentation)
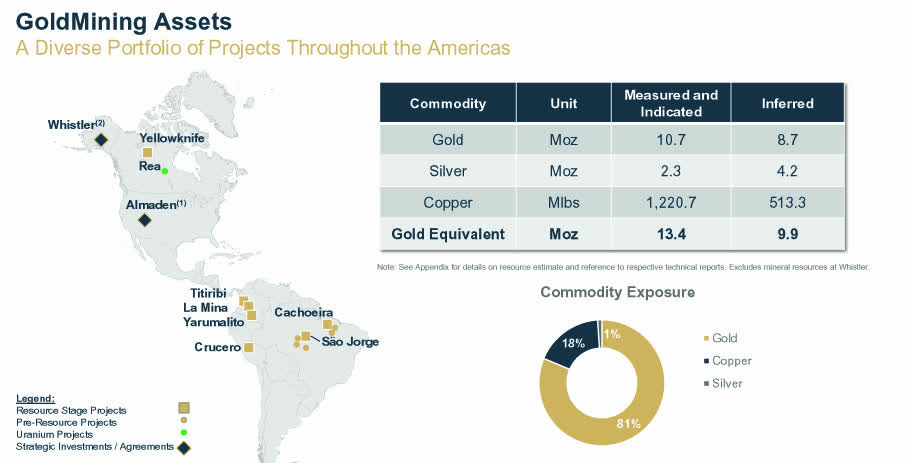
The company's total gold mineral resources measured and indicated are 13.4 Moz, and 9.9 Moz inferred.
GLDG Map Assets (GLDG Presentation)
GoldMining owns 15 projects (stages and pre-resources) in the Americas (Au and Cu with one uranium), including four in North America. A total of 9 projects are at the mineral resources stage.
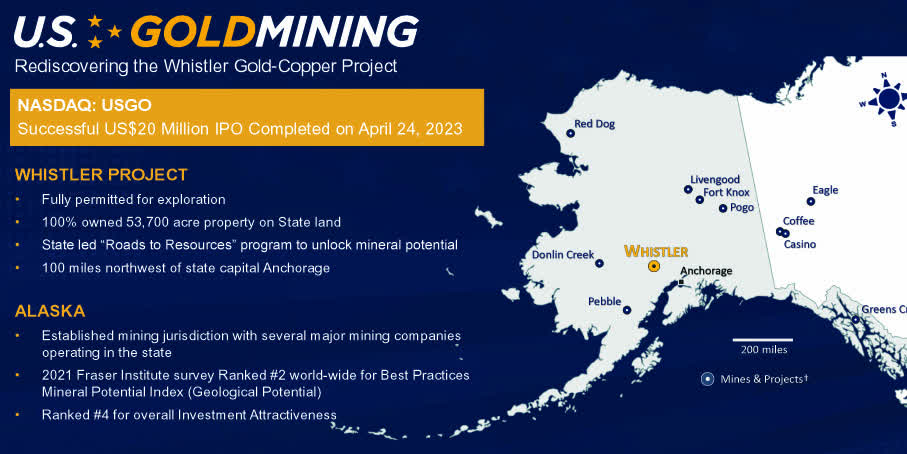
1.1 - The U.S. GoldMining (80% ownership plus warrants)
It is a separate public company focused primarily on advancing the Whistler gold-copper project in Alaska, USA .
The Whistler Project is fully permitted for exploration following the receipt of an amended permit in July 2023 from the Alaska Department of Natural Resources, which will enable potential expansion of the Program if warranted in the future.
On August 21, 2023, the company announced that:
the commencement of the Company's 2023 Phase 1 Drilling Program at its 100% owned Whistler gold-copper project in Alaska, USA... Including core drilling of an initial 5,000 meters at Whistler.
...On completion, this updated mineral resource estimate will underpin a proposed Preliminary Economic Assessment ("PEA") which is currently expected to commence in the second half of 2024.
U.S. GoldMining Inc. quickly dropped from its high in May and is now trading at $8.17 per share after over three months.
As of May 31, 2023, the Company owns 9,878,261 US GoldMining Shares and 122,490 warrants to purchase US GoldMining Shares. The shares owned by the Company (excluding warrants) had a market value of US$80.71 million on September 15, 2023.
After May 31, 2023, US GoldMining agreed with a technical consultant to manage an exploration program for the Whistler Project. The agreement includes an approved work order totaling $5.3 million, from June 1, 2023, to February 29, 2024.
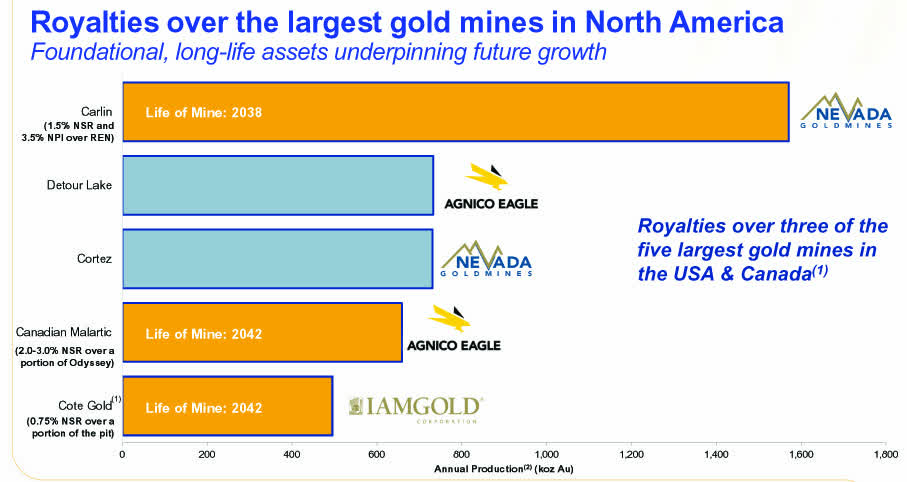
1.2 - Gold Royalty Corp.
The company has 15% ownership in Gold Royalty Corp. ( GROY ). GLDG and GROY have dropped significantly since November 2022 and are down 5% and 51%, respectively, on a one-year basis.
Gold Royalty has an extensive portfolio of over 200 royalties, including those from North America's largest gold mines.
GROY Main Royalties Presentation (GROY Presentation)
Gold Royalty is now providing cash flow to GLDG through its royalties and streams extensive portfolio. Gold Royalty pays a yearly dividend of $0.04 with a dividend yield of 2.92%.
As of May 31, 2023, the Company owns 21,301,253 shares of NYSE American-listed Gold Royalty Corp. ("GRC"). The shares owned by the Company had a fair value of C$55.8 million on May 31, 2023.
2 - Investment Thesis
As I have said in my prior article, the investment thesis for GLDG and most of its subsidiaries is based largely on faith, and investing in such stocks is notoriously risky and unpredictable.
The entire business model comprises many "potentials" that sound credible enough to attract investment but are far from a certain success. Thus, I warn potential investors about investing too much in this company, which may or may not pay off soon, probably after a painful dilution (the company uses its stock as currency through an ATM program).
The most important variable for the stock price is the price of gold and other metals. Depending on the trend and interest in the metal, GLDG will fluctuate depending on its attractiveness.
So far, gold is holding above $1,900 and could turn bullish next week, depending on the FED decision.
A bullish gold outlook could push GLDG above $1 again. However, nothing is guaranteed with Jerome Powell, and he could announce a pause this month followed by a possible 25-point increase the following month, which the Market will not welcome.
Oil prices have jumped significantly in the past few months, and inflation is increasing again - The CPI for August was 3.7% - another issue for the gold price.
GLDG 1Year Chart Gold, Silver Copper (Fun Trading StockCharts)
Hence, I suggest keeping a small long-term GLDG holding as a long bet, but it is critical to regularly trade short-term LIFO over 80% of your position.
GoldMining - Financial Snapshot 2Q23 - The Raw Numbers
Note: All numbers below are indicated in . Filings released by the company are in C$.
| GoldMining |
| 2Q22 |
| 3Q22 |
| 4Q22 |
| 1Q23 |
| 2Q23 |
| Total Revenues in $ Million |
| 0 |
| 0 |
| 0 |
| 0 |
| 0 |
| Net Income in $ Million |
| -2.23 |
| -2.23 |
| -3.26 |
| -4.54 |
| -5.12 |
| EBITDA $ Million |
| -2.38 |
| -1.75 |
| -2.89 |
| -2.66 |
| -4.18 |
| EPS diluted in $/share |
| -0.02 |
| -0.02 |
| -0.02 |
| -0.03 |
| -0.03 |
| Operating Cash Flow in $ Million |
| -2.07 |
| -2.04 |
| -2.34 |
| -2.88 |
| -4.10 |
| Capital Expenditure in $ Million |
| 0.09 |
| 0 |
| 0 |
| 0.17 |
| 0.22 |
| Free Cash Flow in $ Million |
| -2.16 |
| -2.04 |
| -2.34 |
| -3.05 |
| -4.31 |
| Total Cash $ Million |
| 6.82 |
| 3.11 |
| 6.20 |
| 5.68 |
| 19.28 |
| Total Long term Debt (including current) In $ Million |
| 9.85 |
| 7.26 |
| 6.56 |
| 4.90 |
| 3.21 |
| Shares outstanding (diluted) in Million |
| 152.35 |
| 155.11 |
| 158.34 |
| 166.88 |
| 168.72 |
Source: Company release
The company has $3.21 million in debt and $19.28 million in cash in 2Q23. Shares Outstanding diluted jumped to 168.72 million.
The increase in cash and cash equivalents was primarily the result of cash proceeds from the ATM program and net proceeds from US Goldmining's IPO during the six months that ended May 31, 2023.
For the three-month ended May 31, 2023, the Company incurred a total operating loss of $5.12 million , compared to $4.54 million on February 28, 2022.
ATM program:
During the three months ended May 31, 2023, the Company issued 1,657,709 common shares under the ATM Program for gross proceeds of $2,403, with aggregate commissions paid to agents of $60.
Technical Analysis and Commentary
GLDG TA Chart Short-Term (Fun Trading StockCharts)
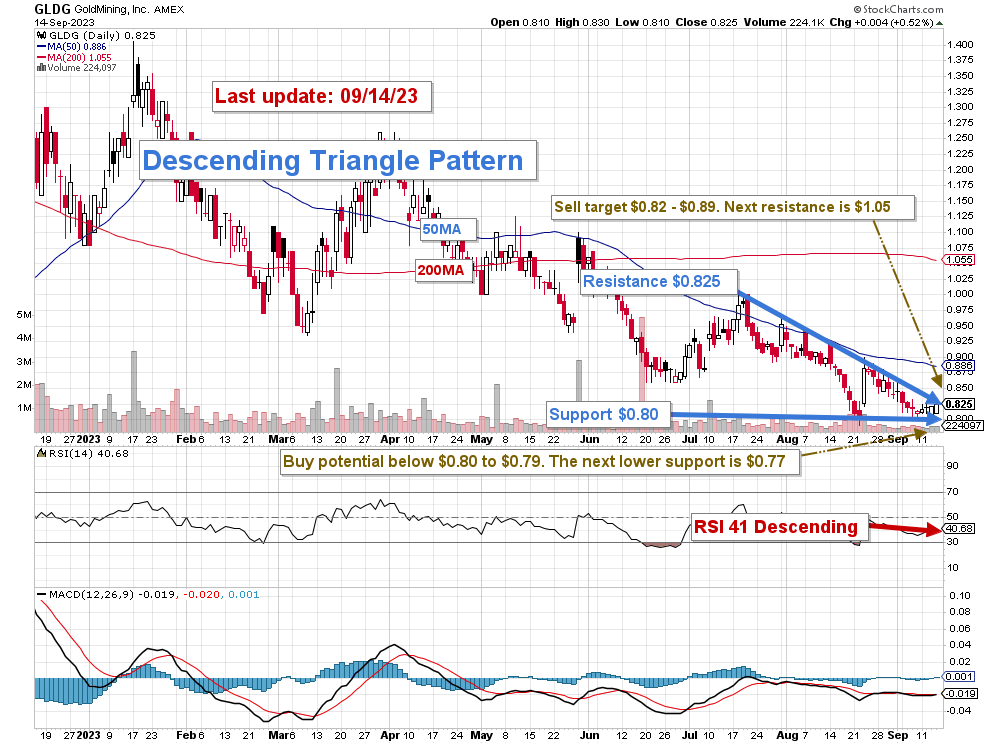
GLDG forms a descending triangle pattern with resistance at $0.825 and support at $0.80. We are at the end of the pattern life (Apex), and it is perhaps time to wait for a possible breakout, which will depend on the FED's decision on interest.
A regular descending triangle pattern is commonly considered a bearish chart pattern or a continuation pattern with an established downtrend. However, a descending triangle pattern can also be bullish, with a Breakout: Definition, Meaning, Example, and What It Tells You in the opposite direction, and is known as a reversal pattern.
I suggest selling between $0.82 to $0.89 with potential higher support at $1.05 and accumulating a small position between $0.80 and $0.79 with possible lower support at $0.77.
A warning: the stock is subject to wild swings occasionally and generally is hard to trade, lacking liquidity.
Watch the gold price like a hawk.
Warning: The TA chart must be updated frequently to be relevant. The chart above has a possible validity of about a week. Remember, the TA chart is a tool only to help you adopt the right strategy. It is not a way to foresee the future. No one and nothing can.
For further details see:
GoldMining Inc.: Hard To Wrap My Head Around This One