OILX - GOM Drop Drops U.S. April Oil Production
2023-07-04 05:40:00 ET
Summary
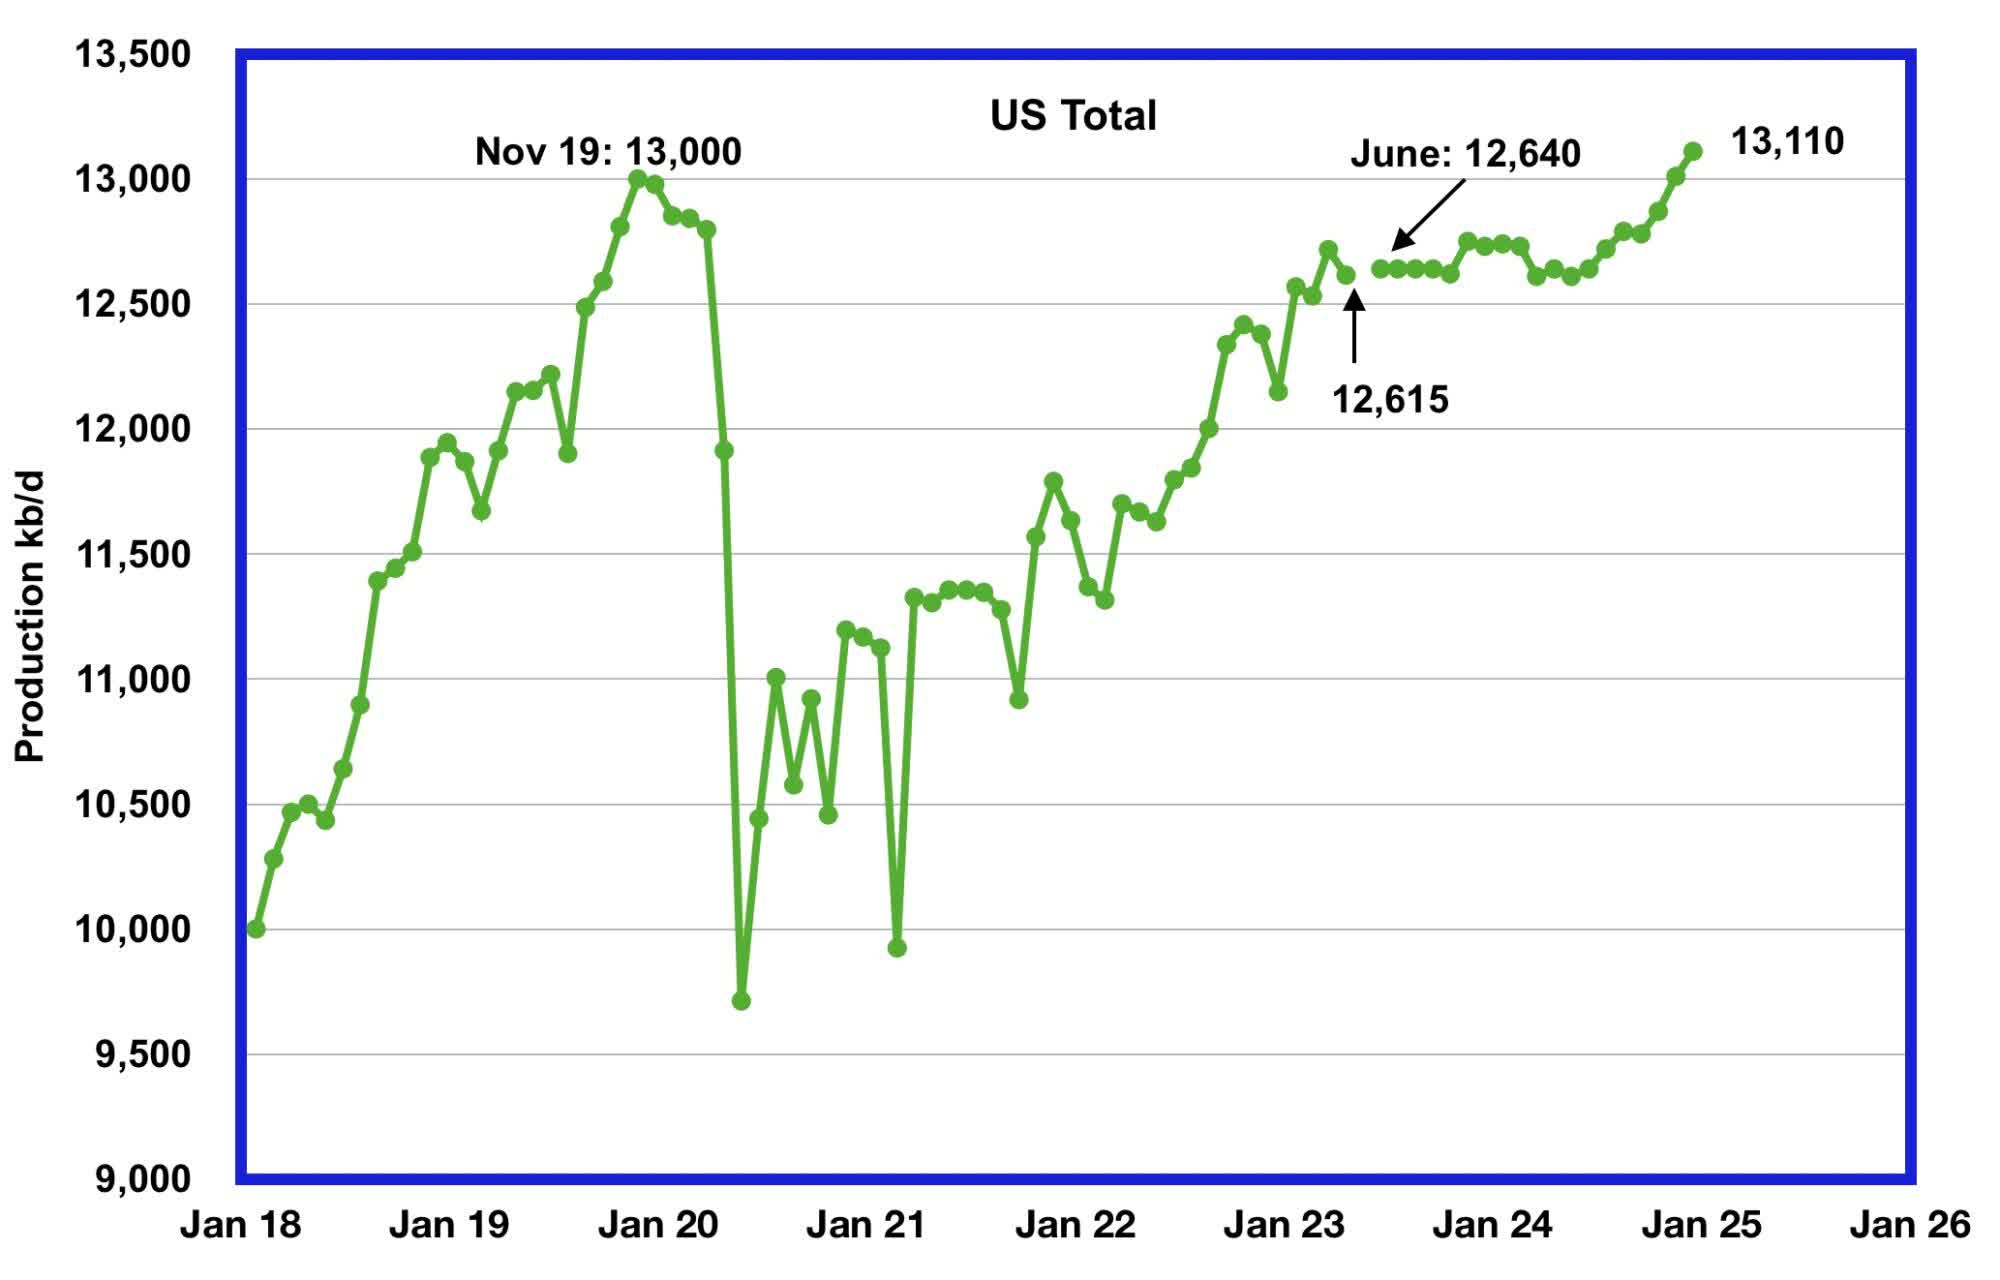
- U.S. April oil production decreased by 102 kb/d to 12,615 kb/d, a drop from last month’s post pandemic high of 12,717 kb/d.
- The Drilling Productivity Report (DPR) uses recent data on the total number of drilling rigs in operation along with estimates of drilling productivity and estimated changes in production from existing oil wells to provide estimated changes in oil production for the principal tight oil regions.
- The number of DUCs available for completion in the Permian and the four major DPR oil basins has fallen every month since July 2020 and continued to decrease in May.
A guest post by Ovi
All of the Crude plus Condensate (C + C) production data for the US state charts comes from the EIA?s Petroleum Supply monthly PSM which provides updated information up to April 2023.
U.S. April oil production decreased by 102 kb/d to 12,615 kb/d, a drop from last month’s post-pandemic high of 12,717 kb/d. Note that March’s output was revised up by 21 kb/d from 12,696 to 12,717 kb/d.
Onshore production increased by 37 kb/d to 10,447 kb/d.
The green graph from June 2023 onward is taken from the June 2023 STEO and is the forecast for U.S. oil production from June 2023 to December 2024. Output for December 2024 is expected to be 13,110 kb/d which is 170 kb/d higher than forecast in the previous post. Also it is 110 kb/d higher than the November 2019 peak of 13,000 kb/d. Production will be essentially flat from May 2023 to May 2024 before production begins to rise.
Oil Production Ranked by State
Listed above are the 10 states with the largest US oil production along with the Gulf of Mexico. These 10 states accounted for 83.0% of all U.S. oil production out of a total production of 12,615 kb/d in April 2023. Note that GOM MoM production is down more than overall U.S. production.
Note that New Mexico’s oil production, for this month, has passed the GOM’s production.
On a YoY basis, US production increased by 947 kb/d with the majority, 720 kb/d coming from Texas and New Mexico.
State Oil Production Charts
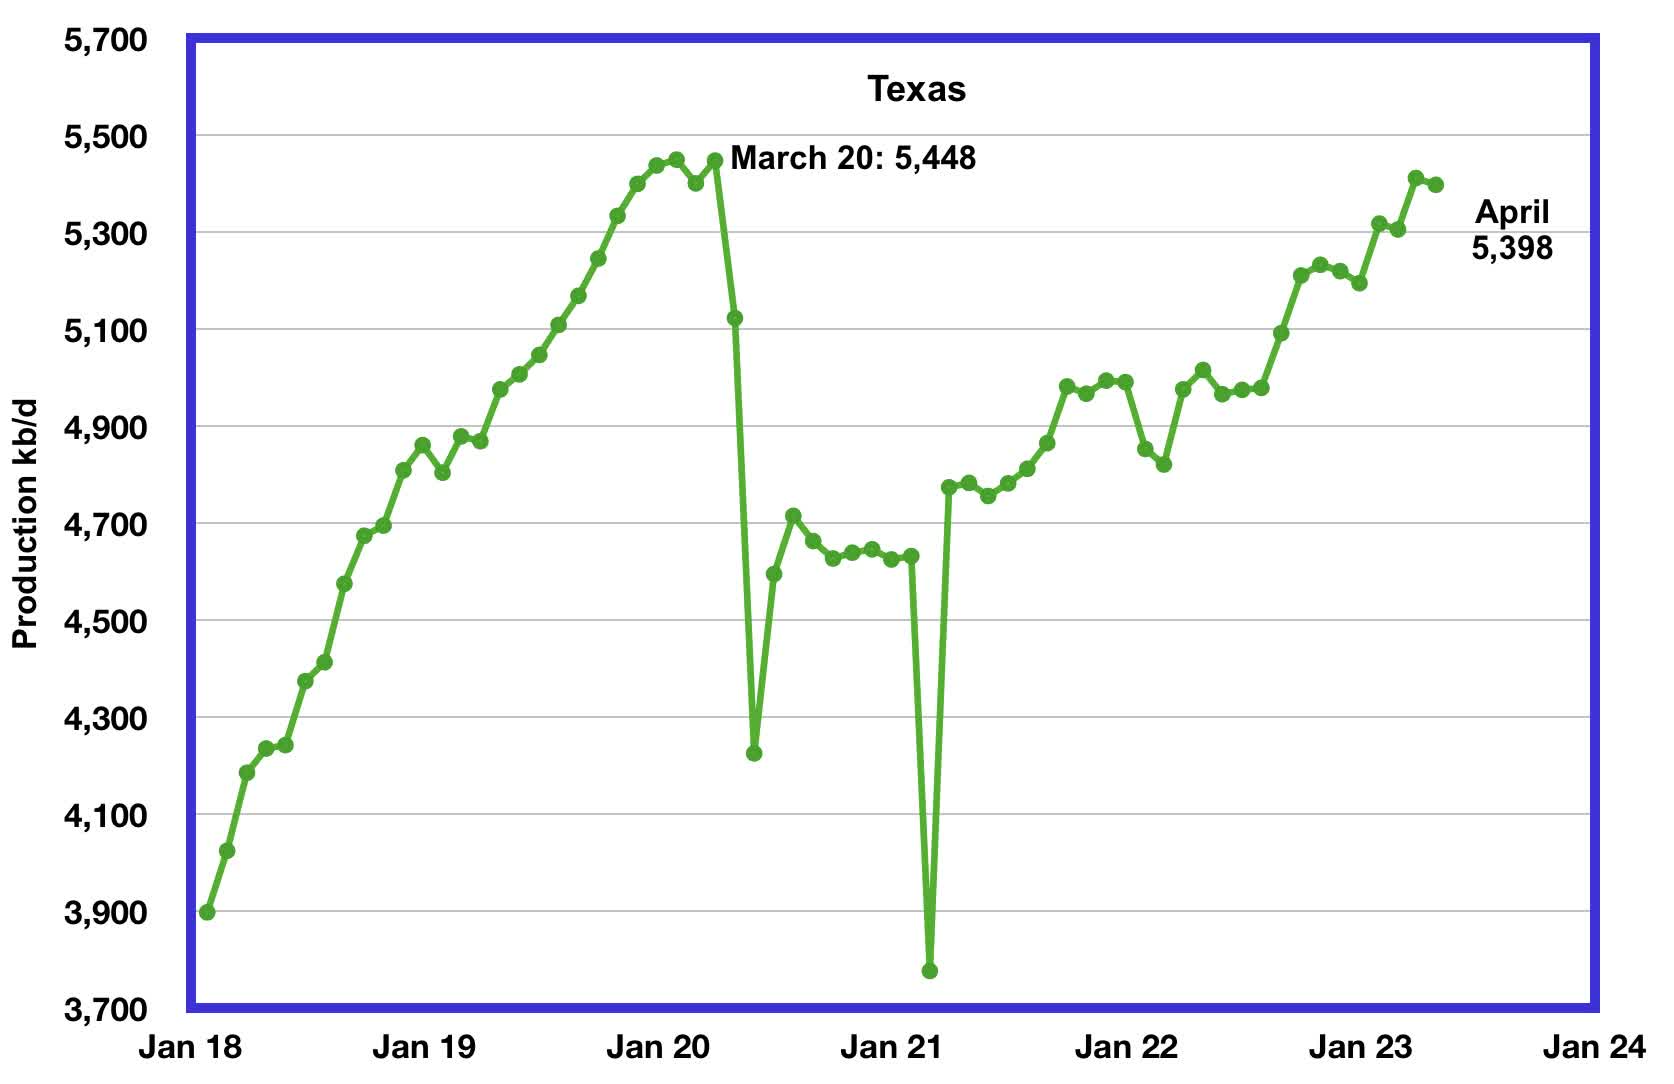
Texas production decreased by 14 kb/d in April to 5,398 kb/d. April’s output is 50 kb/d short of the March 2020 high of 5,448 kb/d.
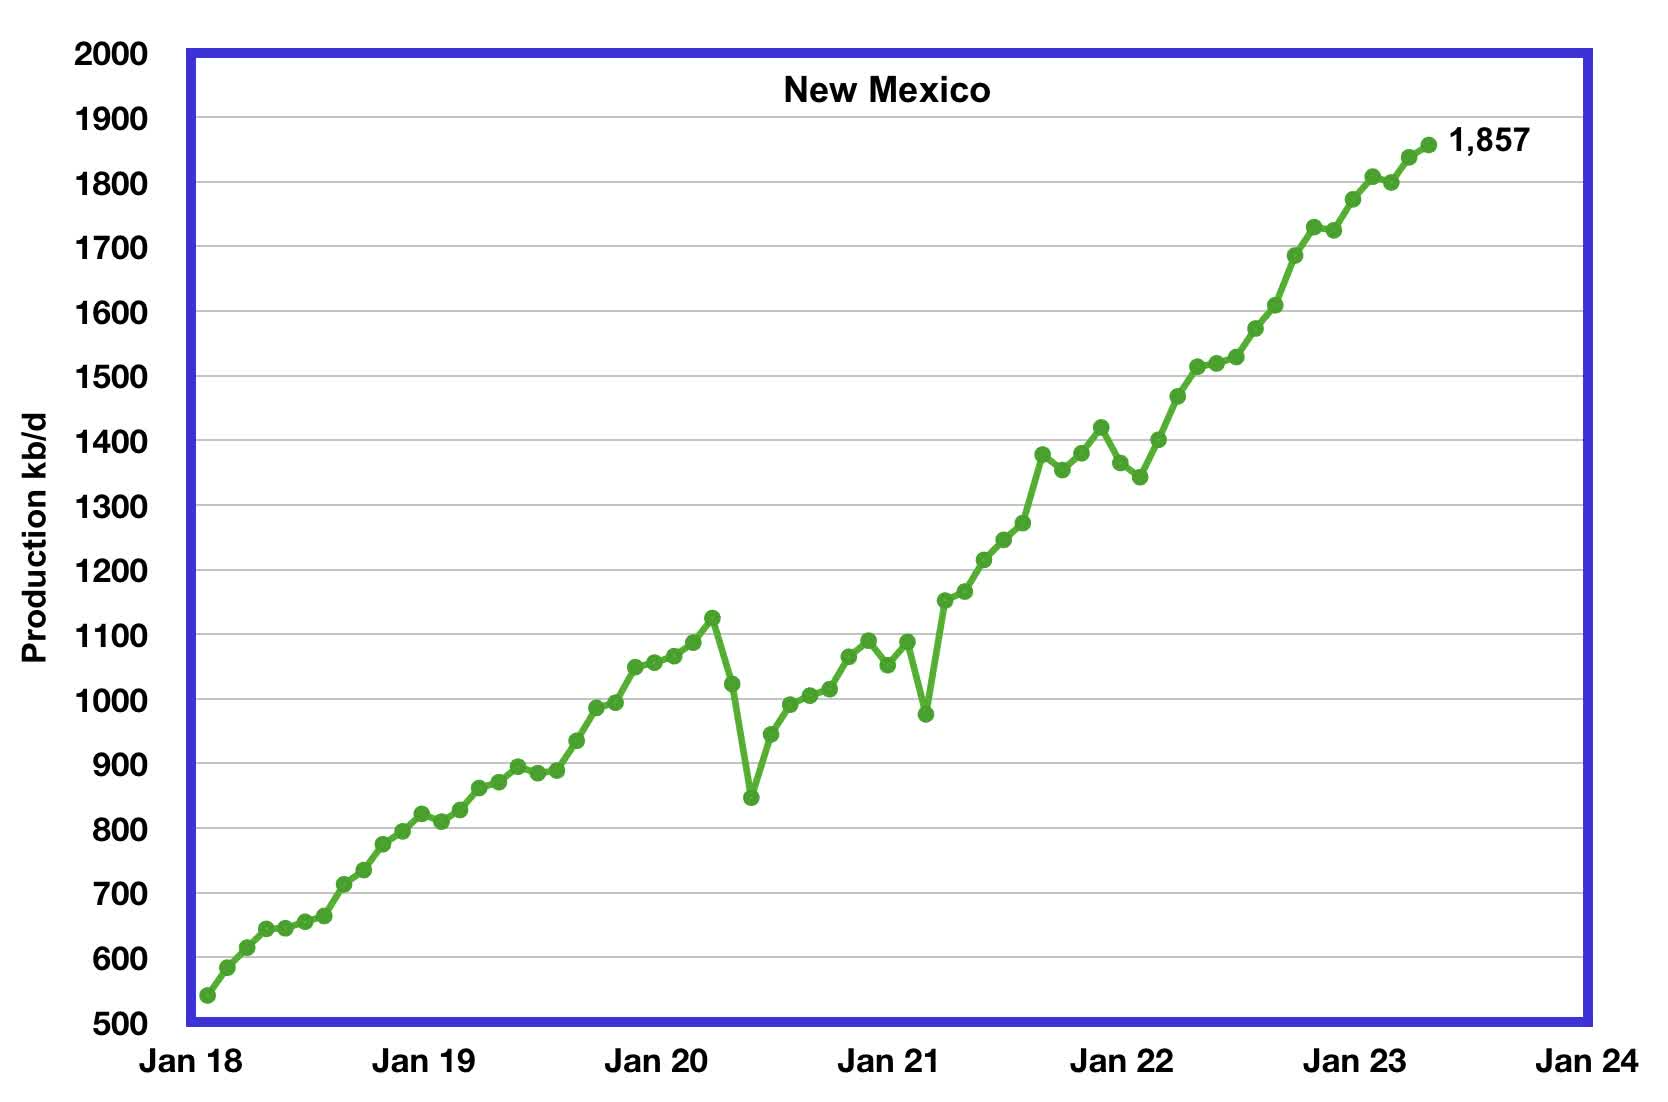
New Mexico’s April production continued at a record level but was little changed from March. April’s production increased by 19 kb/d to 1,857 kb/d.
Of the 1,857 kb/d, 1,633 kb/d came from the Lea and Eddy counties, according to this source . More production information from these two counties is reviewed in the Goehring and Rozencwajg section further down.
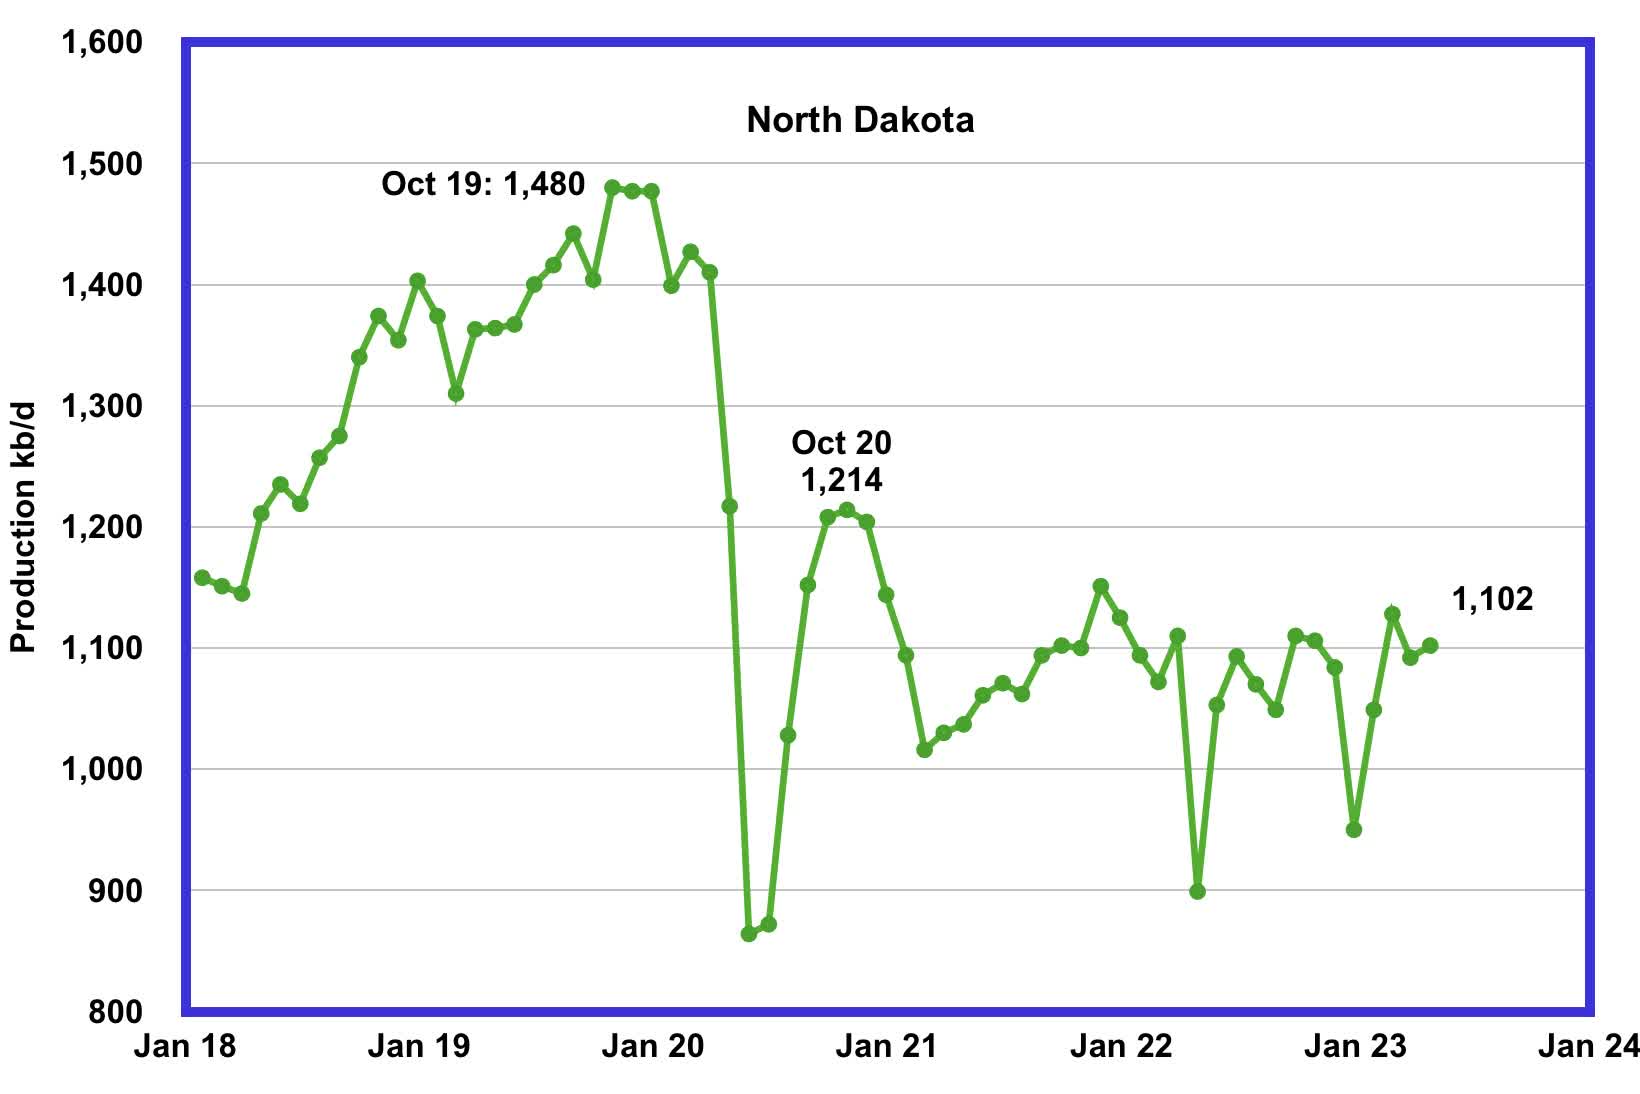
North Dakota’s April oil production has recovered from December’s extreme cold weather impacted production. However April’s increase was essentially flat. Output increased by 10 kb/d to 1,102 kb/d. Current production is unchanged from January 2021, 1,094 kb/d, and production over the past two years has been on a plateau.
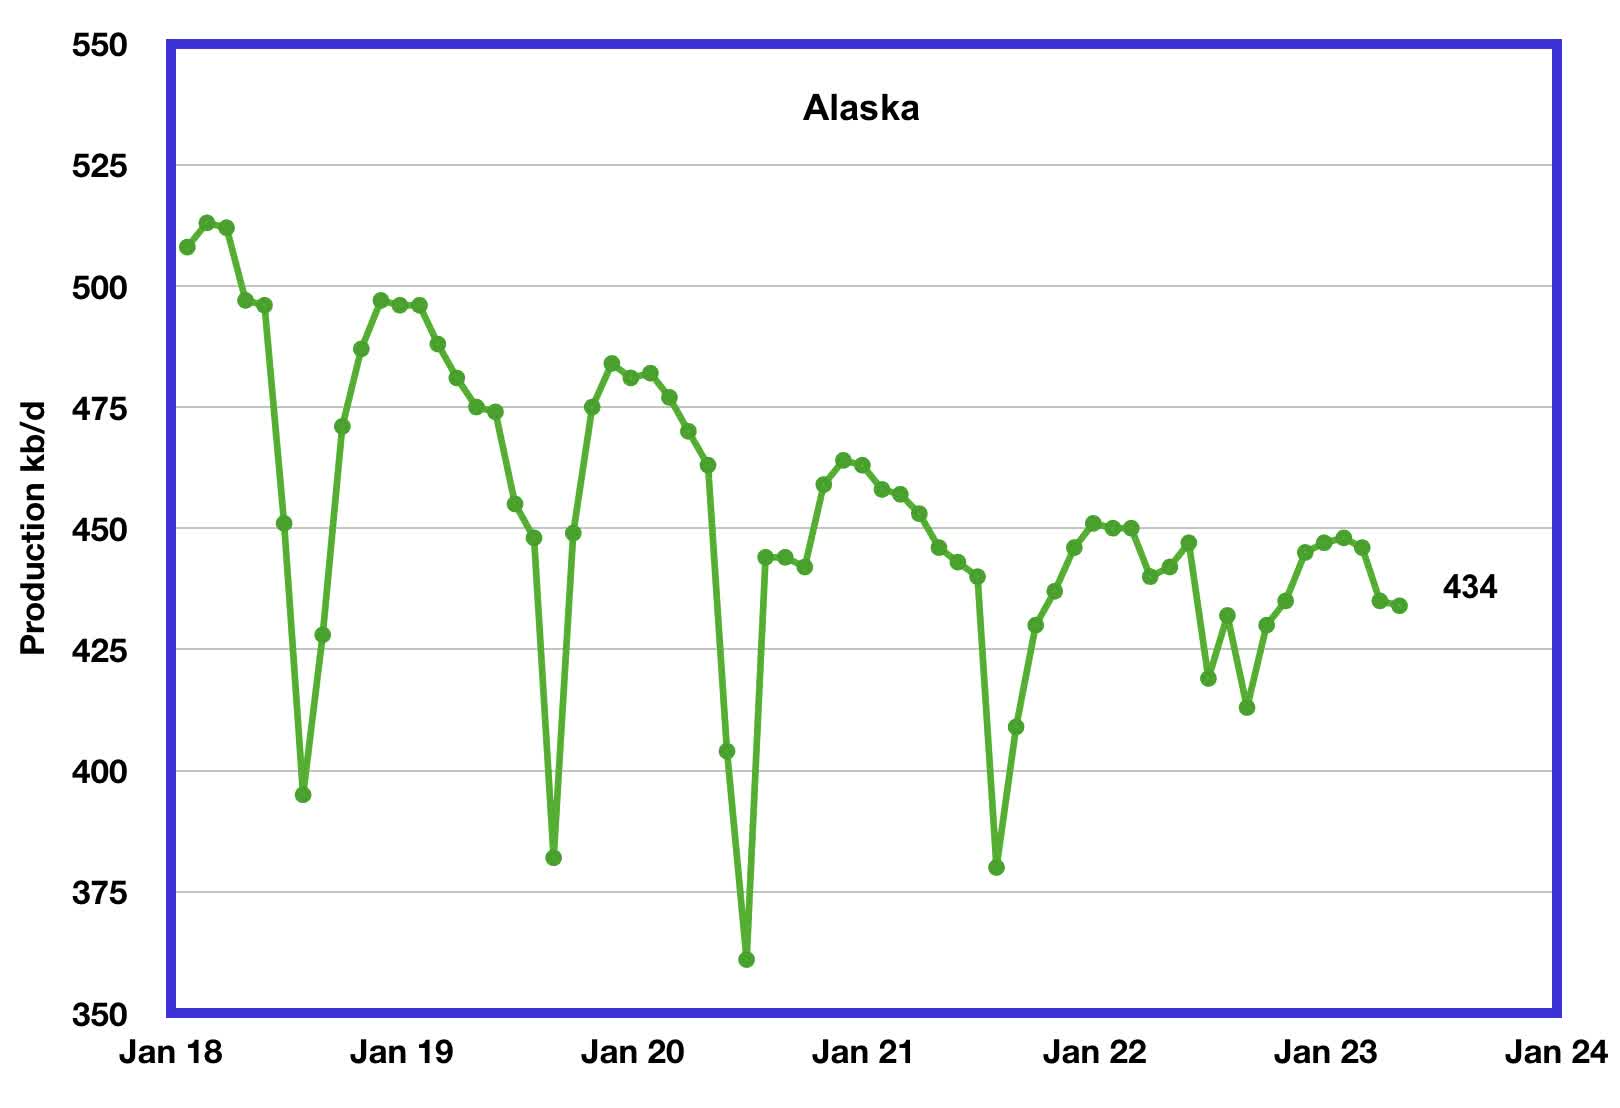
Alaska?s April output decreased by 1 kb/d to 434 kb/d. February/March is the beginning of Alaska’s annual production declining phase. However note how the low summer production points in the last two years have been rising.
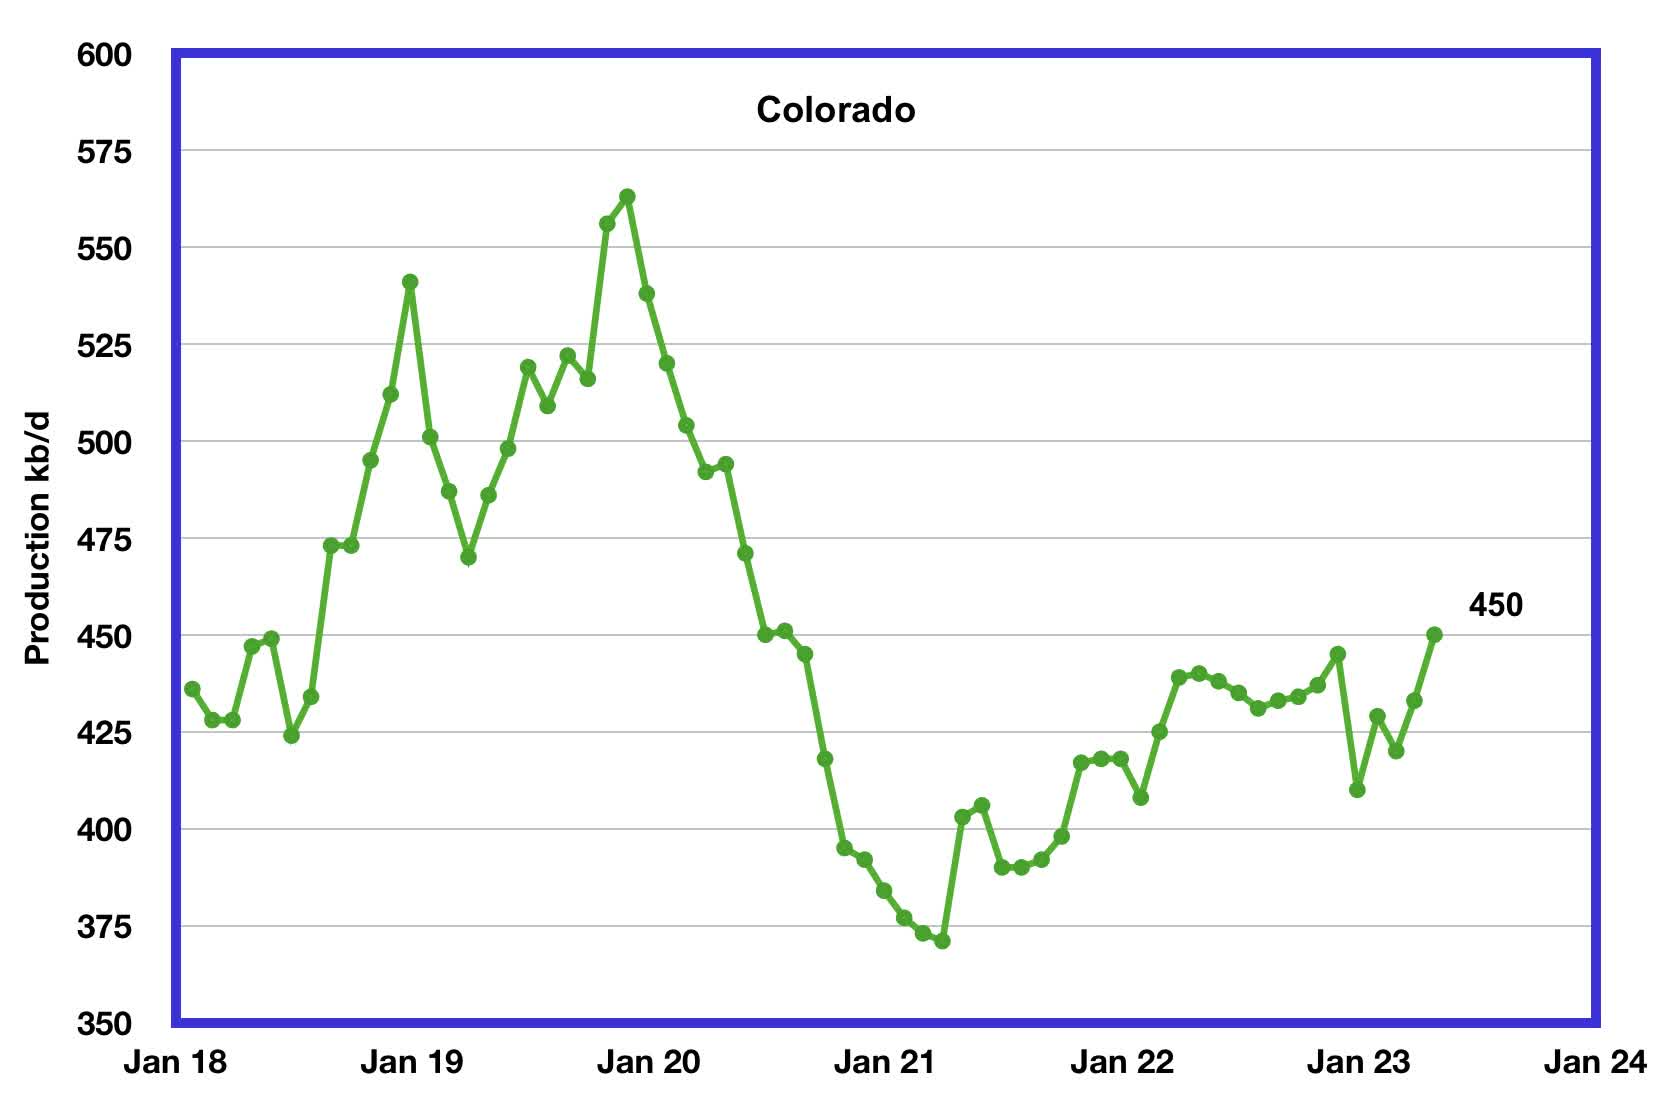
Colorado?s April production increased by 17 kb/d to 450 kb/d, a new post-pandemic high.
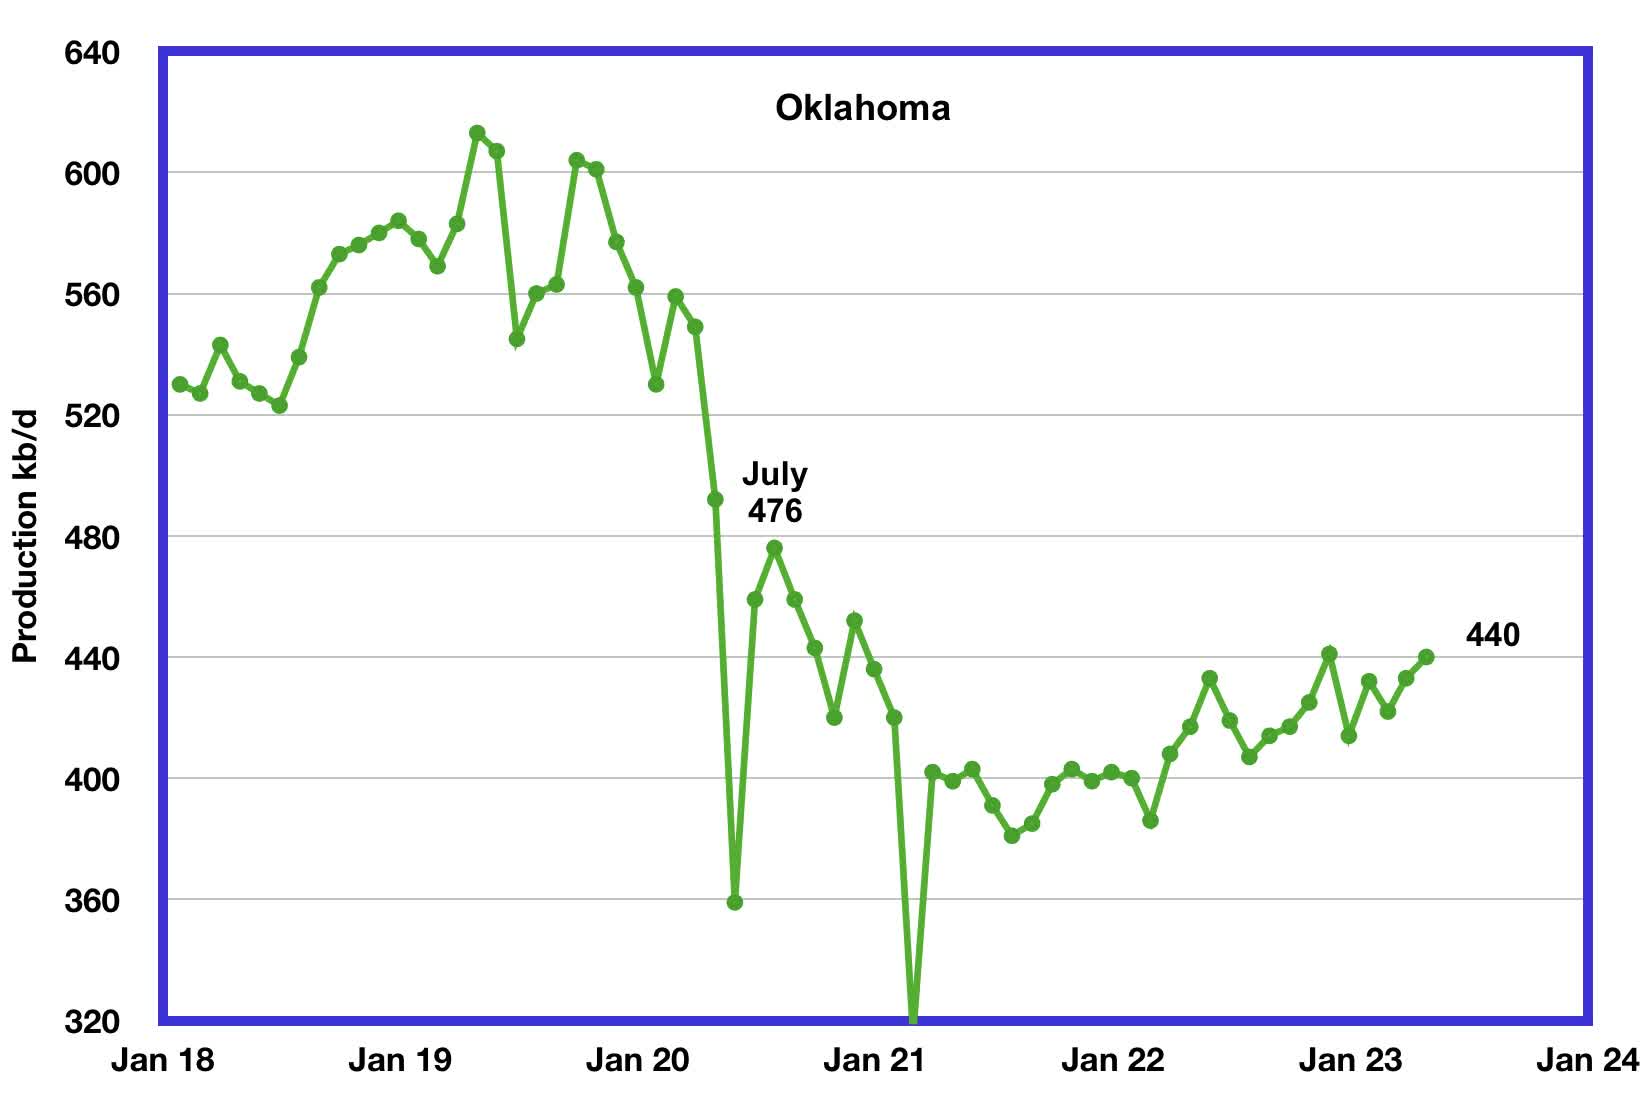
Oklahoma’s output in April rose by 7 kb/d to 440 kb/d. Production remains 36 kb/d below the post-pandemic July 2020 high of 476 kb/d.
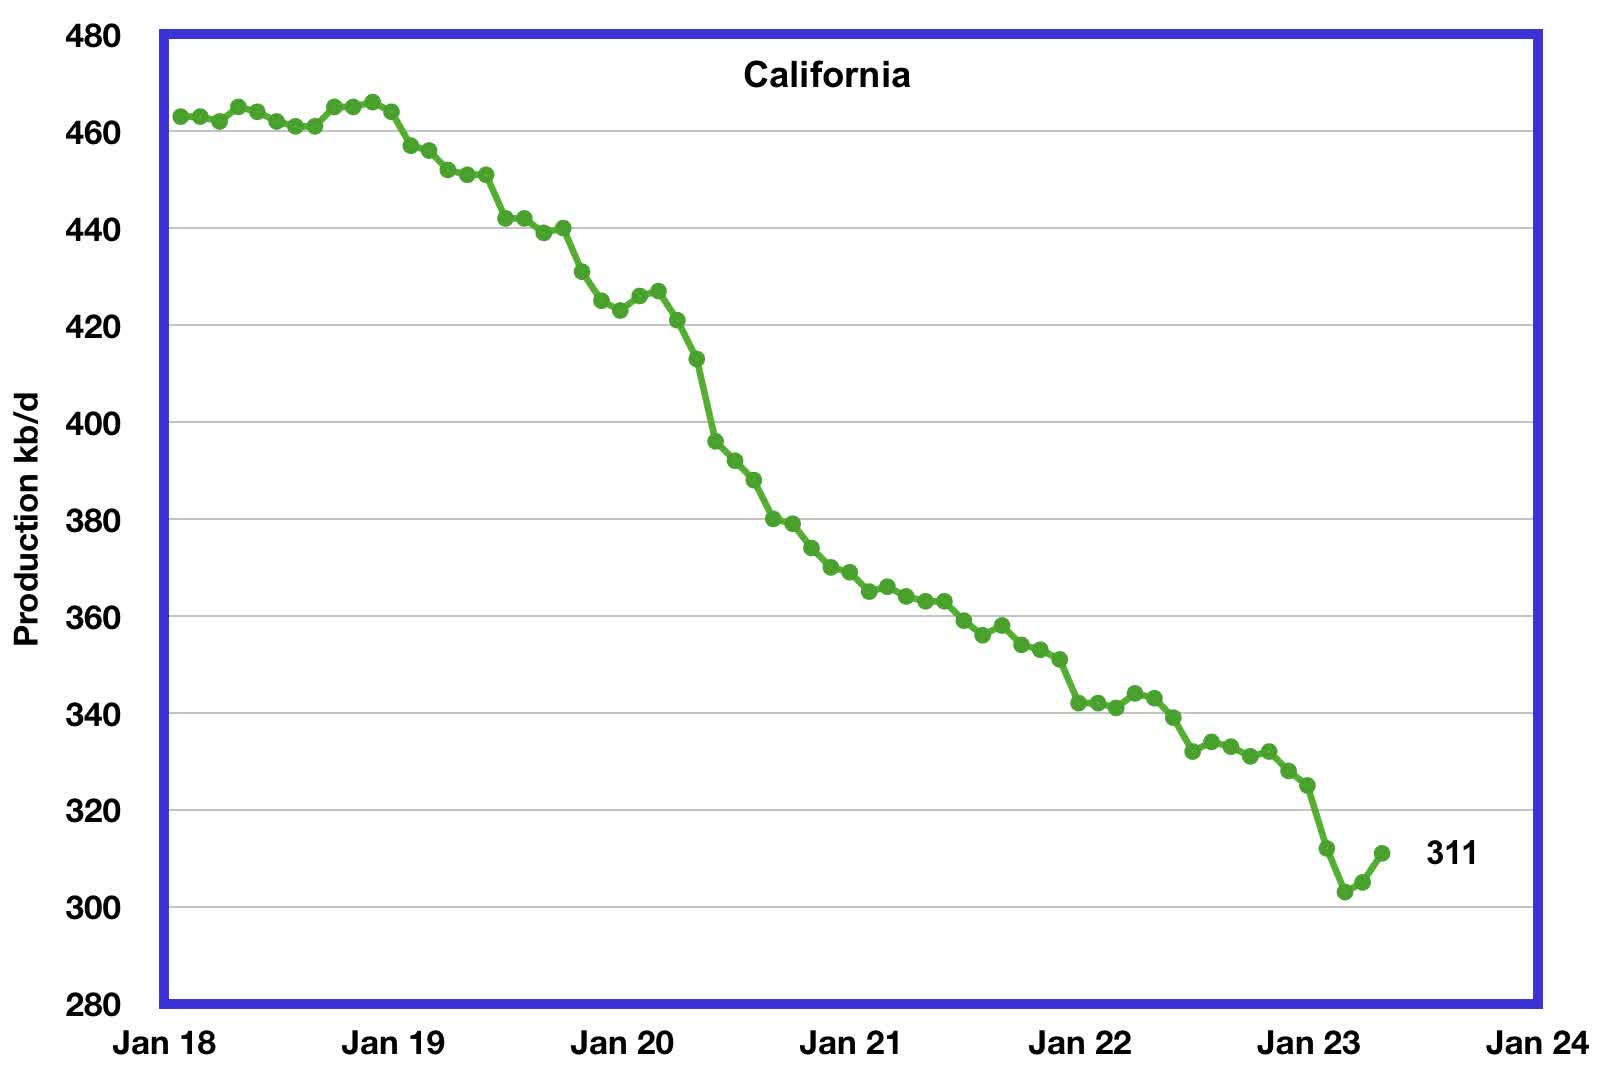
California?s overall slow output decline trend accelerated in January and February. However for March and April production rose. April output increased by 6 kb/d to 311 kb/d.
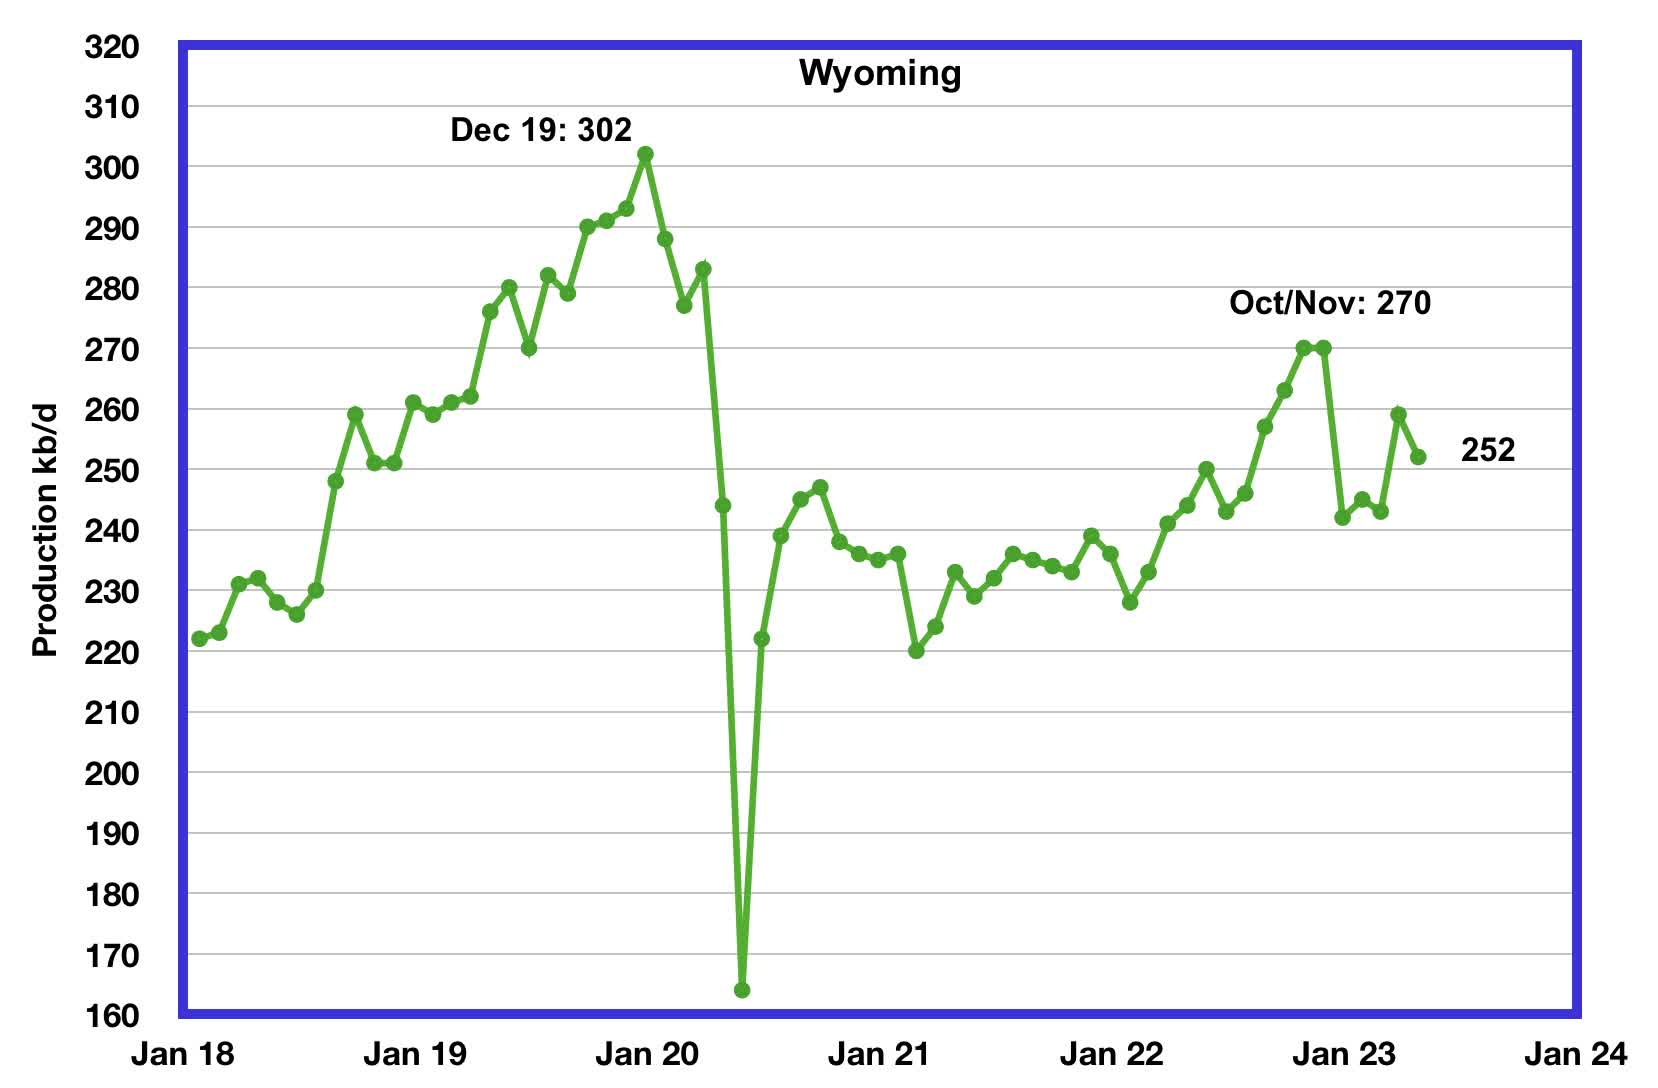
Wyoming’s oil production has been on a slow unsteady uptrend from the low of 220 kb/d in February 2021 due to increased drilling. In October and November 2022 output reached a post-pandemic high of 270 kb/d. April’s oil production decreased by 7 kb/d to 252 kb/d.
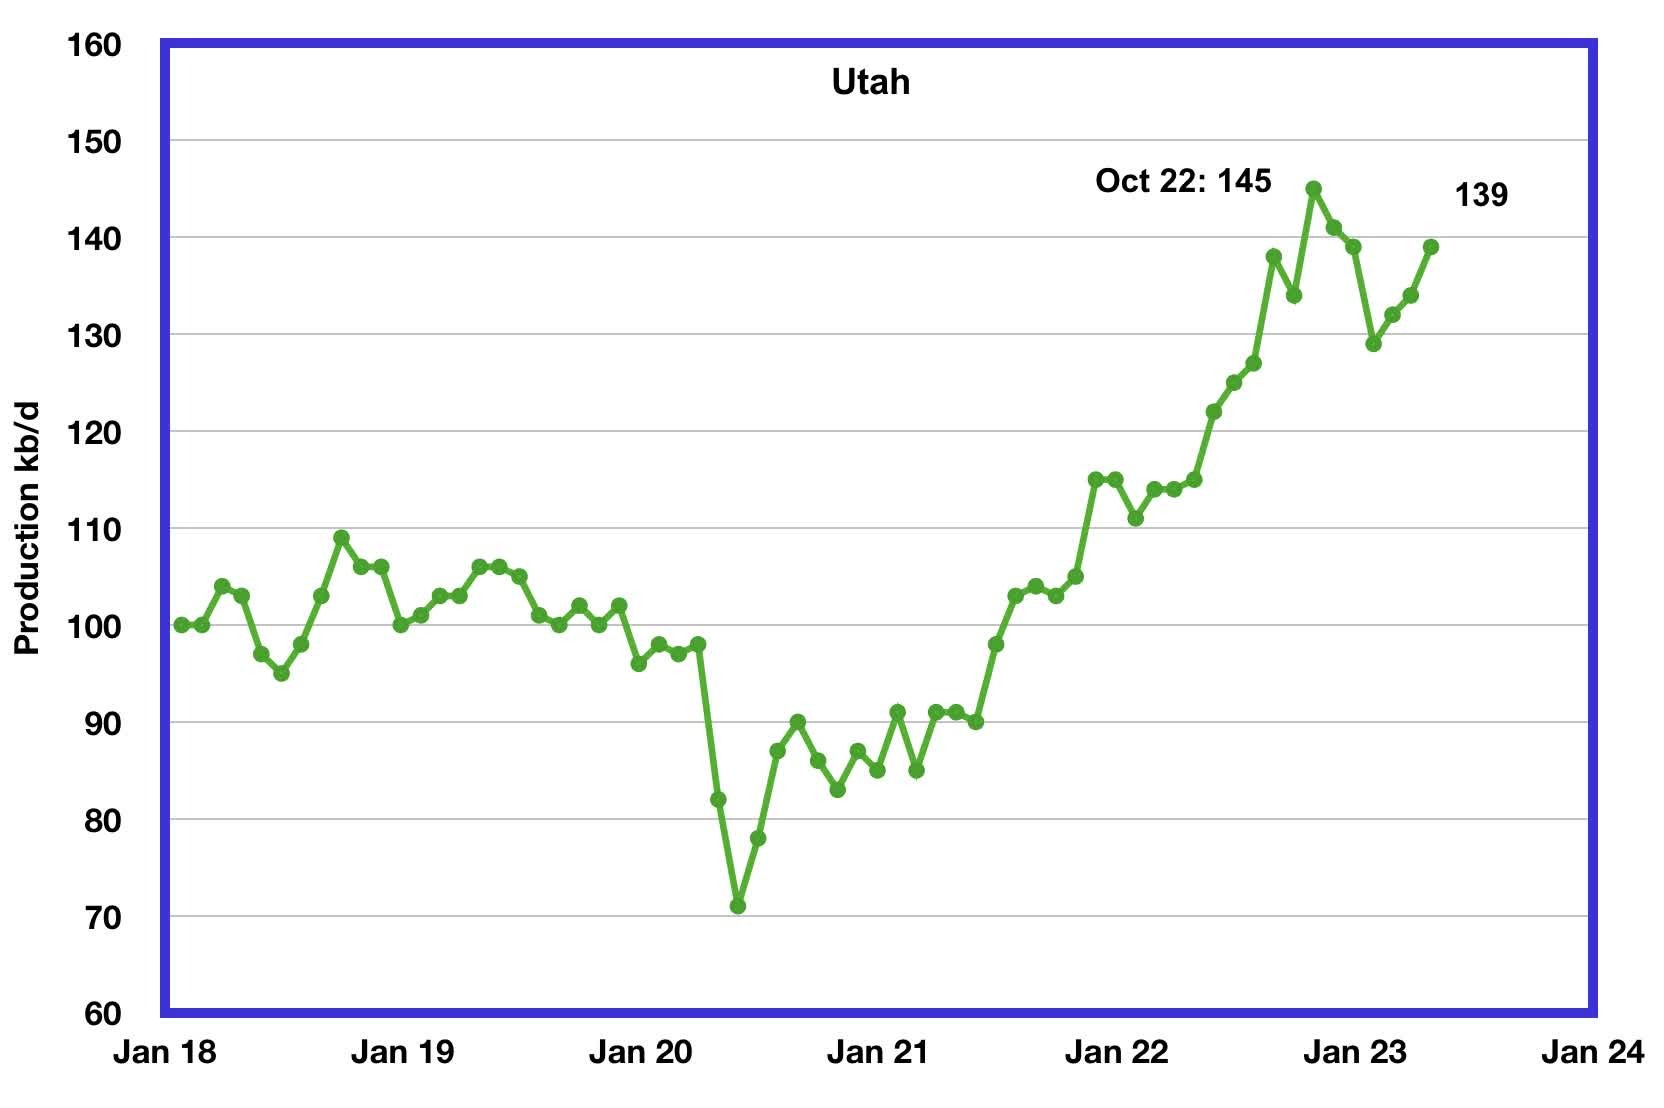
Utah’s oil production reversed its declining trend in February 2023. April’s production increased by 5 kb/d to 139 kb/d and is down 6 kb/d from the October high of 145 kb/d.
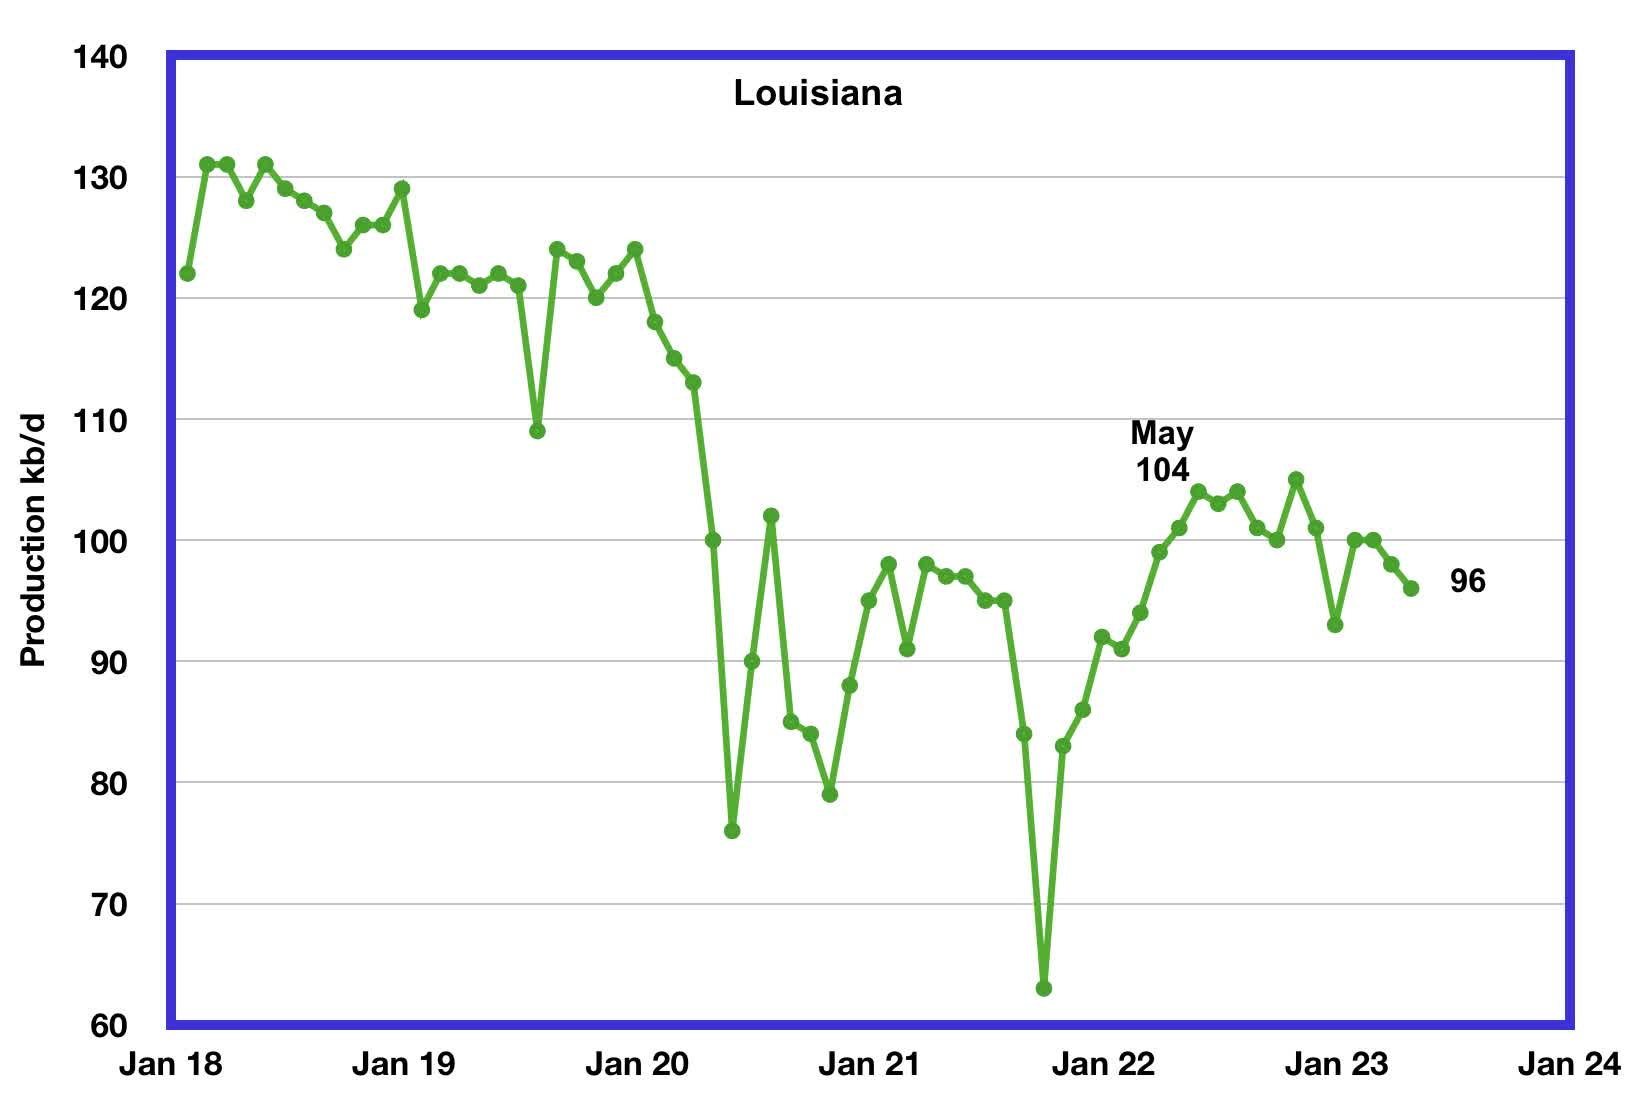
Louisiana’s output rose from the low of 63 kb/d in September 2021 to 104 kb/d in May 2022. Since then output has entered a slow declining phase. April’s production dropped by 2 kb/d to 96 kb/d and is 8 kb/d lower than May 2022.
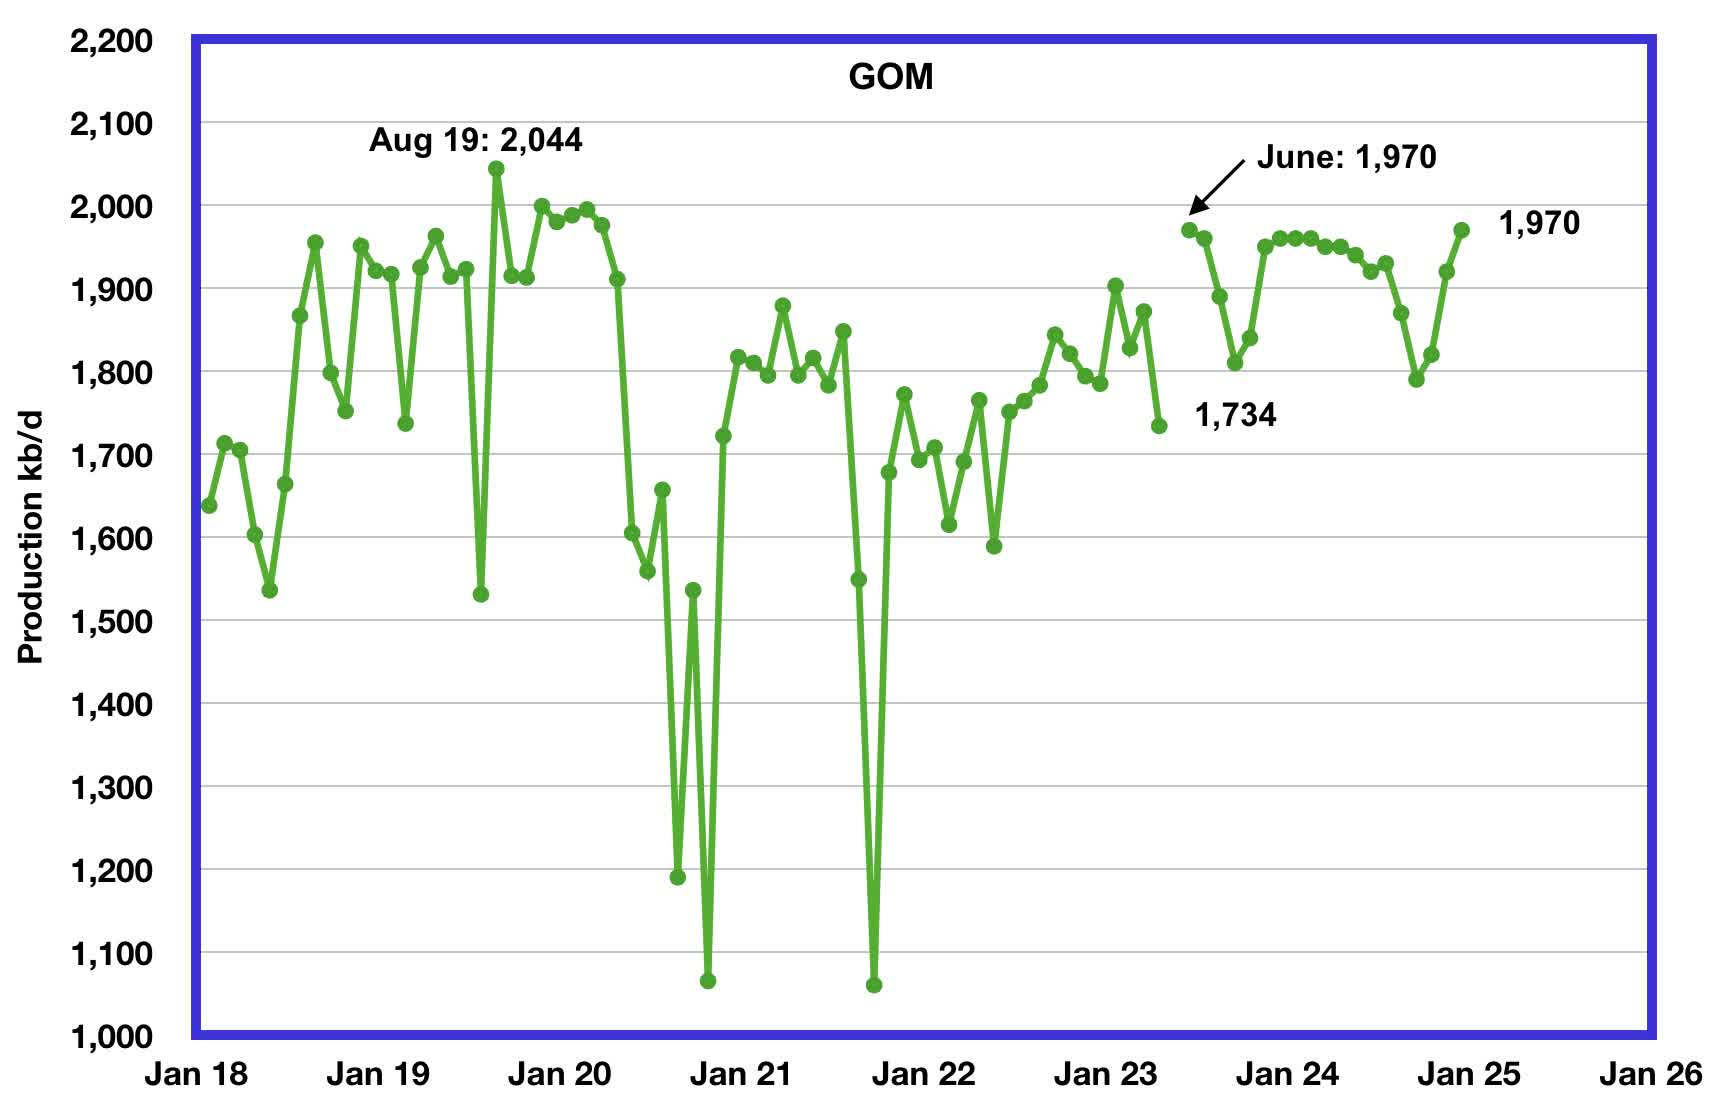
GOM production dropped by 138 kb/d in April to 1,734 kb/d.
The June 2023 STEO projection for the GOM output has been added to this chart and it projects that output in June 2023 will rise to 1,970 kb/d, down by 30 kb/d projected in the May STEO. This could be a reasonable estimate since Shell (SHEL) announced that the Vito platform had begun production on February 15, 2023.
According to this source , GOM production is expected to reach 2,000 kb/d in 2023. However since February, production has dropped and it could be related to problems bringing the Vito platform online.
It is not known if the GOM decline shown after June 2023 is related to extensive maintenance.
A Different Perspective on US Oil Production
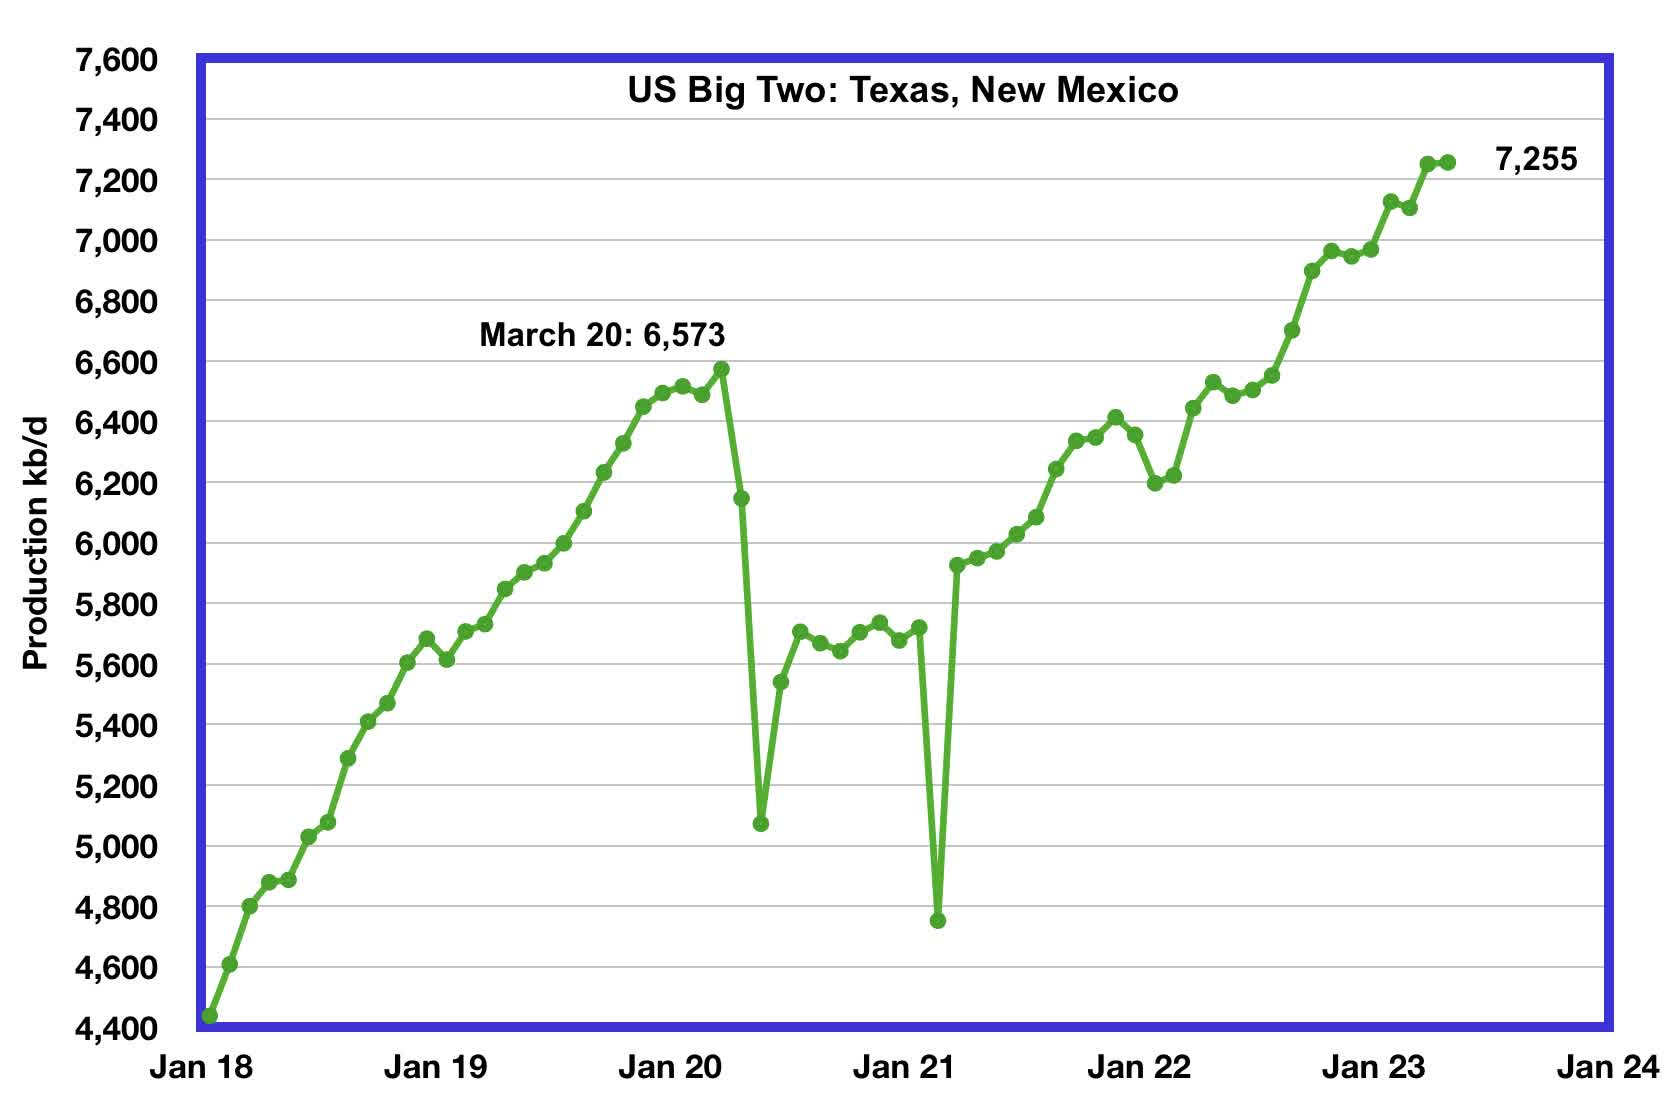
The Big Two states’ combined oil output for Texas and New Mexico.
April’s production in the Big Two states increased by a combined 5 kb/d to 7,255 kb/d with New Mexico contributing 19 kb/d while Texas dropped by 14 kb/d.
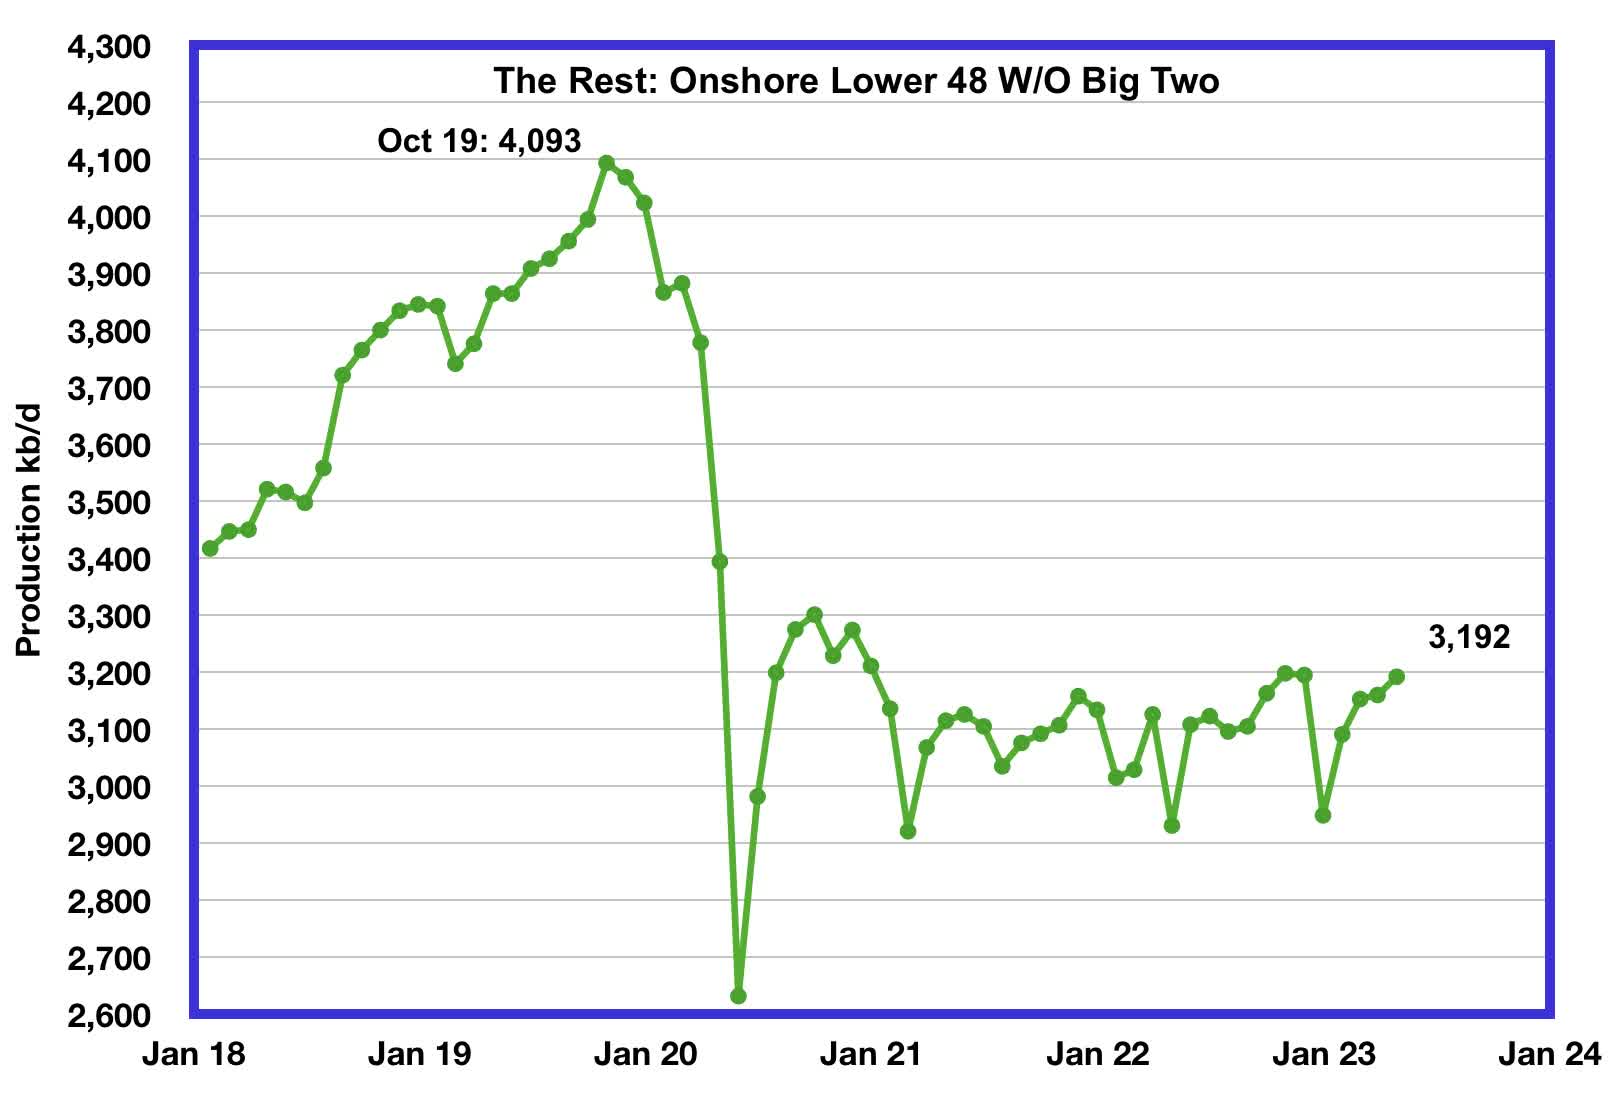
Oil production by The Rest
April production in The Rest rose by 32 kb/d to 3,192 kb/d. From May 2021, oil production in The Rest has been range bound between 3,000 kb/d and 3,200 kb/d and has not given any clear indication of being in decline or rising.
The main takeaway from The Rest chart is that current production is 901 kb/d below the high of October 2019. The question that needs answering is “Is this a permanent loss that will never be recovered? ” All indications continue to be that this is a permanent loss.
Weekly Frac Spread Count
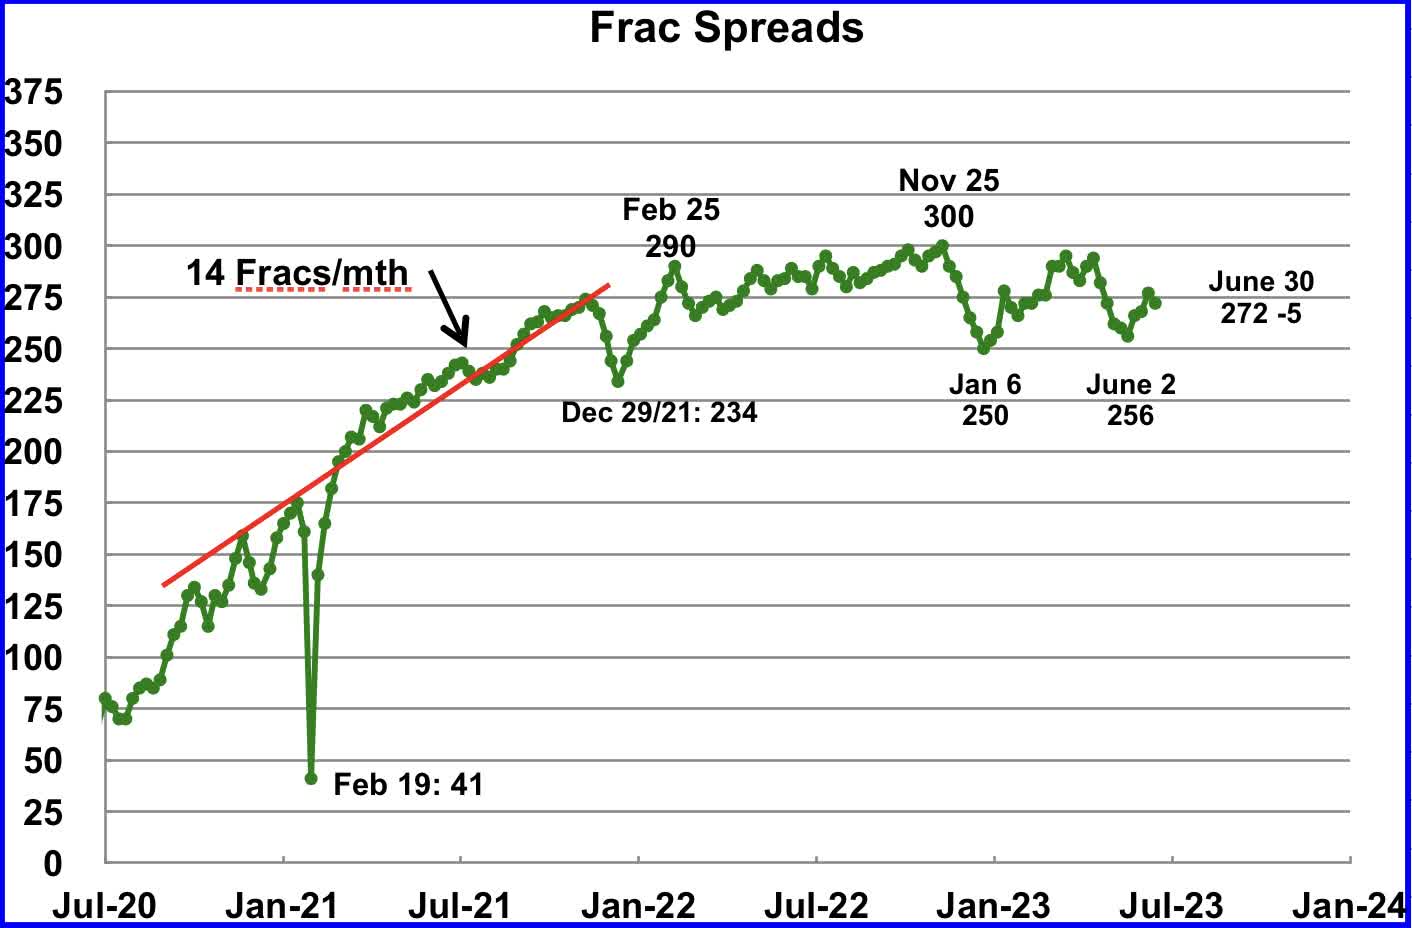
Since January 2022, the frac spread count has wandered between 250 and 300 fracs per week. For all of 2022 the average weekly frac count was 280.
Frac spreads have been rising from the low of 256 in the week ending June 2 and rose to 277 in the week ending June 23. For the week ending June 30, the frac count dropped by 5 to 272 and is down 28 from the high of 300 in November 2022. The current count is slightly lower than the 2022 average of 280 frac spreads per week.
Note that these 272 frac spreads include both gas and oil spreads.
Drilling Productivity Report
The Drilling Productivity Report (DPR) uses recent data on the total number of drilling rigs in operation along with estimates of drilling productivity and estimated changes in production from existing oil wells to provide estimated changes in oil production for the principal tight oil regions. The June DPR report forecasts production to July 2023 and the following charts are updated to July 2023. The DUC charts and Drilled Wells charts are updated to May 2023.
Above is the total oil production projected to July 2023 for the 7 DPR basins that the EIA tracks. Note that DPR production includes both LTO oil and oil from conventional wells.
The June DPR production report increased/revised production over the last few months by roughly 35 kb/d to 45 kb/d over the May report. For instance, June output in the May report, red markers, was revised up by 35 kb/d from 9,332 kb/d to 9,367 kb/d. The DPR is projecting that oil output for July 2023 will increase by 9 kb/d to 9,337 kb/d, a new all time high. However the monthly increase was the smallest since last February when production increased by 13 kb/d and continues the rolling over/plateauing production trend that began six months ago. Also see next chart.
This chart shows the DPR total production increments tracked on a monthly basis. What is notable is the reduced month to month volatility since February 2023. The January 2023 spike is due to the weather related December oil production drop.
The more interesting trend to notice is the declining monthly changes in the production rate. April’s production increase was 62 kb/d while July’s increase dropped by 53 kb/d to 9 kb/d . This short term production rate trend is hinting at an upcoming plateau in Permian production, since it is the dominant producer.
The issue is whether this slowing trend is the result of management’s decision on how to deploy its revenue, investors vs production increase, or is it related to geology, fewer Tier 1 locations along with the Permian gassing out and last but not least the current price of WTI, bouncing around $70/b?
This source suggests that management has decided on how best to deploy its revenue, i.e. less drilling:
“Muted increases in U.S. oil production and cuts by the OPEC+ producing-nations group will limit crude supply in the months ahead, pushing up prices, an executive at U.S. shale producer EOG Resources (EOG) said on Wednesday.
U.S. energy firms have cut domestic oil and gas drilling activity to the lowest level since April 2022 with declines from Texas to Pennsylvania. Analysts expect further cuts this year with oil and gas prices off from last year’s strong levels.”
Permian output continues to rise in July. It is expected to increase by 1 kb/d to 5,763 kb/d. The last six months of production data clearly shows a slowing in monthly production increases, similar to the trend noted above for the total production for the DPR regions.
July’s output is 846 kb/d higher than the pre-pandemic high 4,917 kb/d.
During May, 466 wells were drilled and 495 were completed in the Permian. (Note that May is the latest month for DUC information). The completed wells added 368 kb/d to May’s output for an average of 744 b/d/well. The overall decline was 359 kb/d which resulted in a net increase for Permian output of 9 kb/d. Of the 495 completed wells, 483 were required to offset the decline.
Note: The additional 12 wells over those required to offset decline only added 9 kb/d to overall production in May, less than 1 kb/d per well.
A more detailed review of production in the Permian is included in the Goehring and Rozencwajg section further down.
This chart shows the average first month total production from Permian wells tracked on a monthly basis. The total monthly production from the newest Permian wells in July continues to be at the 370 kb/d level. Production has bounced around 370 kb/d for the last four months. To achieve that production level in July, drillers probably completed a few more wells than were drilled, based on historical drilling and completion data up to May 2023.
The first month DPR production rate of 369 kb/d is very close to that published by Novi Labs in the April 2023 Permian production update. See next chart.
This chart taken from Novi Labs shows that the average first month flow rate of 2023 Permian wells is 388 kb/d, blue graph, which compares well with the DPR July estimate of 369 kb/d shown in the previous chart.
Of greater interest may be the peak production rate for the 2021 wells, 903.2 kb/d, orange marker, compared to the high point of the blue graph. Peak production in the second month for the 2023 wells is 797 kb/d vs 903 kb/d for the 2021 wells, a drop of 106 kb/d.
Output in the Eagle Ford basin has been in a generally flat trend since March 2021, fluctuating over a range of between 1,050 kb/d to 1,150 kb/d. July’s forecast output is little changed and is expected to decrease by 5 kb/d to 1,117 kb/d.
At the beginning of the year 2023, 68 rigs were operating in the Eagle Ford basin. The rig count began to drop in mid March to 60 and dropped further to 58 in Mid June.
The DPR forecasts Bakken output in July will be 1,214 kb/d an increase of 7 kb/d over June.
Output in the Niobrara continues to increase slowly. July’s output increased by 4 kb/d to 655 kb/d.
Production increased due to the addition of rigs into the basin but stabilized at 16 ± 1 rigs in March and April. However in May and June the rig count dropped to 13.
DUCs and Drilled Wells
The number of DUCs available for completion in the Permian and the four major DPR oil basins has fallen every month since July 2020 and continued to decrease in May. May DUCs decreased by 41 to 2,619. The biggest decrease came from the Permian where DUCs decreased by 29 while Bakken DUCs dropped by 10, Eagle Ford by 8 and the Niobrara added 6.
May Permian DUCs decreased by 29 to 880 because 466 wells were drilled and 495 were completed.
In these 4 basins, 750 wells were drilled while 791 were completed for a net decrease of 41 DUCs in May. Both drilled wells and completions are down from higher levels in late 2022.
In the Permian, the monthly completion rate has been showing signs of slowing since the October high of 520 but May showed a large drop. This is consistent with the frac spread chart shown above where there has been slow growth in frac spreads since February 2022 and then a sharp drop starting in April. The number of wells drilled in the Permian is now showing signs of plateauing in the 465 to 470 range.
In May 495 wells were completed, a decrease of 11 since April. During May, 466 new wells were drilled, a decrease of 9. The gap between completed and drilled wells in the Permian has now opened up by 29.
The Permian, as of May, had 880 DUCs remaining and the completion rate was 495 wells/mth. This means that the current cycle time between drilling and completions is 1.77 months or 54 days.
Comment on 2023.Q1 Goehring and Rozencwajg Report
This report starts with the following two paragraphs which is a summary of what the authors believe.
“ Conventional oil production has now unequivocally rolled over. Unconventional production, the only source of growth in global oil supply over the last 12 years, has also significantly slowed. The only growing non-OPEC basin is the Permian in West Texas. Never before has oil supply growth been so geographically concentrated. Six counties in West Texas are now 100% responsible for all global production growth.
Conventional non-OPEC oil production peaked in 2007 at 46.2 mm b/d and now stands at 44.2 mm b/d – 4% below its peak. Including OPEC, conventional global output peaked in 2016 at 84.5 mm b/d and now stands at 81.3 m b/d – 5% below its peak. Even if OPEC has its alleged 4 mm b/d of unused production capacity (something we do not believe), conventional production would barely regain its 2016 peak .”
The authors of the G & R report clearly distinguish between the peaking of “Conventional oil” and the slowing in the growth of “Unconventional oil”, such as LTO and deep offshore, in the above two statements. Below are production charts for six counties that are powering production growth in the Permian and provide some insight on whether they are close to peaking/plateauing.
What is perplexing in the second paragraph is that the authors do not believe that OPEC has 4 Mb/d of unused capacity. They do not state what level of spare capacity OPEC has, 2Mb/d, maybe?
Permian Basin
The authors have a major section regarding the Permian in the report. Charts and data from another source are presented below to show the source and state of Permian production today.
“ Our models tell us the Permian will ultimately recover 34 bn barrels of oil, of which 14 bn or 41% have already been produced. At current production levels, the Permian will have produced half its recoverable reserves sometime in late 2024; at this point, it will most likely stop growing, just like the other two basins.
The authors believe that Hubbert’s theory can be applied to the LTO basins and that once the Permian has produced half of its recoverable resources by late 2024, production will have peaked and begin to roll over.
Below are charts for six Permian counties which have the highest oil production along with strong gas production. Two are in New Mexico and the other four are in Texas .
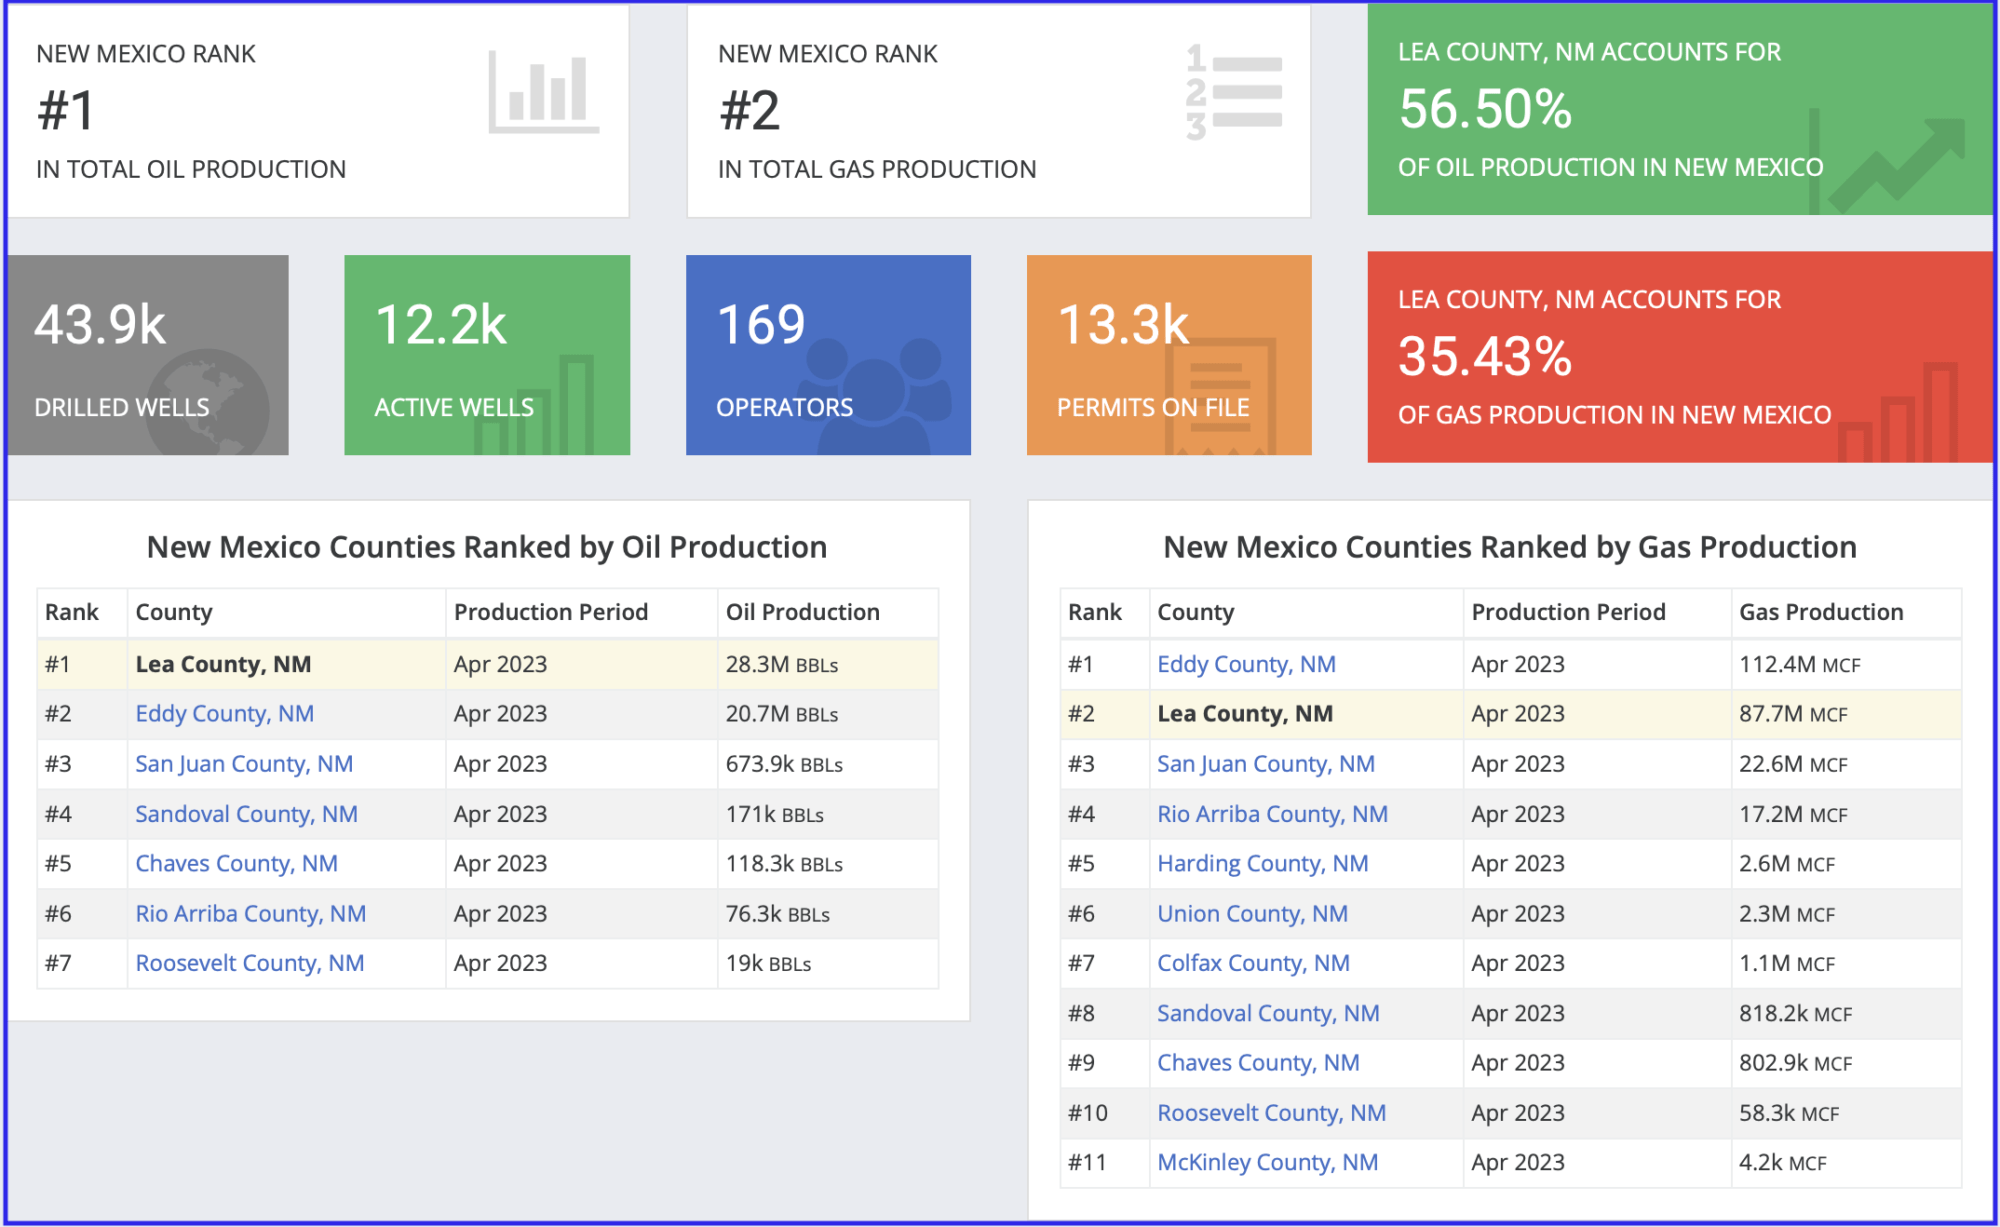
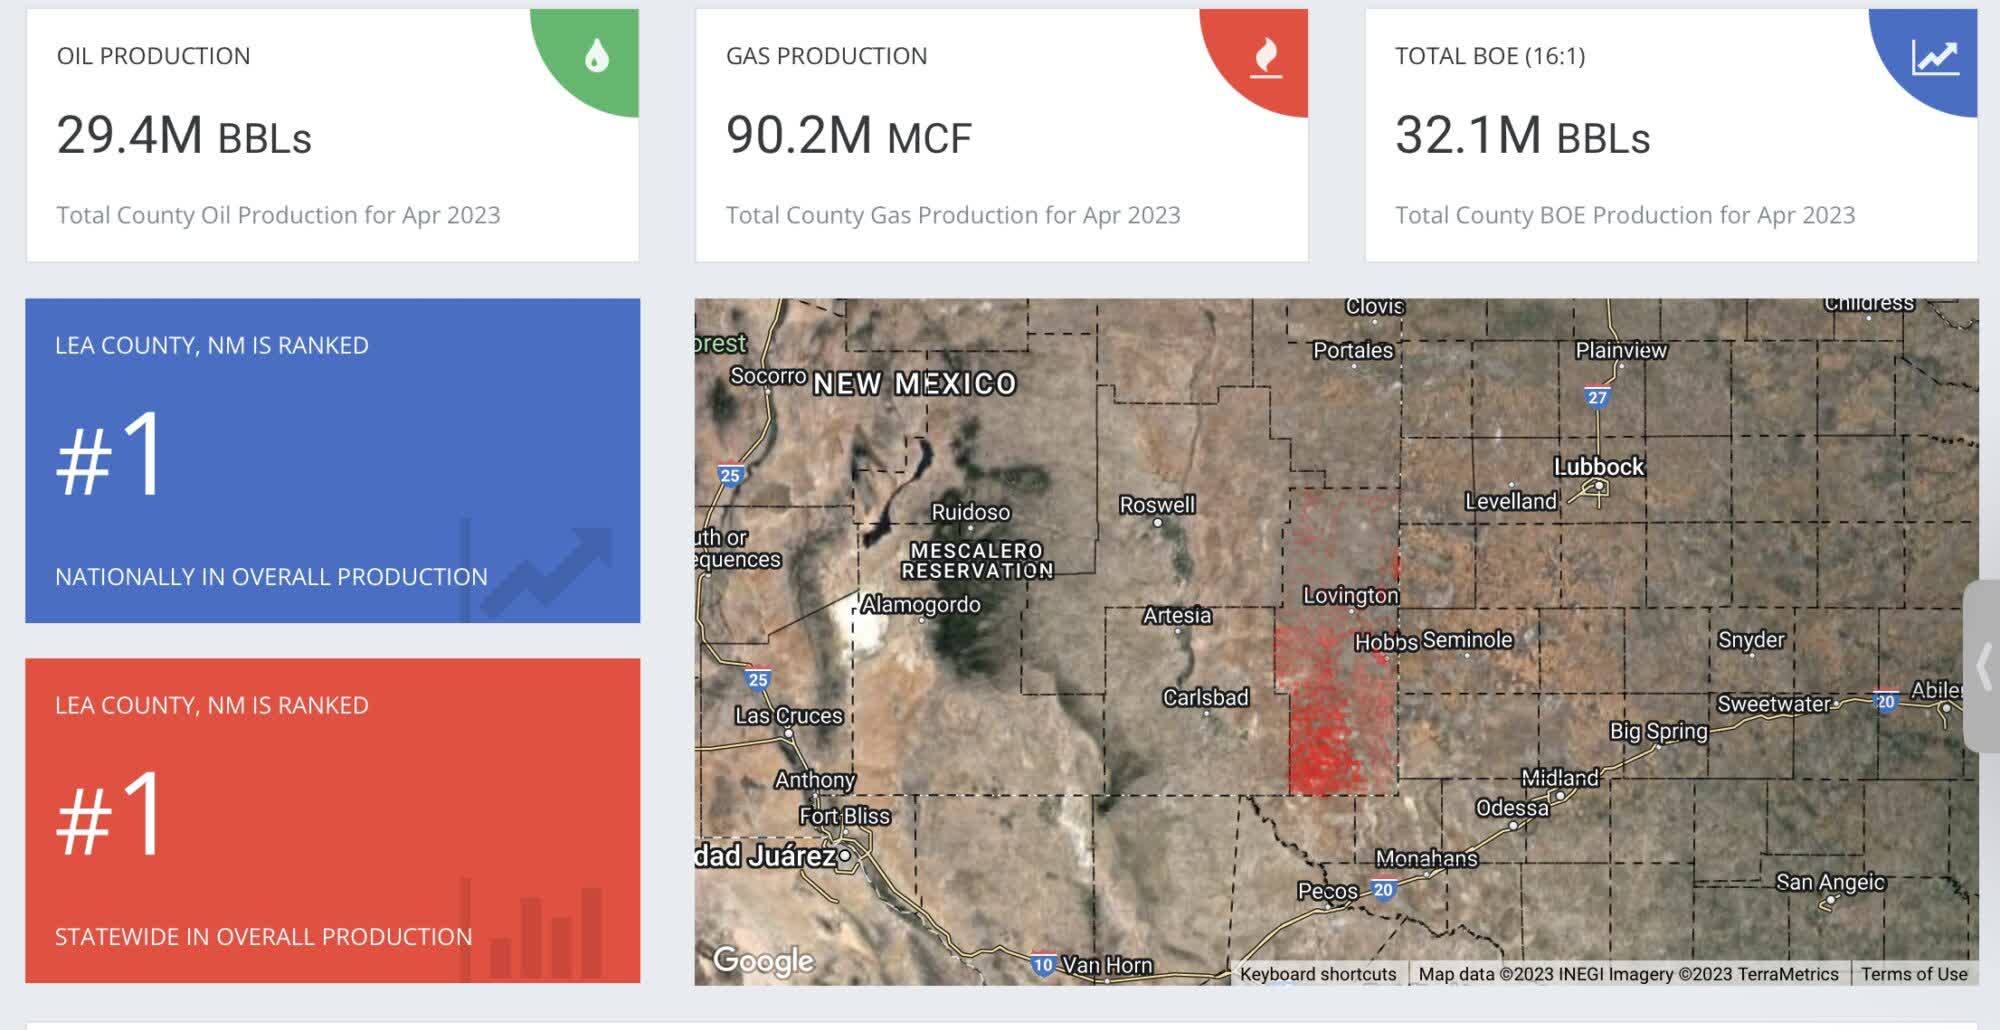
This table was taken from Shalexperts and it lists the top oil producing counties in New Mexico in April 2023. Lea and Eddy are the two largest oil producing counties in the Permian. According to the table, the daily production rate for Lea county in April was 943 kb/d. Novi Labs shows a production rate of 924 kb/d for March.
The combined production rate for the Lea and Eddy counties is 1,633 kb/d. As shown in the New Mexico production chart above, C + C production in April was 1,857 kb/d. It is not clear if the crude production numbers in this table include condensate, which may account for the difference of 224 kb/d between the two estimates. These two counties account for 98% of New Mexico’s oil production. Note the production gap between Eddy county, #2, and San Juan county, #3.
To clarify the condensate question, this picture from the same source above shows an equivalent BOE of 32.1 M barrels. The normal conversion for NG to BOEs is 6000 ft^3 equals 1 BOE. So the 90.2 MCF equals 1,500,000 barrel of oil for a total of 30.9 M barrels, which is 1.3 M barrels lower than shown above. Can someone clarify.
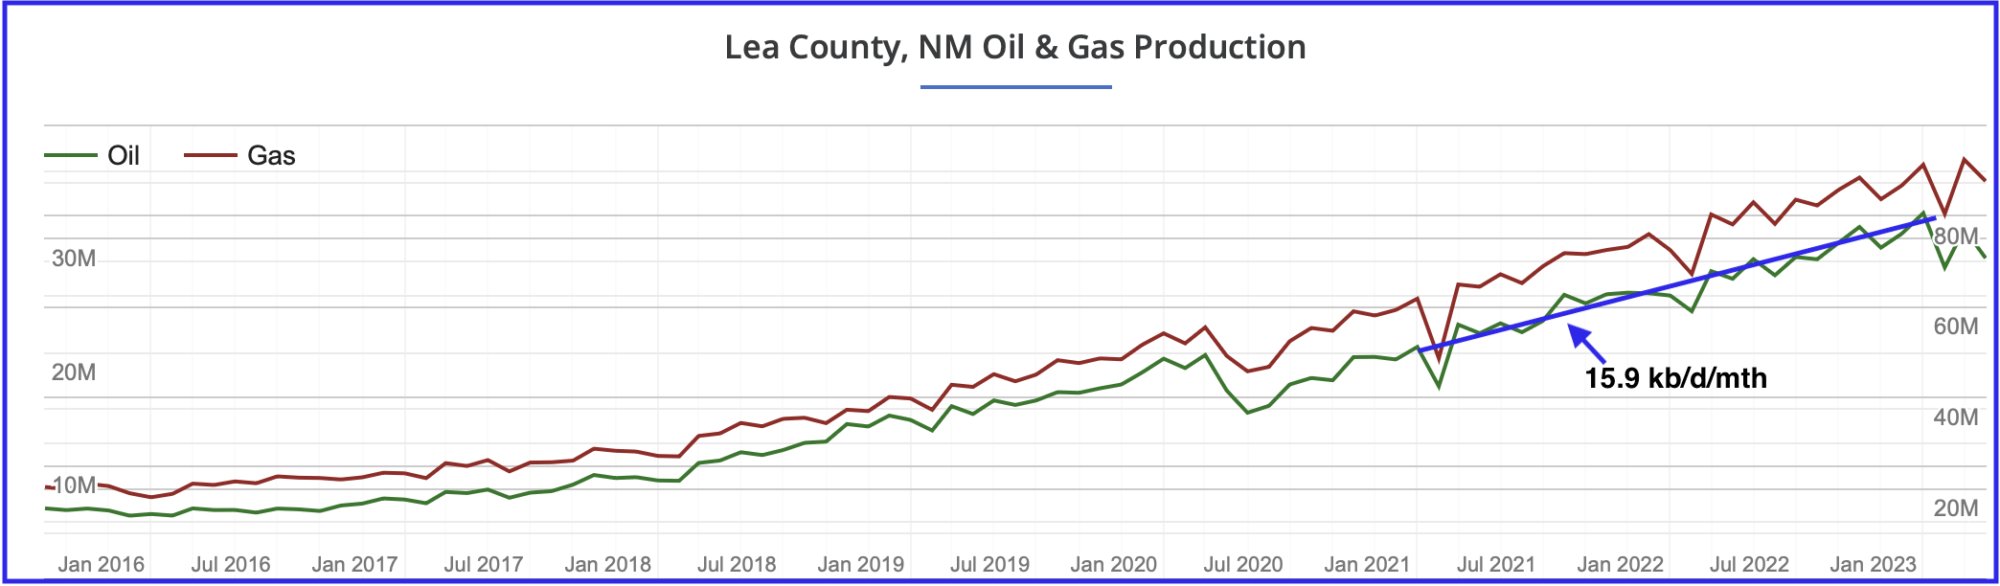
Lea County oil and NG production profile. No sign of peaking up to January 2023 and oil and NG production are rising in parallel. A two point analysis was used to estimate the rate of production increase from January 2021 to January 2023. Over that period production increased at an average rate of 15.9 kb/d/mth.
Comparing the last four oil and gas data points in the chart, January to April, there is a hint that Lea county oil production may have crossed into the bubble point phase because gas output made a new high while oil production dropped. A few more months of data will be required to confirm the production uptrend has stopped and production has entered the bubble point phase.
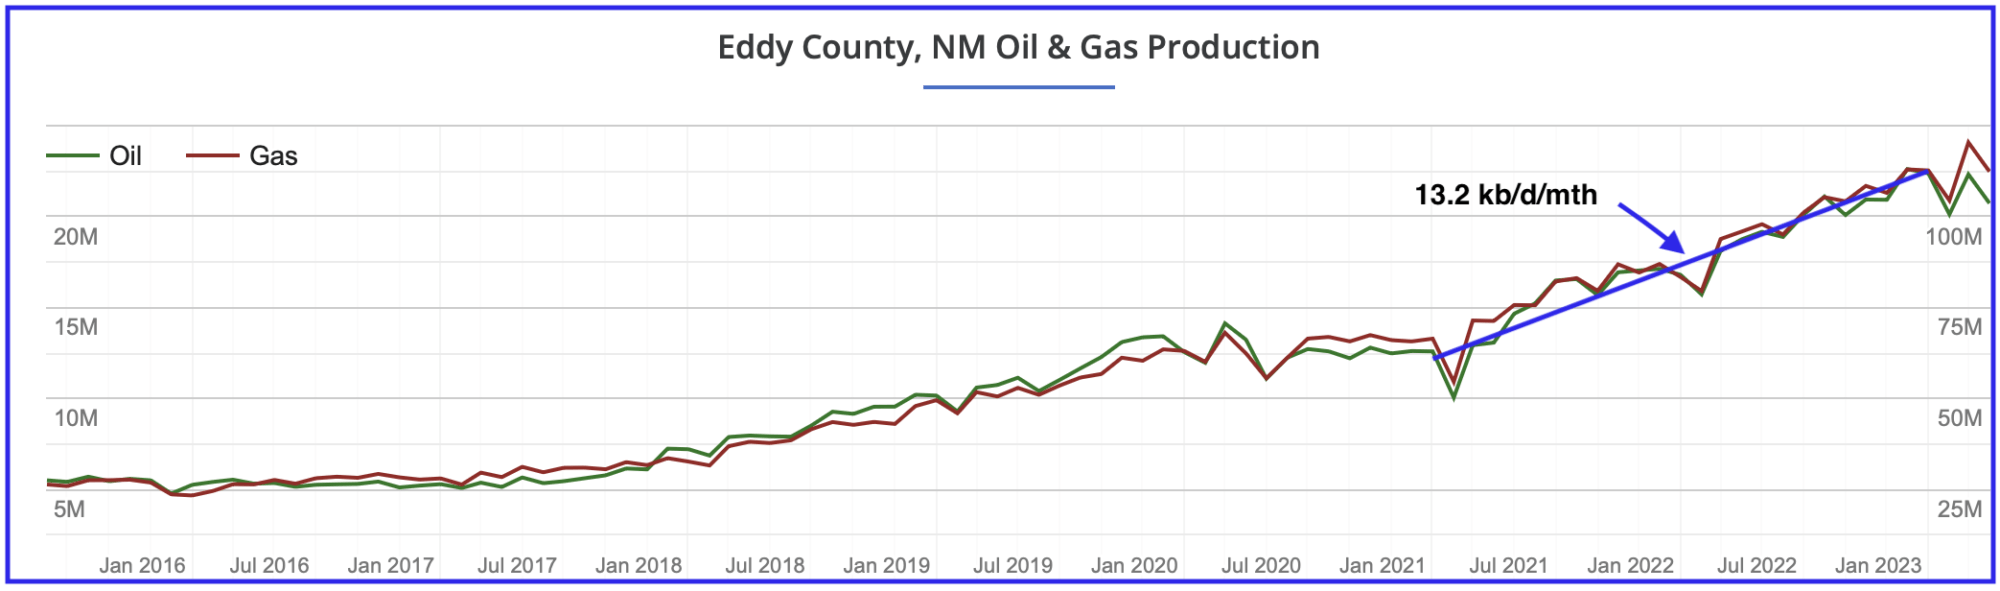
Eddy County oil and NG production profile. No sign of peaking up to January 2023 and oil and NG production are essentially overlapping. A two point analysis was used to estimate the rate of production increase from January 2021 to January 2023. Over that period production increased at an average rate of 13.2kb/d/mth.
As with Lea county, the last four data points in the Eddy chart, January to April, indicate that it may also have crossed into the bubble point phase because gas output made a new high while oil production dropped a bit.
Putting an OLS line through the same period, January 2021 to January 2023, for New Mexico production gives a slope of 29.4 kb/d/mth. Adding the two slopes for Lea county and Eddy county gives a slope 29.1 kb/d/mth. Essentially these two counties account for all of the production growth in New Mexico.
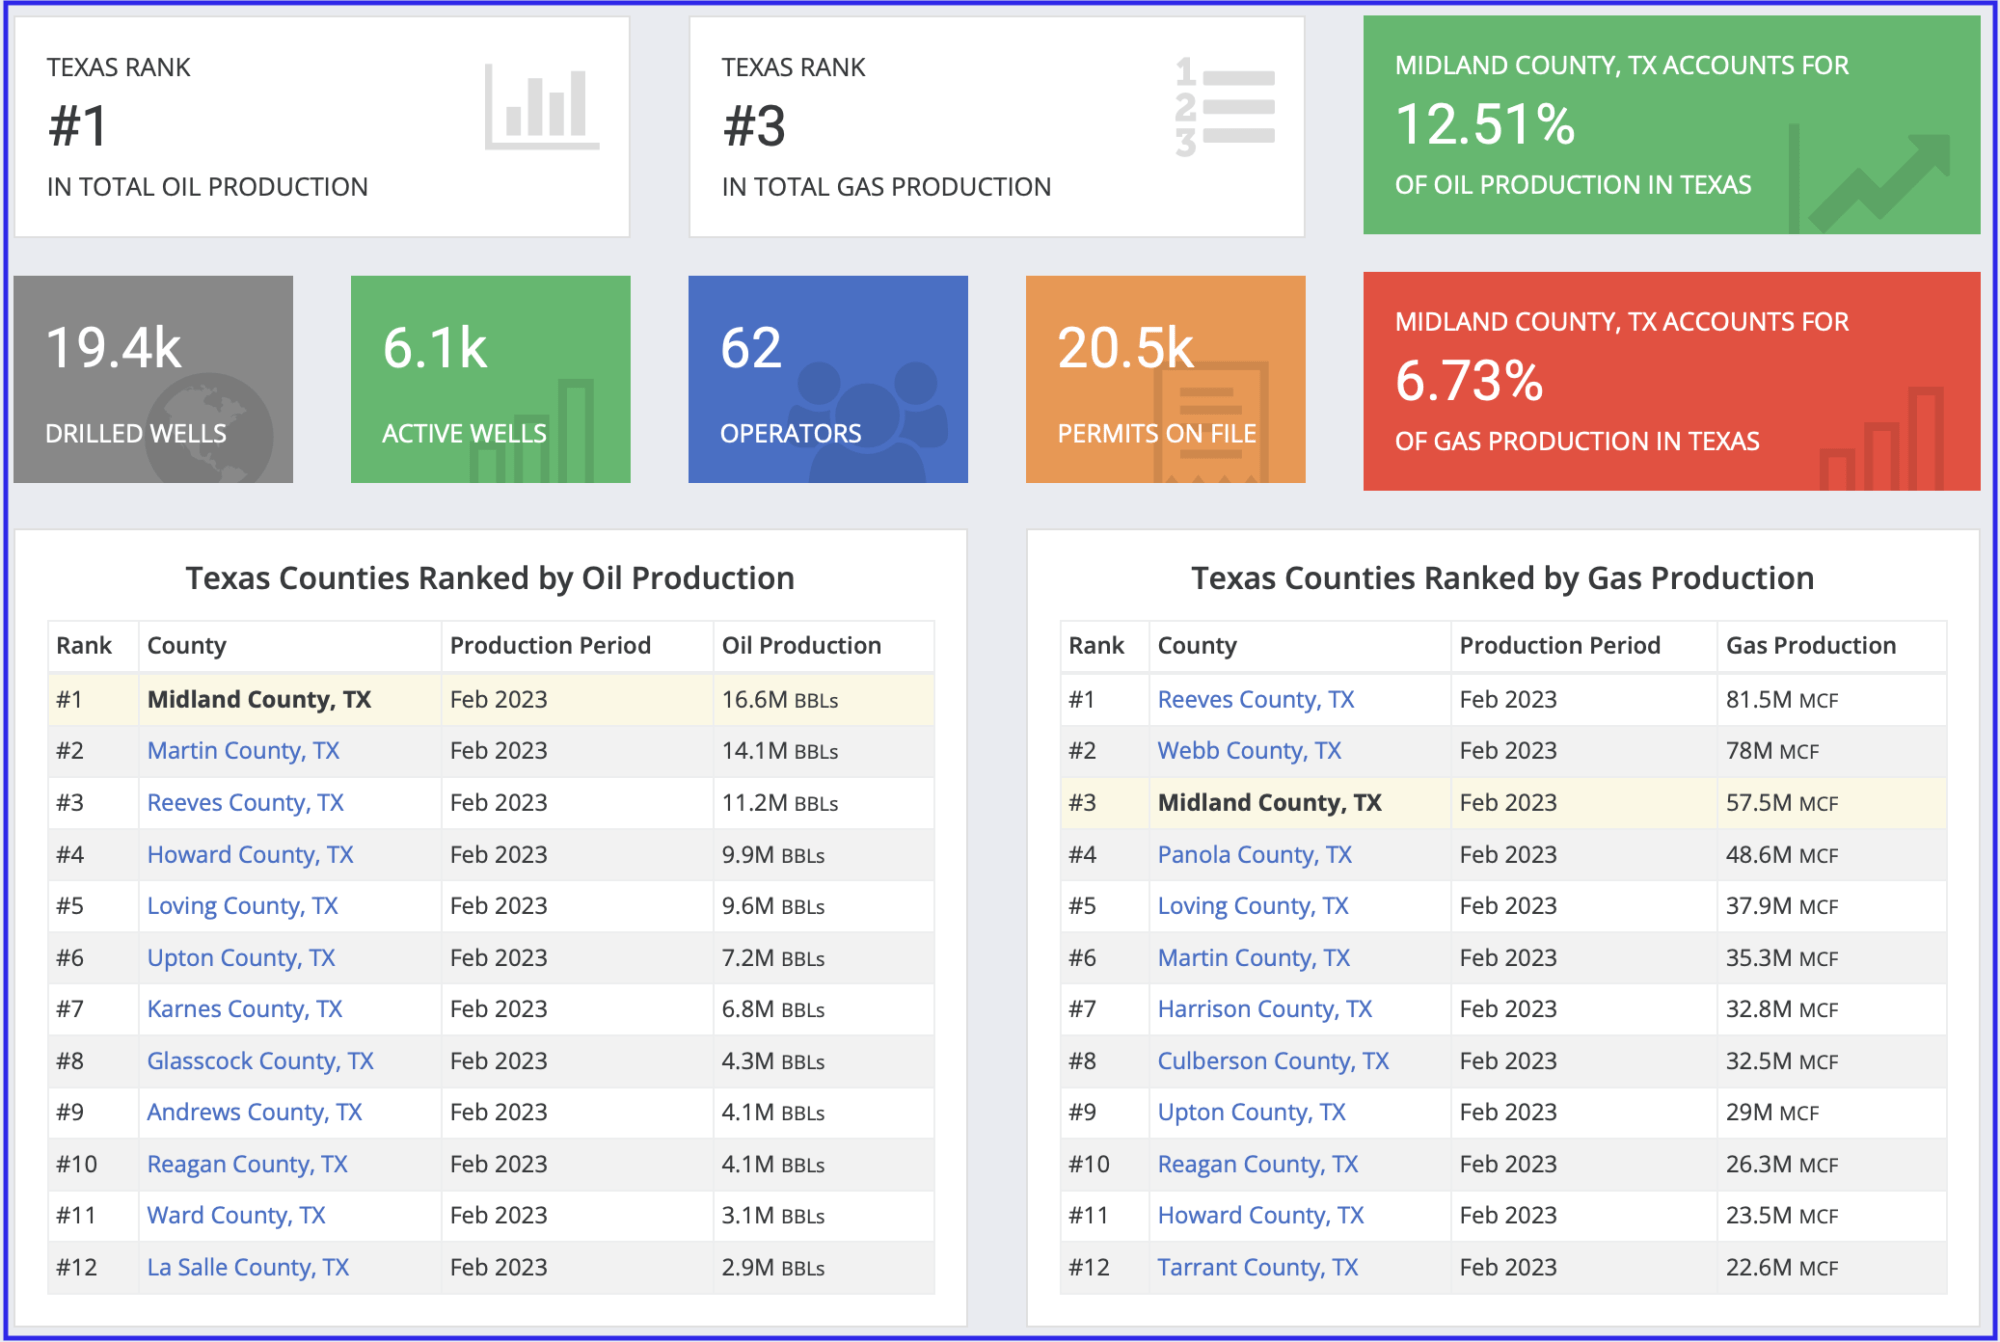
This table was taken from Shalexperts and it lists the top oil producing counties in Texas in February 2023. Midland is the largest producing county in the Texas Permian and is ranked number 3 nationally. According to the table, the daily production rate for Midland county in February was 593 kb/d. Cross checking this February production rate with Novi Labs yields a similar rate of 587 kb/d.
Comparing the production rates in the top two New Mexico counties with those in Texas, it is clear that the Lea and Eddy counties are the Ghawars of the tight oil fields. Essentially that means the first clue for Permian peaking will come from noticing when New Mexico’s oil production starts to slowly roll over.
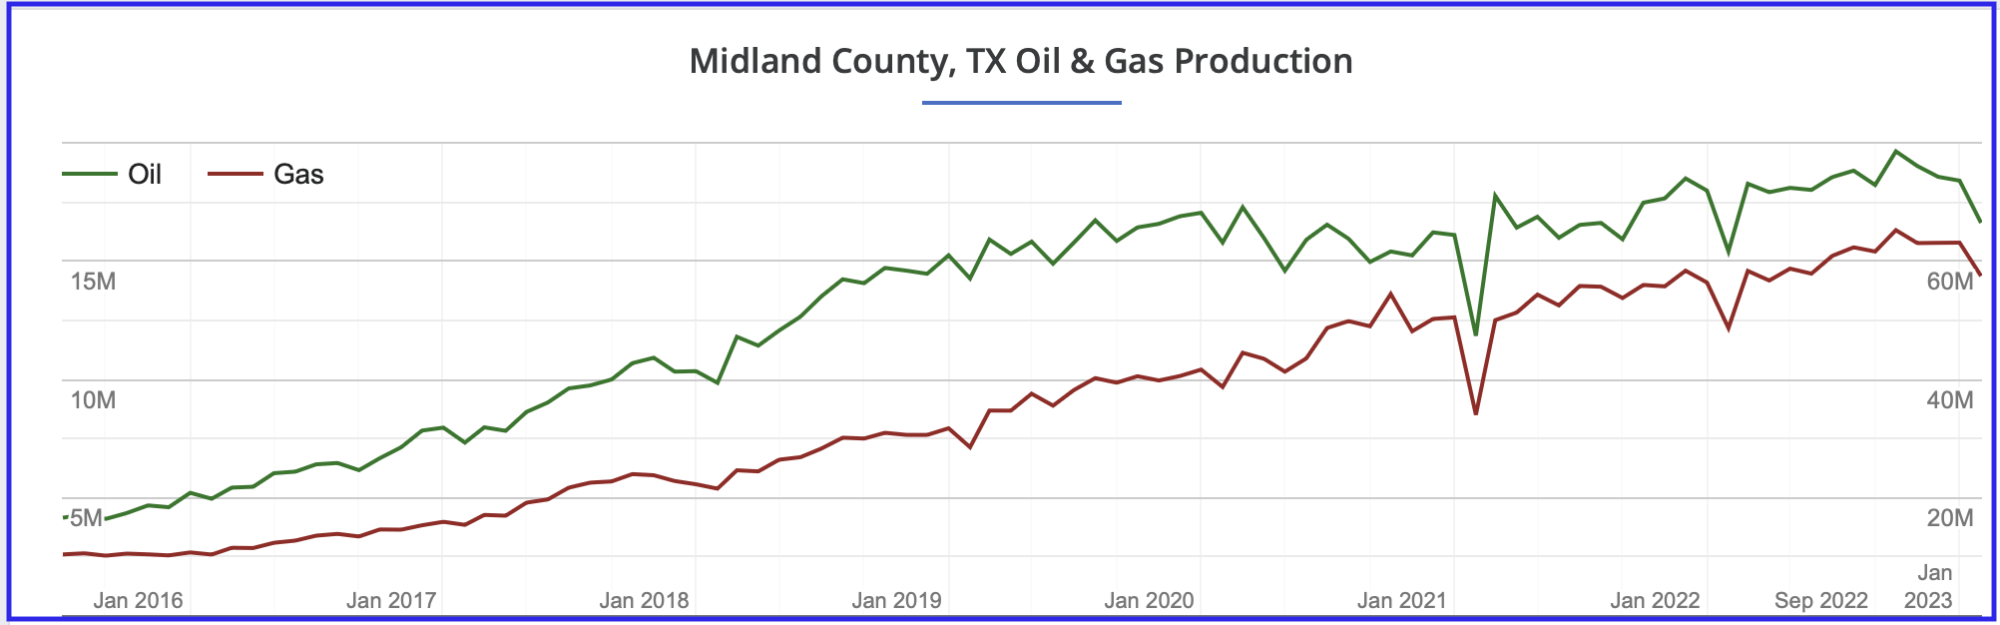
Midland county oil and NG production profile. Comparing the production increase before and after January 2020, it appears that Midland production may be entering a plateau phase starting in 2022. NG’s monthly production appears to increase linearly over the whole period shown.
Note the big drop in oil production over the last four months. This could be mostly due to slow reporting in Texas.
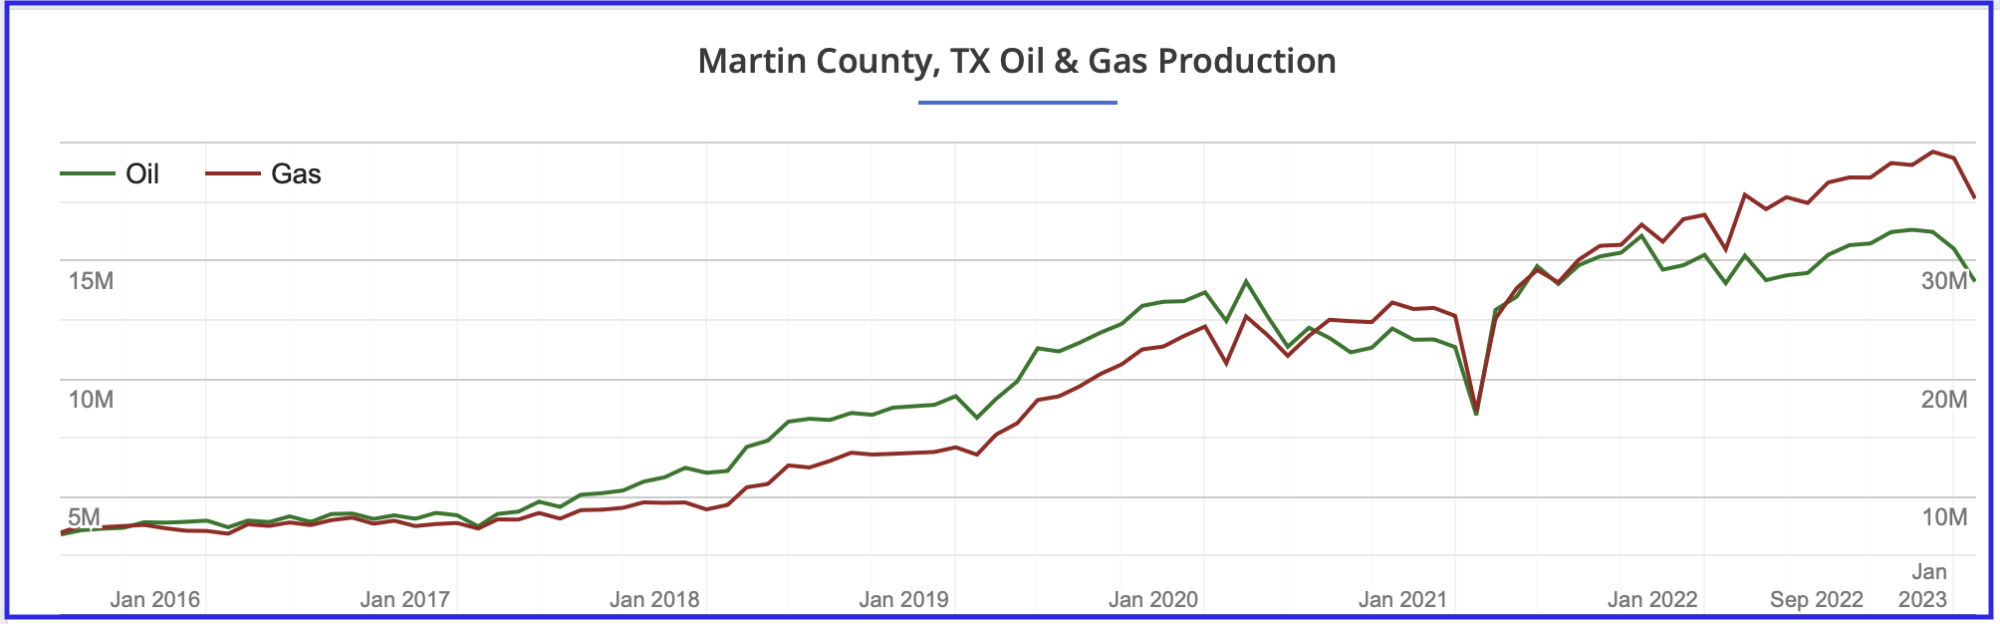
Martin county oil and NG production profile. Since January 2022, oil production has been flat while gas production continues to rise, a clear sign that Martin county is gassing out. Note that the oil graph crossed the NG graph in mid 2020.
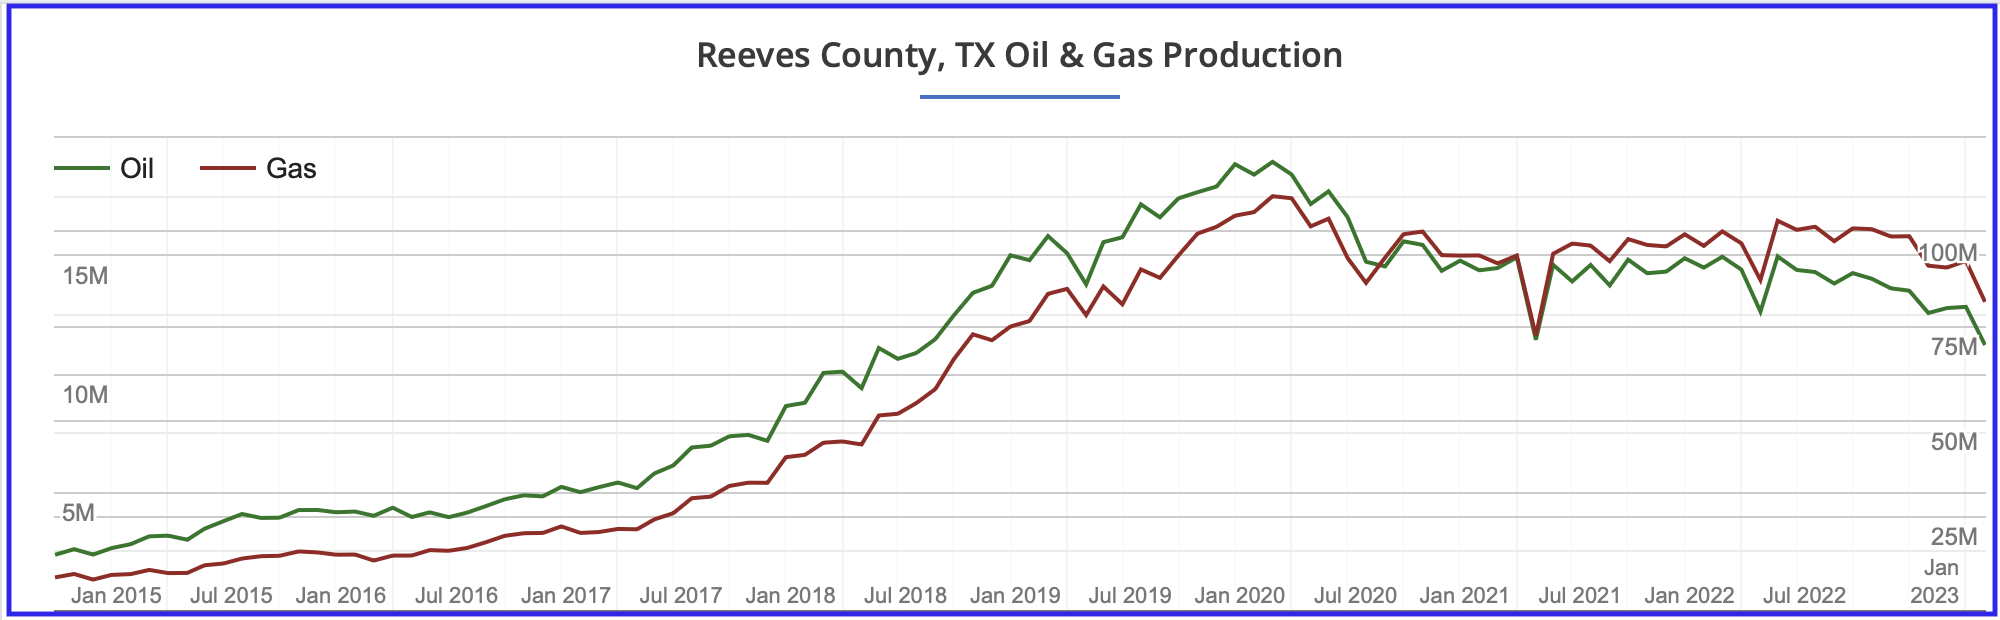
Reeves county oil and NG production profile. Reeves’ county oil production has been in decline since early 2020.
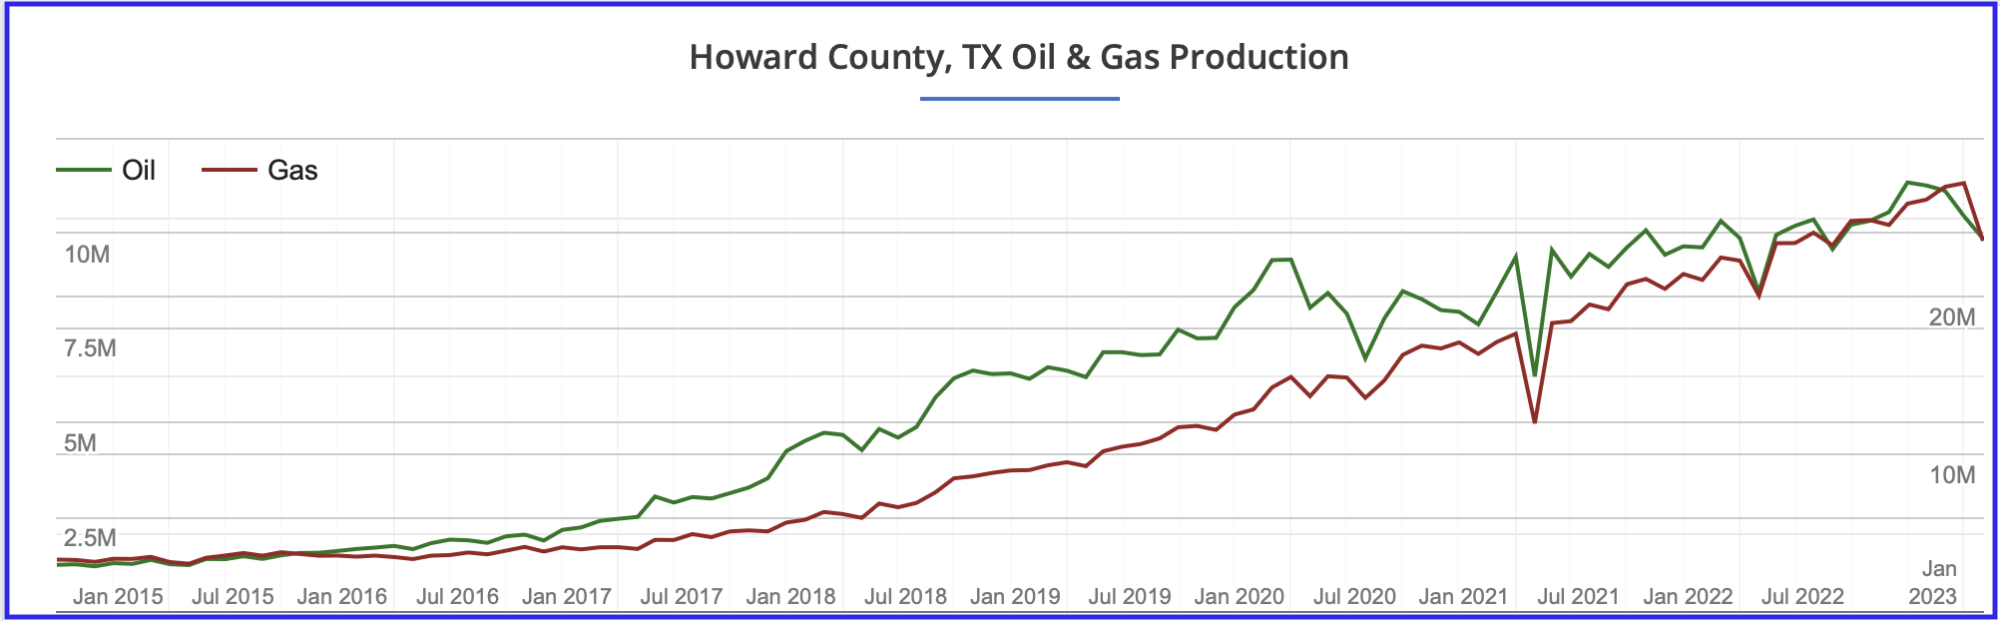
Howard county oil and NG production profile. Howard county’s oil production continues to be on a rising trend.
Permian Summary
The two largest producing counties in the Permian, Lea and Eddy, may be entering a production phase characterized by crossing into the bubble point of an oil field. In Texas, Midland production growth rate is slowing, Martin county is on a plateau, Reeves county is in decline and Howard county’s production continues to rise. Based on the production profile of these six counties, it appears that the Goehring and Rozencwajg report’s forecast that the Permian may peak in the next twelve months has merit.
In addition, it should be noted that in the DPR section above, Permian production growth is slowing and approaching no growth.
Bakken Basin
The G & R report focuses primarily on peaking in the Permian and comments that the Bakken has peaked. For comparison purposes, information similar to that posted above is presented for the Bakken.
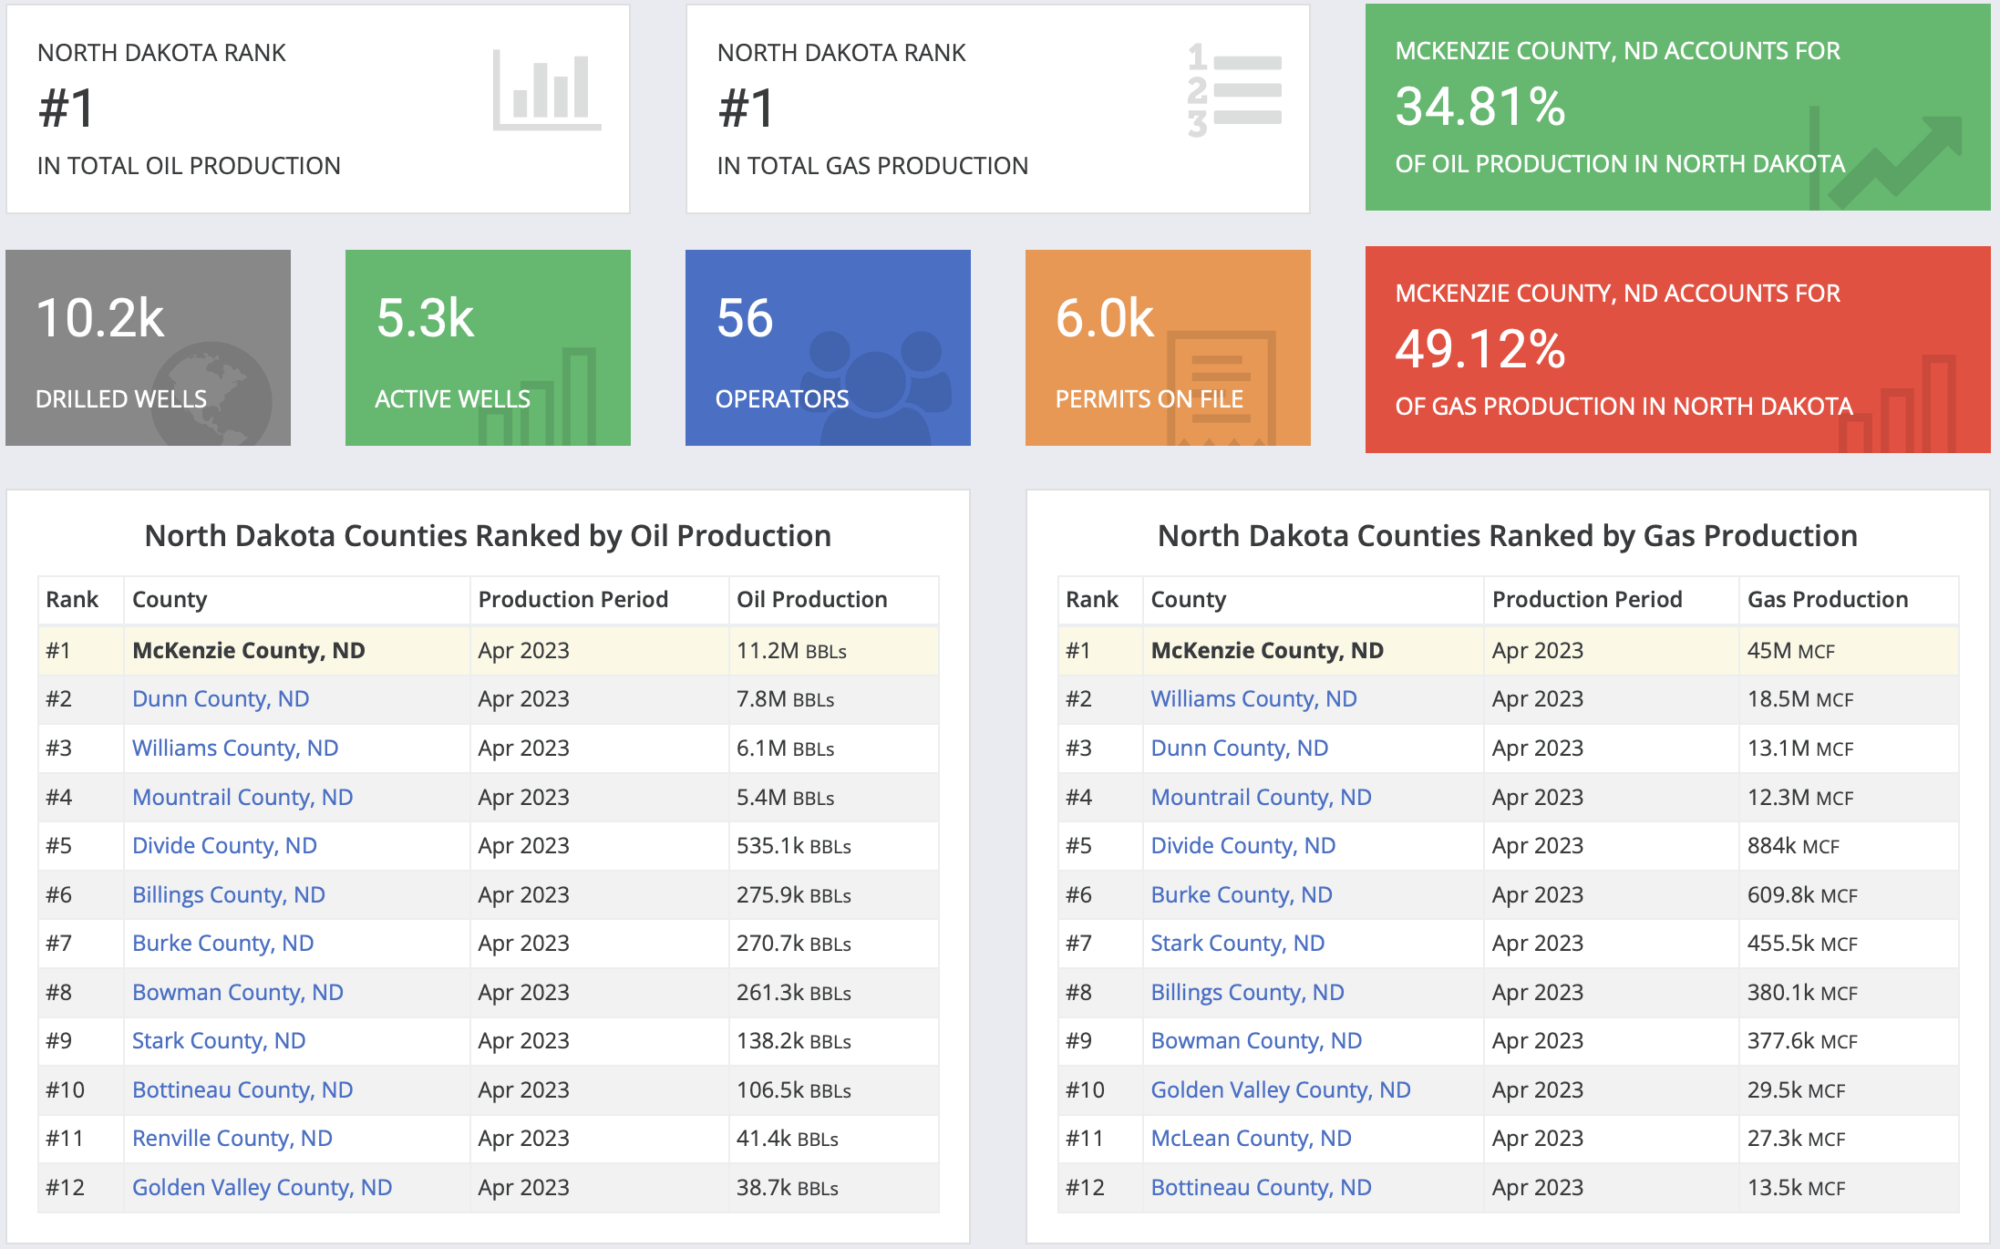
This table was taken from Shalexperts and it lists the top oil producing counties in North Dakota in April 2023. The top four counties account for 1,017 kb/d of North Dakota’s 1,102 kb/d production in April.
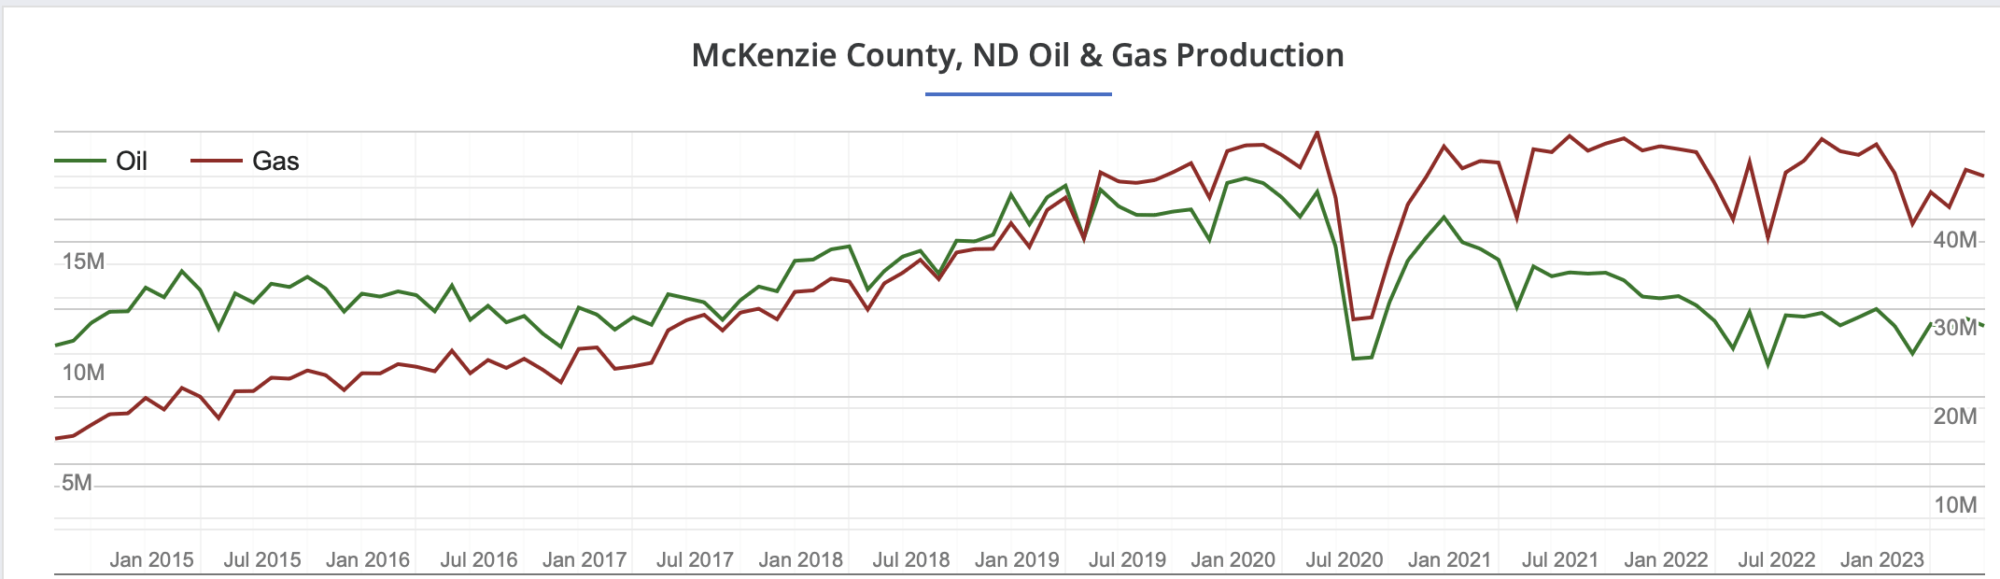
McKenzie county oil and NG production profile. McKenzie county, the number one county in North Dakota, is in decline and appears to be gassing out.
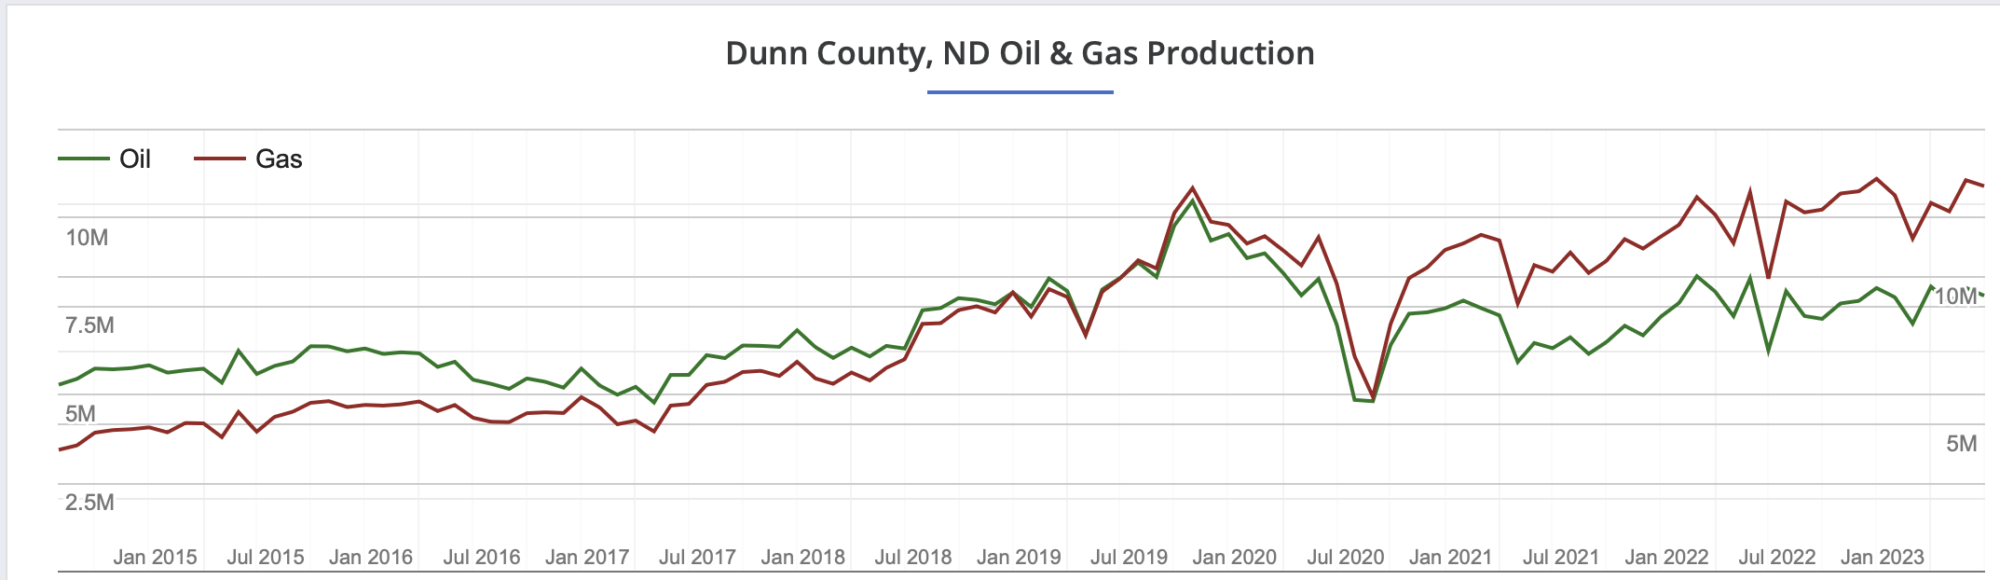
D unn county oil and NG production profile. Dunn county’s oil production is down from its high in August 2019 and now appears to be on lower production plateau.
Frac Spread Count by State and County
Below is a breakdown of the frac spread count for the week May 13 to May 19 taken from this source . That is the most complete data set for that week. While information is provided up to the current week, it is incomplete and is updated in subsequent weeks.
This table shows in which counties the most activity was taking place. The table was cut off at 5 frac spreads. The official frac spread count for the week May 13 to May 19 according to this source was 262, while the above table shows 263.
Four of the five top counties are in the Permian. What is different in this table vs a few months ago is that the Permian frac spread count is less than half of the total . Earlier it was more than half. This is another indicator that the production rate in the Permian may be slowing.
It is not clear if the drop in frac count is due to the $70/b price for WTI or the reduced number of Tier 1 sites or management decision to return more cash to investors.
This table shows the distribution of frac spreads between basins and States. The most completion activity is happening in Texas, New Mexico and North Dakota.
Editor's Note: The summary bullets for this article were chosen by Seeking Alpha editors.
For further details see:
GOM Drop Drops U.S. April Oil Production