MGA - Granite REIT: Rock Solid Performance At A Reasonable Price
2023-12-24 05:56:33 ET
Summary
- Granite Real Estate Investment Trust is a Canadian REIT with a diversified portfolio of industrial assets in Canada, the US, Austria, Germany, and the Netherlands.
- Strong operating performance and thoughtful capital allocation have enabled Granite to preserve and increased unitholder value despite rising rates and supply challenges.
- We believe current prices offer an attractive entry point for a long-term holding.
Summary
Granite Real Estate Investment Trust ( GRT.UN:CA / GrP.UN ) is a Canadian REIT with a portfolio of industrial assets in Canada, the US, Austria, Germany, and the Netherlands. It was spun out of the real estate portfolio of auto parts manufacturer Magna International in 2004.
Since its creation, it has diversified its portfolio away from Magna (n.b., now only ~25% of annualized revenue) and delivered strong operating, financial, and unit price performance. Following a ~10% rally in the past month, it no longer trades for a significant discount to our NAVPU estimate. However, we believe that today's price is still attractive enough for us to justify a small, long-term position, based on its medium-term growth outlook.
History
Granite is a Canadian-based REIT engaged primarily in acquiring, developing, and managing industrial, warehouse, and logistics properties in North America and Europe. It was established as MI Developments Inc. ("MID") in 2004, a spin-off from Magna International, a global automotive supplier.
In 2011, MID was rebranded as Granite Real Estate Investment Trust. This change marked a strategic shift from primarily being Magna International's landlord to diversifying its property portfolio and tenant base.
Post-rebranding, Granite REIT began to aggressively expand and diversify its property portfolio. This included acquiring and developing various industrial, logistics, and warehouse properties across North America and Europe. Over the years, Granite REIT has focused on enhancing its property portfolio through selective acquisitions, development projects, and improvements to existing properties. It has consistently sought to balance growth with financial stability. Its expansion has led to a significant global presence, particularly in the United States, Canada, and Europe, with diverse tenants across various industries.
Portfolio Snapshot
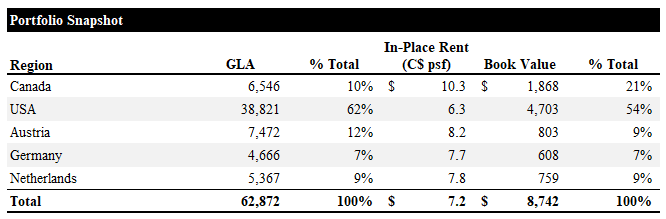
Granite owns 137 income-producing industrial properties with ~63k sqft of GLA and 6 development properties/land parcels. The portfolio is primarily located in the US and Canada (n.b., ~72% of GLA and ~75% of IFRS fair value). The majority of its properties are leased to tenants for distribution/e-commerce activities.
Since Q4 '21, Granite has added 18 income-producing properties, growing GLA by ~14%. Some of this growth in the income-producing portfolio is attributable to the completion of development projects (n.b., properties under development have decreased from 9 in Q4 '21 to 3 in Q3 ''23). Its portfolio of land held for development has remained relatively constant, with 3-4 parcels.
Since it was spun out of Magna, Granite has greatly diversified its tenant base, with Magna now accounting for only ~25% / ~19% of annualized revenue / GLA (n.b., down from ~29% / ~22% in Q4 '21).
Top Tenant Summary (Empyrean; Granite)
Its top 10 tenants account for ~46% of annualized revenue and ~36% of GLA. They have a WALT of ~8.1 years and an average credit rating of A (n.b., excluding NR tenants).
Top Tenant: Magna International
Magna International ( MGA ) has a credit rating of A3 with a stable outlook from Moody's, A(low) rating with a stable outlook from DBRS, and A rating with a stable outlook from S&P. Magna is a global vehicle engineering and contract manufacturer. Its products include body, chassis, exteriors, seating, powertrain, active driver assistance, electronics, mechatronics, mirrors, lighting and roof systems. Magna is the tenant at 27 of Granite's properties, accounting for ~25% of annualized revenue and ~19% of GLA.
On February 1, Magna's leases at Granite's properties in Graz, Austria (n.b., ~5MM sqft) were extended for ten years to January '34. In February '24, the rent for the Graz facilities for the initial five years of the extension will escalate at the rate of CPI for the 60 months preceding that date to a maximum of 10%.
Granite acts as an arm's length landlord with Magna. Its properties are generally leased to operating subsidiaries and are not guaranteed by the parent company; however, Magna International Inc. is the tenant under some leases. The lease arrangements with Magna are structured with standard terms, but Magna is given an ROFR on the sale of the properties.
Recent Performance
Earnings and Cash Flow Evolution
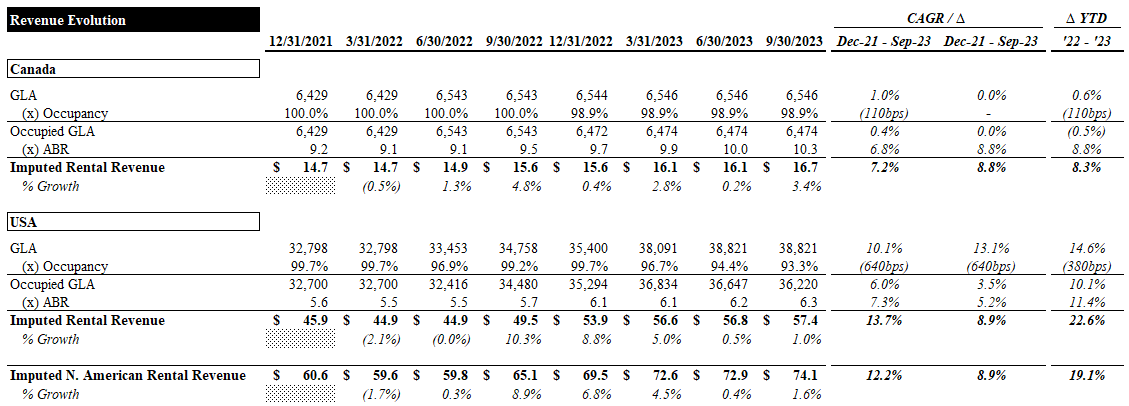
In this section, we unpack the drivers of Granite's earnings and cash flow evolution from year-end '21 to Q3 '23. In the table below, we imputed run-rate rental revenue for its portfolio by country based on GLA, in-place rent (n.b., in CAD), and occupancy.
Starting with the North American portfolio, Canadian quarterly run-rate revenue has grown at a ~7% CAGR over this period (n.b., ~8% YoY growth in the first 3 quarters of '23). GLA grew ~2%, occupancy decreased ~100bps, and rents grew at a ~7% CAGR.
US quarterly run-rate revenue grew at a ~14% CAGR. The strong revenue growth was primarily driven by a ~18% increase in GLA and ~7% rent CAGR, offset by a ~600bps decrease in occupancy.
Overall, North American run-rate revenue has grown at a ~12% CAGR, driven by strong rent growth and the expansion of the portfolio.
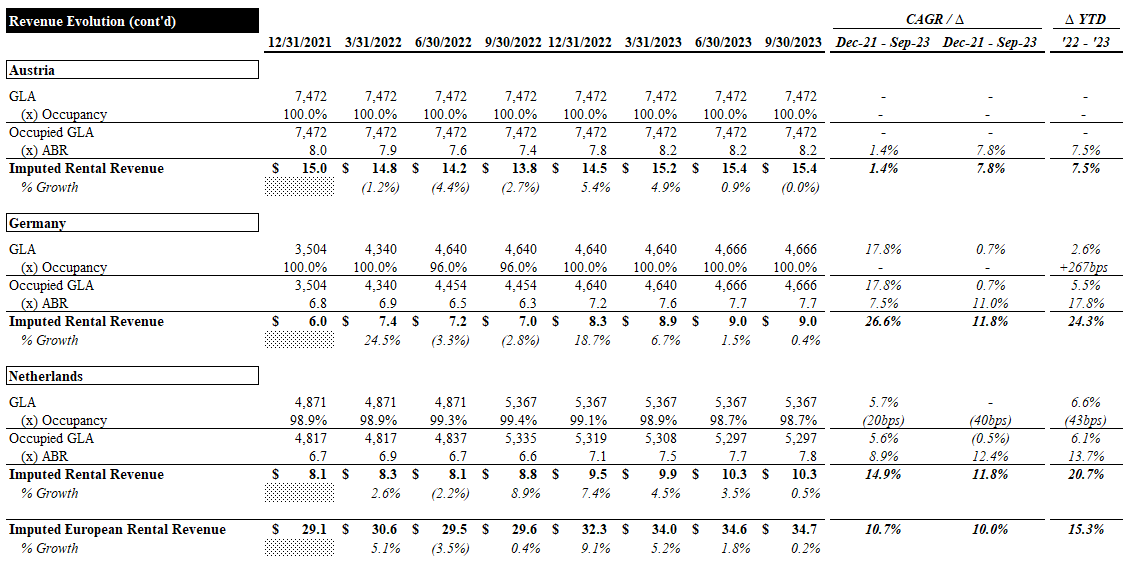
Next, we consider the European portfolio. Granite's footprint in Austria has remained stable, with no change in GLA and full occupancy. Rent growth has lagged the portfolio but has grown ~8% YoY in CAD terms.
German GLA grew by ~33% and has largely remained fully occupied. Rent growth in CAD terms has been exceptionally strong, with a ~7% CAGR and ~18% YoY growth. Run-rate revenue grew at a ~27% CAGR (n.b., ~24% YoY).
Dutch GLA grew by ~10% with a modest decline in occupancy. In CAD terms, rent grew at an impressive ~9% CAGR (n.b., ~14% YoY). This drove a run-rate revenue CAGR of ~15%.
The European portfolio's run-rate revenue grew at a ~11% CAGR (n.b., ~15% YoY).
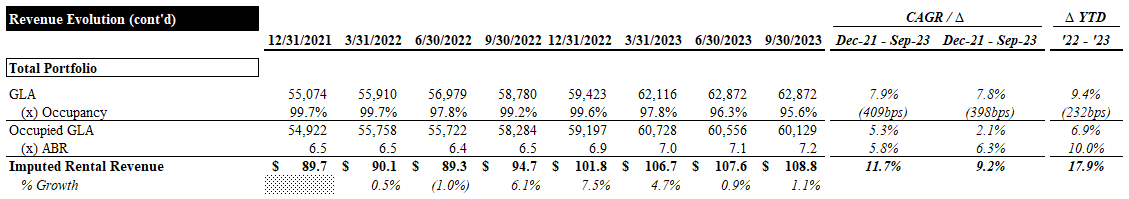
Run-rate revenue for the entire portfolio has grown at a ~12% CAGR (n.b., ~18% YoY). Portfolio expansion and rent growth have been the primary drivers of this growth, outweighing the decline in occupancy.
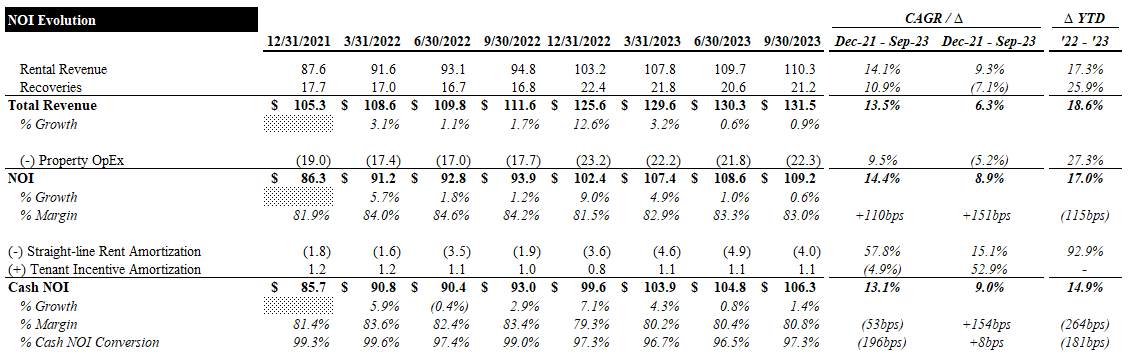
Next, we consider Granite's NOI evolution. Reported rental revenue has grown at a ~14% CAGR (n.b., ~17% YoY), ~200bps faster than our imputed run-rate revenue. Total revenue has grown at a ~14% CAGR (n.b., ~19% YoY), though property opex grew ~27% YoY. This led to a ~120bps dilution of the NOI margin. Cash NOI, which excludes straight-line rent and TI amortization, grew ~15% YoY as margins were diluted by ~260bps. Cash NOI conversion (n.b., the ratio of cash NOI to plain NOI) declined ~180bps YoY, as SLR amortization jumped ~93%.
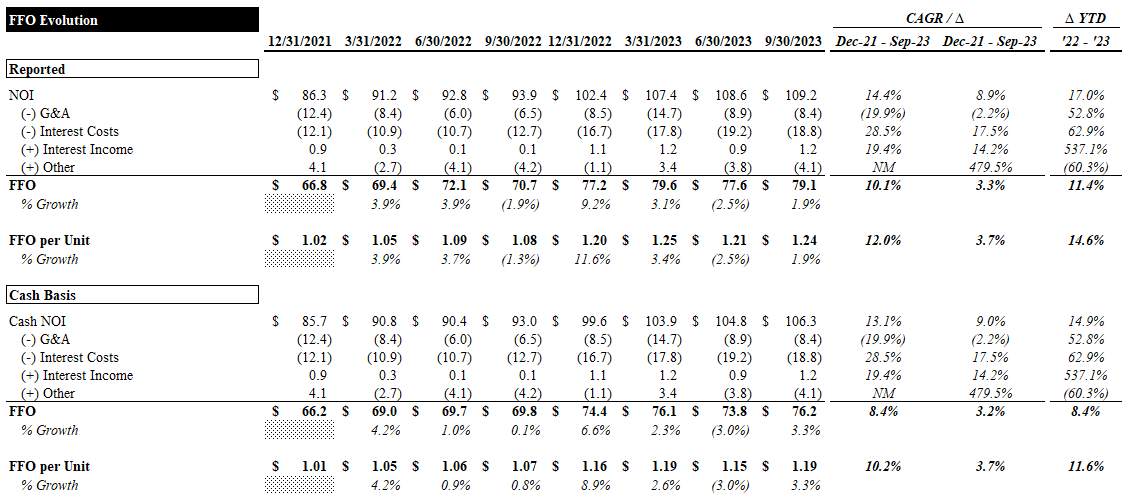
Next, we turn to FFO and AFFO as our preferred cash flow metrics. Below, we present the bridge from NOI to FFO and "cash FFO" (n.b., cash FFO incorporates the same adjustments required to move from NOI to cash NOI).
FFO has grown at a ~10% CAGR (n.b., ~11% YoY) and ~12% (n.b., ~15% YoY) per unit. FFO per unit growth was accelerated by a ~3% reduction in the unit count due to net repurchases under the NCIB in Q3 and Q4 '22 and Q1 '23. Cash FFO has grown at a ~8% CAGR (n.b., ~8% YoY) and ~10% (n.b., ~12% YoY) per unit.
FFO growth has lagged NOI growth, as G&A and interest costs have ballooned ~53% and ~63% YoY, respectively.
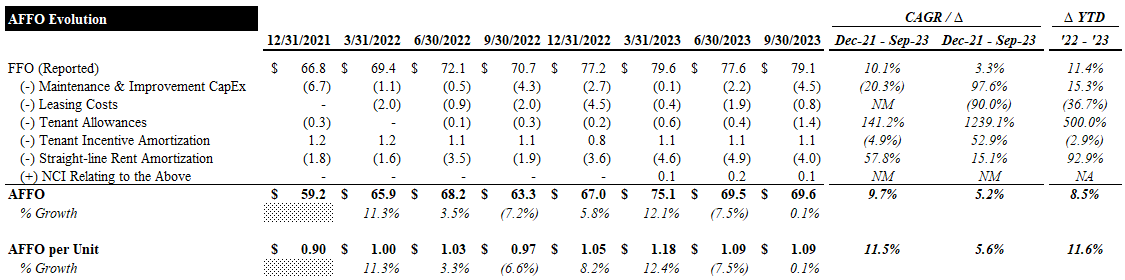
Reported AFFO already includes adjustments for SLR and TI amortization, so there is no need to make further adjustments as we did for cash FFO. AFFO has grown at a ~10% CAGR (n.b., ~9% YoY) and ~12% (n.b., ~12% YoY) per unit.
The strong performance of Granite's assets, coupled with its relatively low leverage and unit repurchases, have driven impressive growth in FFO and AFFO per unit, which has enabled 2 distribution increases in the last 2 years (n.b., ~6% CAGR).
NAV Evolution
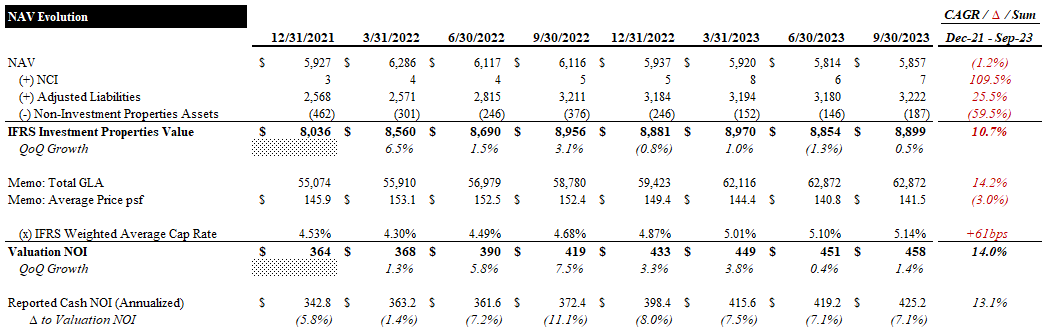
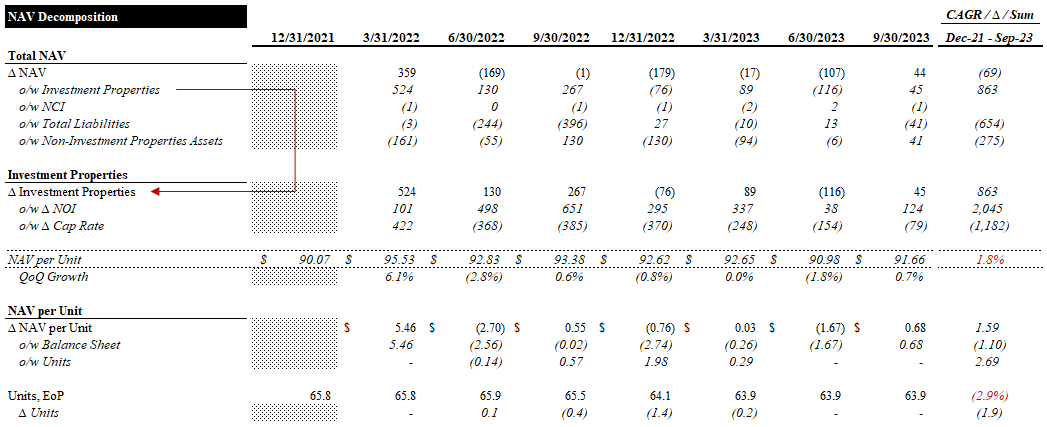
In this section, we unpack the drivers of Granite's NAV evolution from year-end '21 to Q3 '23. As shown in the table below, Granite's NAV has declined ~1% over this period as a ~26% increase in adjusted liabilities outpaced a ~11% growth in the value of investment properties. The change in the value of investment properties is entirely attributable to the expansion of the portfolio, as the average price psf declined ~3%. The declining price psf was driven by a ~60bps expansion in average cap rates and partially offset by a ~14% CAGR on its implied valuation NOI.
A ~3% reduction in Granite's unit count made up for the small decline in NAV and drove a ~2% increase in NAVPU. The Netherlands and US portfolios saw the most marked cap rate expansion (n.b., ~115bps and ~86bps, respectively). The rest of the portfolio saw ~5-22bps of cap rate expansion over this period.
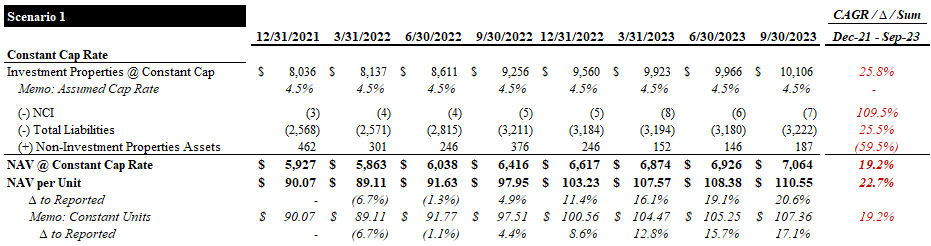
Next, we present three scenarios exploring the theoretical NAV evolution holding certain variables constant. First, we look at the average cap rate. As seen below, holding the portfolio cap rate constant would have resulted in a total NAV and NAVPU growth of ~19% and ~23%, respectively. This would have resulted in a NAVPU ~21% higher than reported (n.b., ~17% holding the unit count constant).
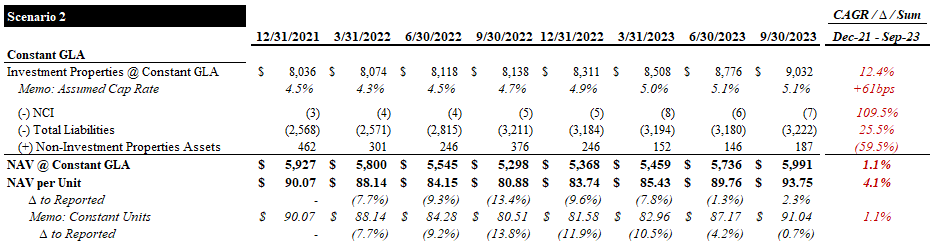
Next, we consider the scenario holding GLA constant. This case estimates the NAV evolution had Granite's GLA remained constant. We constructed this case starting with Q4 '21 NOI and growing it at the estimated quarterly same-property NOI growth rate. This would have resulted in a total NAV and NAVPU growth of ~1% and ~4%, respectively. This would have resulted in a NAVPU ~2% higher than reported (n.b., ~1% holding the unit count constant).
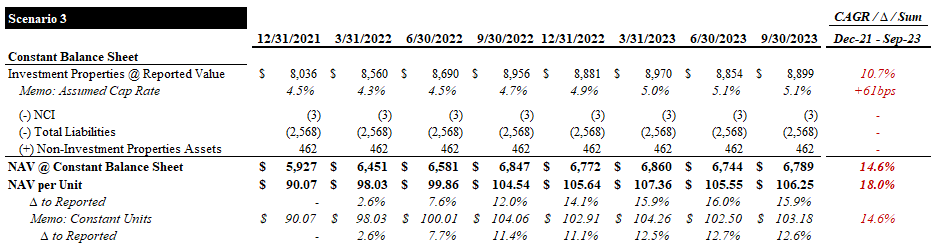
Next, we look at the other balance sheet items. Holding the balance sheet adjustments constant would have resulted in a total NAV and NAVPU growth of ~15% and ~18%, respectively. This would have resulted in a NAVPU ~16% higher than reported (n.b., ~13% holding the unit count constant).
Leverage
As mentioned earlier, Granite's relatively low leverage has mitigated the FFO/AFFO impact of rising rates over the past 2 years. Net Debt / EBITDA is currently ~8x, and its Net Leverage Ratio (n.b., net debt/investment properties) is ~33%. This NLR is slightly higher than Granite has maintained historically but is expected to be the new normal going forward until asset values recover:
debt to asset value has creeped up. And I think in that 30% to 32% range is probably normal going forward. ( Granite Q3 '23 Earnings Call )
Debt Summary (Empyrean; Granite)
While its WACD is currently a low ~2.3%, this will certainly increase in the near term. The 2023 debentures were refinanced in October at ~6.1% (n.b., ~4.9% after cross-currency interest rate swap), ~300bps higher than the in-place WACD. Thankfully, with its next maturity in December '24, Granite will likely benefit from anticipated rate cuts.
Valuation
Granite trades for 15.1x and 17.2x LQA FFO and AFFO, respectively (n.b., 15.3x and 17.0x LTM, respectively). Midpoint FFO and AFFO guidance for FY23 imply ~12% and ~9% YoY growth (n.b., 15.1x and 17.0x, respectively). Following the recent ~3% distribution increase to $3.30 per unit per year, it yields ~4.4%. Based on our NAV estimate, the market is pricing it at a ~1% discount and a ~5.6% implied cap rate.
Valuation Summary (Empyrean; Granite)
Our central NAV estimate is based on market cap rates, with the upside case reflecting the reported IFRS cap rates. Using market cap rates implies a NAVPU ~14% lower than reported, indicating that Granite is fairly valued. We expect declining benchmark rates and bond yields to eventually flow through to cap rates and justify the IFRS cap rates. With inflation and central bank policy beginning to inflect and industrial fundamentals expected to hold up in the near term, we see today's prices as a chance to acquire a well-managed, growth-oriented REIT with long-term tailwinds at a reasonable price.
Target Prices (Empyrean)
The table below presents our cap rate assumptions for each of Granite's geographies. Our sources for Canada can be viewed here and here for the US . Our assumptions for the European portfolio are based on a ~50bps premium to the IFRS cap rates (n.b., average premium to management's cap rates for Canada and the US).
Cap Rate Assumptions (Various)
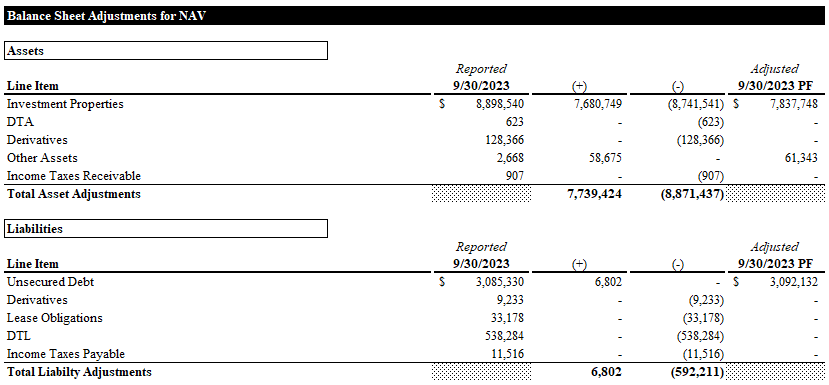
The major balance sheet adjustments for the NAV are shown in the table below.
It is also worth noting that there are precedents justifying a premium to NAV for Granite. For example, in late '21, it traded at a ~17% premium to NAV. While we would never underwrite a premium to NAV, it does highlight the REIT's high growth profile, which is the cornerstone of our thesis.
Risks / Catalysts
US Supply Growth
Many of Granite's North American markets, particularly in the US, have been impacted by elevated new supply deliveries. In its Q2 earnings call, management commented on this trend and rightly highlighted that development starts have been plummeting, setting up a rebound in early '24.
Availability rose in most of our markets in North America as new supply outpaced demand in the quarter. We do expect this trend to continue for the next 2 to 3 quarters as the backlog of current projects are delivered. However, we project that availability will begin to fall in early 2024, as I said on the first quarter call. As the pace of new starts has already begun to decelerate acutely from past quarters and a number of planned deliveries this year are being delayed. In most of our markets, we are witnessing a drop of 40% to 75% in new starts from Q2 versus Q2 of 2022. ( Q2 Earnings Call )
According to management, the impact of elevated supply continued to be felt through Q3, though starts reached "multiyear lows".
So although new supply continues to outpace demand in the short term, new starts, for example, in the U.S., are currently at multiyear lows. And when combined with a significant increase in the cost of development for new products, should support rent stabilization and potential rent growth in the latter half of 2024 and into 2025. ( Q3 Earnings Call )
We can look to Prologis' ( PLD ) recent commentary on the US supply picture for greater clarity. PLD notes that construction starts are down over 65% from their peak in Q3 '22 and expects a lull in deliveries starting in late '24. It believes market vacancy will peak around 6% (n.b., ~100bps below the historical average) briefly in '24 before trending back into the 4-5% range. Over the long term, PLD estimates that the space requirement for logistics real estate per unit of GDP will be ~20% higher than pre-pandemic due to structural shifts in consumer spending and supply chains. This reaffirms the long-term tailwinds benefiting industrial real estate.
Additionally, Granite has a significant loss-to-lease, providing a long-term rent growth runway largely insulated from short-term supply headwinds. As the table below shows, Granite has realized an extremely impressive leasing spread on new leases and renewals.
Leasing Spreads (EMpyrean; Granite)
In the Q3 call, CEO Kevan Gorrie spoke about the 206% leasing spread realized on a property in the GTA:
they were coming off a $7 rent. And I think our average rents in the GTA off the top of my head is around $10, so well below market. But we do have a number of leases, frankly, coming up over the next couple of years that are in that sort of $7 to $8 range. (Q3 Earnings Call)
Avison Young estimates that average industrial rental rates in the GTA for Q3 were ~$18.4 psf, ~80% higher than Granite's average in-place rent for the Canadian portfolio. The US national industrial average rent is ~US$7.6 psf (n.b., ~C$10 psf), ~60% higher than Granite's average in-place rent for the US portfolio. We estimate that Austrian market rents are ~30% higher than Granite's average in-place rents and that German secondary market and Dutch rents are ~40% higher.
Market Rents (Various)
In summary, we believe the significant loss-to-lease provides ample protection from the impact of near-term supply deliveries and a significant embedded long-term growth opportunity.
Public REIT Capital Rotation
Now that rates and inflation appear to have peaked, many highly leveraged REITs with significant floating rate exposure or near-term maturities are experiencing significant repricing. If this trend accelerates, it may draw capital away from more relatively expensive sectors that have fared much better over the past 2 years (e.g., industrial).
This is especially relevant in the face of slowing economic growth, notably in Europe, which is a contributing factor to the moderation in inflation and changing interest rate narrative. Economic weakness is a problem for most REITs on some level, but more so for industrial REITs.
We gain comfort from the essential nature of industrial properties for global commerce, Granite's long-term lease profile (n.b., +6-year WALT), significant loss-to-lease, and average credit rating of A for its top 10 tenants (n.b., ~50% of annualized revenue). It is also reassuring that industrial REITs have participated heavily in the recent REIT rally, with PLD up ~19% in the past month and Dream Industrial ( DIR.UN:CA ) up ~12%.
Conclusion
Our Buy rating for Granite is somewhat unique. Usually, we look for significant discounts to NAV/intrinsic value that offer the possibility of substantial capital appreciation with downside protection. Currently, Granite is being priced roughly in line with market cap rates. However, tightening bond yields, the strength of industrial market fundamentals, Granite's significant loss-to-lease, and management's disciplined capital allocation appear adequate for us to justify a small, long-term holding.
For further details see:
Granite REIT: Rock Solid Performance At A Reasonable Price