GPK - Graphic Packaging: Hard To Repeat 2022 Performance
2023-03-19 03:49:11 ET
Summary
- With the U.S. on the brink of a recession, Graphic Packaging Holding Company may find it hard to repeat its 2022 performance.
- A discounted cash flow model puts the stock as fully valued even with optimistic assumptions.
- Investors can consider acquiring the stock if the market's volatility pushes the stock below $20.
Graphic Packaging Holding Company ( GPK ) is coming from a strong 2022, but it remains to be seen if its growth can continue in 2023. The company may need a strong consumer to increase business volumes in a complex economic environment. The high-interest rate environment has reduced the valuation multiples applied to various sectors of the economy. A discounted cash flow model estimates the stock to be fully valued. A materials sector multiple of 13x gives the stock a 50% upside assuming the company can achieve its 2023 earnings estimate.
Strong 2022 growth may be challenging to repeat.
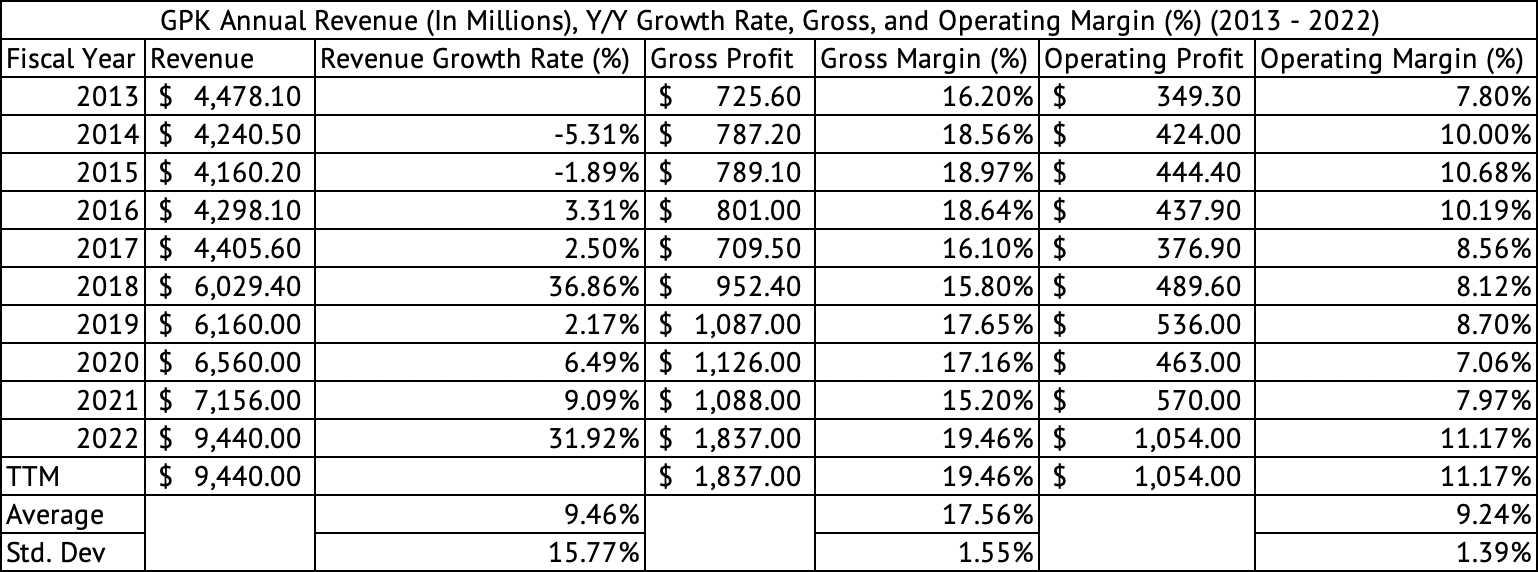
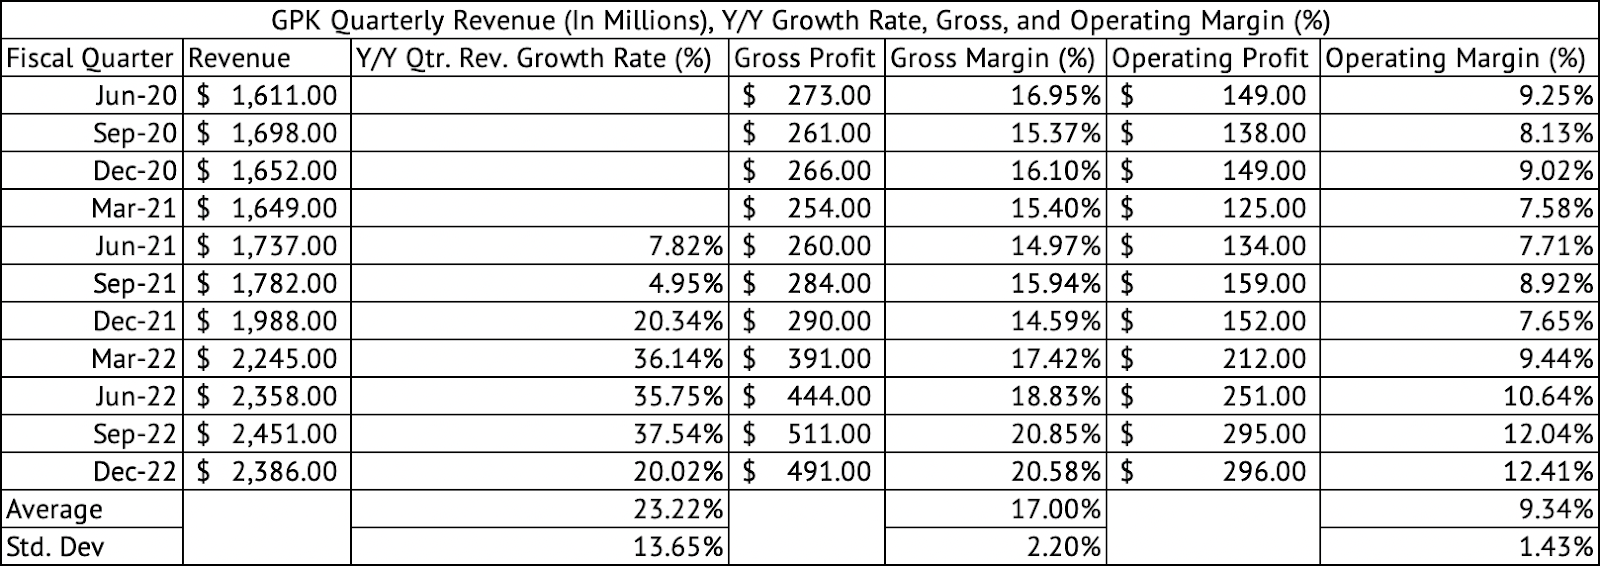
Graphic Packaging saw good revenue growth in 2022. Organic sales increased by 3% in 2022 compared to 2021. The company expanded its margins in 2022 to 19.4%, a new record compared to the past decade (Exhibit 1) . The company has averaged a gross margin of 17.5% since 2013. The company's performance in 2022 was so strong that it expanded gross margins each quarter from 17.4% in March to 20.5% in the quarter ending December 2022 (Exhibit 2) . The company's operating margin expanded to 12.4% in the December quarter compared to an average of 9.3% since June 2020.
Exhibit 1:
Graphic Packaging Holding Co Annual Revenue, Gross, Operating Profits, and Margin (%) (Seeking Alpha, Author Compilation)
These are excellent profit margins for the company. But, investors may question the long-term durability and sustainability of these margins. Investors can assess the margin variability by looking at the standard deviation. Since 2013 the gross margins have had a standard deviation of 1.55%, a low variability (Exhibit 1) . Similarly, the company's operating margins have a low variability of 1.39%. But, the current annual gross and operating margins are elevated, one standard deviation above the mean (Exhibit 2) .
Exhibit 2:
Graphic Packaging Holding Company Quarterly Revenue, Gross, Operating Profit, and Margins (%) (Seeking Alpha, Author Compilation)
These high margins may not be sustainable, with its gross margins dropping closer to its long-run average of 17.5% and its operating margins reverting to its mean.
Graphic Packaging's feeble competitive moat
At its heart, Graphic Packaging Holding Company supplies commodity packaging materials. Any competitive advantage the company may gain via acquisitions and new and modern manufacturing facilities may be sustainable in the short term. The economy's strength may also drive demand for the company's products and thus could impact margins. Although the company thinks a recession may not affect profitability of the company.
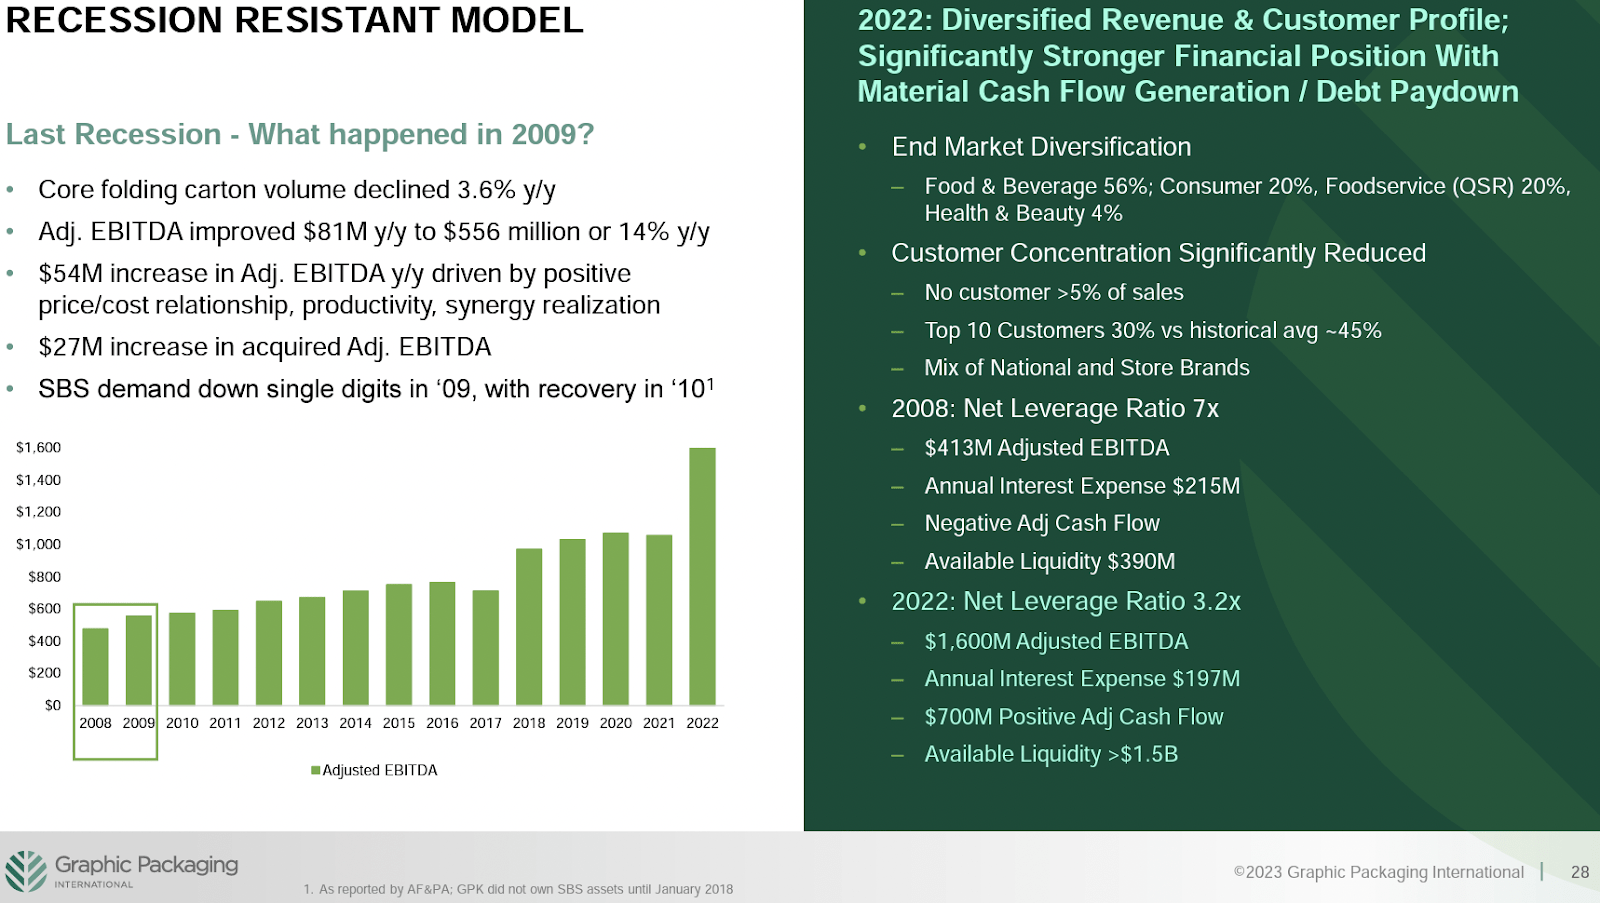
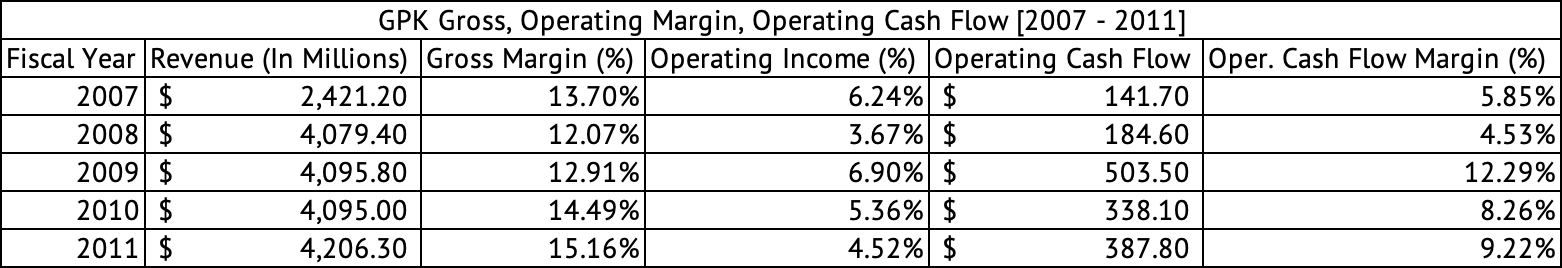
The company highlighted the fact that during the 2009 recession, its adjusted EBITDA improved by $81 million y/y to $ 556 million, a growth of 14% y/y (Exhibit 3) . But, its core folding carton volume declined by 3.6% y/y. The company's gross margins dropped in 2008 and 2009, potentially showing some impact due to the recession (Exhibit 4) . The company has diversified into essential consumer staples industries such as Food & Beverage, which may provide some protection against a demand collapse during a downturn. But, the company may not escape lower volumes and margins during a recession.
Exhibit 3:
Graphic Packaging Holding Company Recession Resistant Model (Graphic Packaging Holding Company Investor Presentation)
Exhibit 4:
Graphic Packaging Holding Company Gross, Operating, and Cass Flow Margins (%) (SEC.GOV, Author Compilation)
The company's biggest short-term competitive advantage may be due to the current high-interest rate environment. The company has expanded and grown at low-interest rates during the past decade. It is challenging for competitors to add new production capacity in this rate environment. The banking crisis, triggered by the collapse of Silicon Valley Bank, may make banks bolster their balance sheet and liquidity. This crisis may make them somewhat wary of making new loans. It may become difficult for any company to fund manufacturing expansion using debt. Long-term investors need to consider the competitive moat and the demand drivers and invest at a valuation that may provide some margin of safety.
Free Cash Flow, Debt, and Valuation
The company's operating cash flow margin suffered in 2017 and 2018. In 2017 the company funded its retirement obligations for its employees, which took a bite out of operating cash flows. In 2018, receivables jumped to $1158.1 million from $658.8 million in 2017. This increase in receivables reduced cash flows. Considering 2017 and 2018 as outliers and excluding them from our analysis, the operating cash flow margin jumps from an average of 7.14% over the past decade to 10.25%.
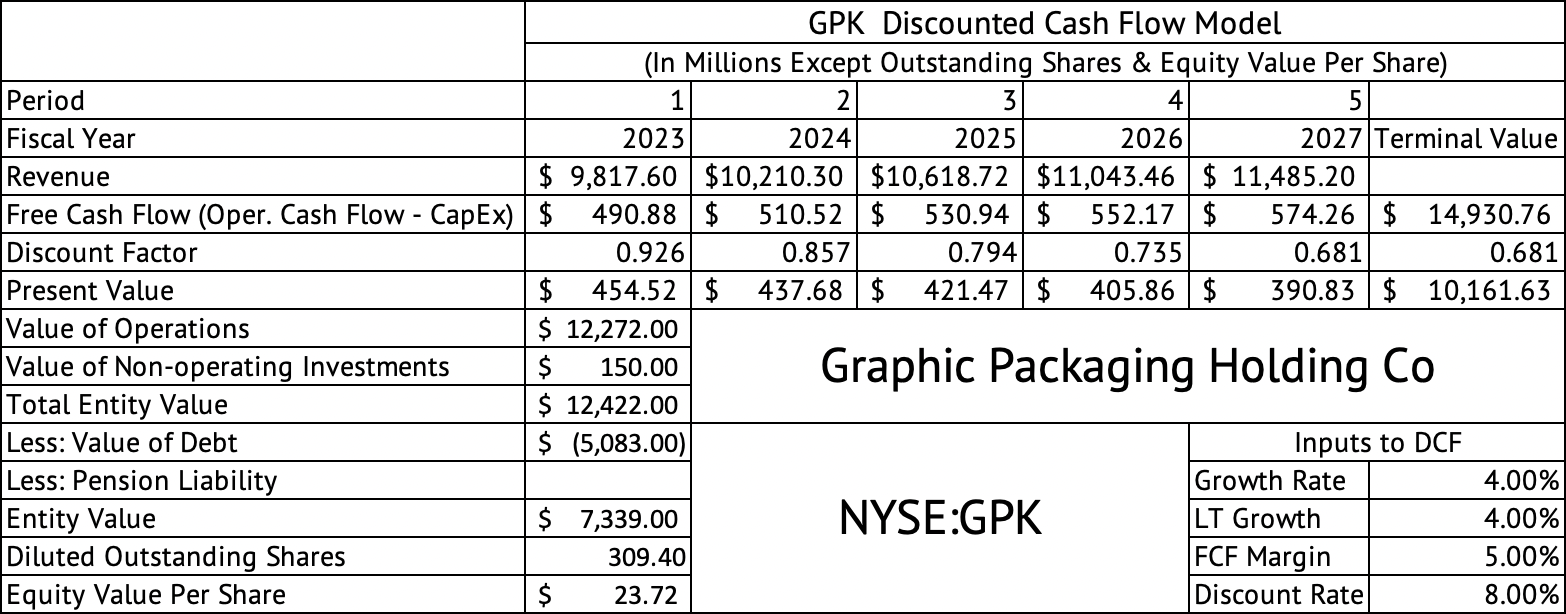
Based on the diluted share count of 309.5 million and a share price of $23.30, the free cash flow yield per share is 7.5% at the end of 2022, a good yield. A discounted cash flow model yields a per-share value of $23.72 (Exhibit 5) . This model assumes revenue growth of 4%, a free cash flow margin of 5%, and a discount rate of 8%. This 5% free cash flow margin is well above the average of 3.4% over the past decade, excluding 2017 and 2018, when free cash flow was negative.
Exhibit 5:
Graphic Packaging Holding Company Discounted Cash Flow Model (Seeking Alpha, Author Calculations)
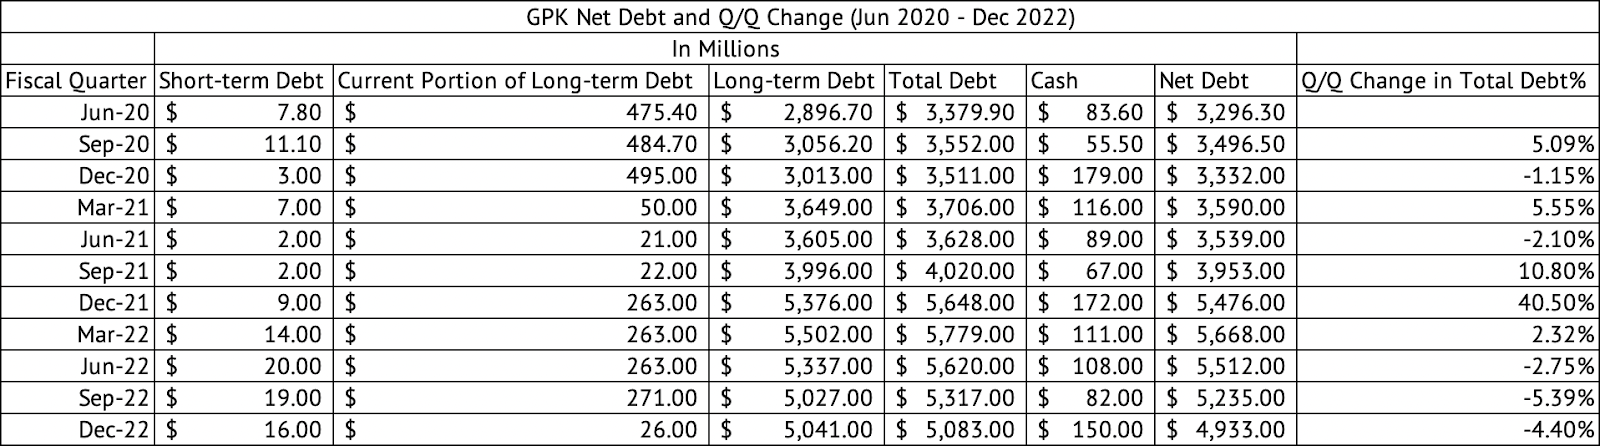
The company's current cost of capital is well below 8%, mainly driven by the low-interest rates it pays on debt issued during the low-interest rate environment of the past decade. But, the equity holders demand much higher returns, and the borrowing costs have increased considerably for all companies, especially those with high debt levels, such as Graphic Packaging Holding Company. At the end of December 2022, the company has total debt of $5 billion and net debt (after cash) of $4.9 billion (Exhibit 6) . Its debt-to-EBITDA ratio stands at 3.7x especially given that the company had a strong 2022 and generated high operating income and cash flows (Exhibit 7) . Any weakness in the business would only drive the debt ratios higher, justifying the speculative rating by the rating agencies.
Exhibit 6:
Graphic Packaging Holding Company Debt (Seeking Alpha, Author Compilation)
Exhibit 7:
Graphic Packaging Holding Company Debt-to-EBITDA Ratio (Seeking Alpha)
A debt-to-EBITDA ratio of 2x or below would be reasonable for the company. In the future, even a lower debt would mean increased interest expense. Investors may have to pay attention to the ongoing CapEx requirements since CapEx reduces free cash flow and can limit the amount the company can use to pay down its debt. The company has spent an average of 6.7% (with a standard deviation of 2.1%) of its revenue on CapEx over the past decade (Exhibit 8) .
Exhibit 8:
Graphic Packaging Holding Company Annual Capital Expenditure (Seeking Alpha, Author Compilation)
Given current rates and the company's indebtedness, it may be too optimistic to assume an 8% discount rate. But, even with a favorable 8% discount rate, the per-share value is about where the stock is priced today. Moody's and S&P have given the company's debt a speculative rating , with Moody's giving it a Ba1 and S&P giving it a BB+. According to S&P , this BB+ rating indicates the company's debt is less vulnerable in the near term but faces ongoing uncertainties to adverse business, financial, and economic conditions.
The company has a forward GAAP PE of 9.2x, compared to the sector median of 13x and the company's five-year average forward GAAP PE of 16.9x. But, it may be unreasonable to expect Graphic Packaging Holding Company to trade at 16.9x in this economic environment. The Vanguard Materials ETF ( VAW ) trades at a PE of 13.5x and a price-to-book ratio of 2.8x. A 13x forward PE would put the stock at $35.75 based on the 2023 EPS estimate of $2.75. Based on the sector PE the stock may be undervalued.
Graphic Packaging Holding Company enjoyed a strong 2022, but a recession may take hold in the U.S. in 2023, impacting volumes, margins, and cash flows. Given the demographic headwinds, the U.S. may have entered a decade of slow economic growth with or without a recession. The economy may have to get used to higher interest rates and bouts of high inflation. Historical valuation metrics may not apply to the company any longer. The company operates in a commodity market with no competitive moat. Investors should be opportunistic in buying Graphic Packaging if the market's volatility takes the stock below $20.
For further details see:
Graphic Packaging: Hard To Repeat 2022 Performance