GPK - Graphic Packaging: Yet To Deliver The Productivity-Driven Margin Improvement Of Vision 2025
2023-09-07 07:33:57 ET
Summary
- Graphic Packaging's revenue and earnings have more than doubled in the past 8 years, but this growth is largely driven by acquisitions and not sustainable reinvestment.
- The company's Vision 2025 aims for productivity-driven margin improvement, but there is no track record of such improvements in the past.
- There is no margin of safety for GPK unless there are at least 1% improvement per annum in GP margins, SGA margins, and return over the next 5 years.
Investment Thesis
Graphic Packaging Holding Company's ( GPK ) revenue and earnings more than doubled over the past 8 years. But acquisitions accounted for a big part of the growth. This was not only a debt-driven growth but also one that is at an unsustainable Reinvestment rate.
The company’s Vision 2025 aims for a productivity-driven margin improvement. But there is no trend of such efficiency and productivity improvements over the past 8 years.
There is only a margin of safety if there was at least a 1 % improvement per annum in GP margins, SGA margins, and return over the next 5 years. Until the company demonstrates that these can be delivered, I would hold off on any investment in GPK.
Business Background
GPK is a leading provider of sustainable fiber-based packaging solutions for a wide variety of products to food, beverage, food service, and other consumer products companies.
The Company has three reportable segments:
- Paperboard Mills whose products are also consumed internally by the Americas and Europe Paperboard Packaging segments.
- Americas Paperboard Packaging.
- Europe Paperboard Packaging.
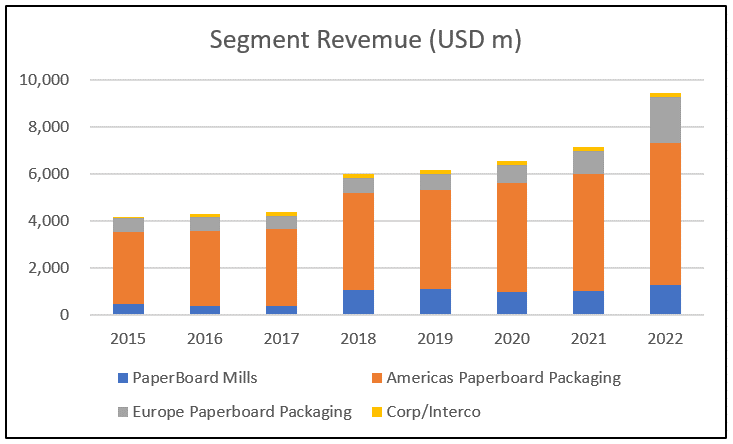
The Americas Paperboard Packing segment is the most significant revenue contributor as can be seen from Chart 1.
Chart 1: Segment Revenue (Author)
Notes to Chart 1
The Paperboard Mills segment revenue covered only the revenue to external customers. From 2018 to 2022, about 71% of the Paperboard Mills combined production was for internal use.
The company is currently pursuing its Vision 2025 which was first introduced in its 2019 Annual Report as:
“…committed to significant EBITDA, cash flow, and return growth over the next 6 years. Keys to achievement include continued productivity-driven margin improvement, net organic volume growth, and successful integration of targeted acquisitions.”
But I think the root of Vision 2025 was in 2014 when it reported:
“…We have spent several years transforming Graphic Packaging into a pure-play global paperboard packaging company… we have built a business model that vertically integrates low-cost mills with a network of highly efficient converting facilities. The last of the major steps in this transformation were completed in 2014…”
Given this background, I think it is more appropriate to analyze GPK's performance from 2015 to 2022 rather than from 2019 to 2022.
In the context of delivering Vision 2025, there were significant growths when comparing the 2022 values with those of 2015.
- EBITDA grew at 12 % CAGR.
- Free cash flow to the Firm (FCFF) grew at 22 % CAGR.
- Paperboard mill tonnage (as a proxy for volume) grew at 6% CAGR.
However, looking at these outputs without considering the corresponding inputs is misleading. So, KIV your judgment of the performance until we have reviewed the efficiency or productivity metrics.
Performance
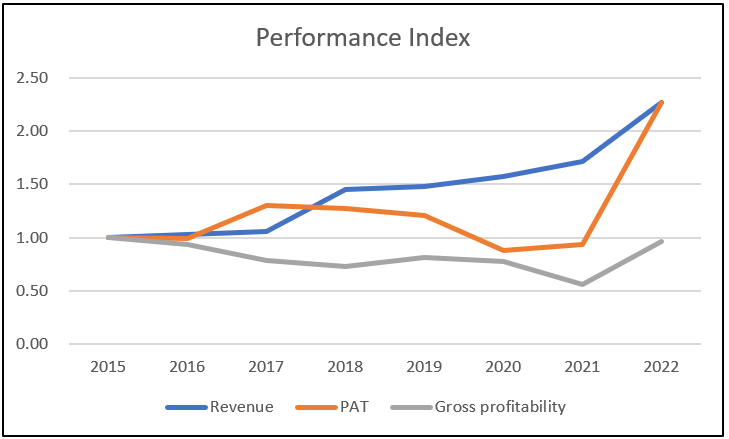
I looked at 3 metrics to get an overview of the overall performance – revenue, PAT, and gross profitability (gross profits / total assets).
From 2015 to 2022, revenue and PAT each grew at 12 % CAGR. While revenue showed an uptrend from 2015, PAT increased from 2015 to 2017 before declining over the next 4 years. Then it spiked in 2022 to give an overall PAT growth when considering 2015 to 2022.
However, there was hardly any growth in gross profitability. Refer to Chart 2. This was because gross profit growth was accompanied by an equivalent growth in total assets. In other words, there were no improvements in capital efficiency.
Chart 2: Performance Index (Author)
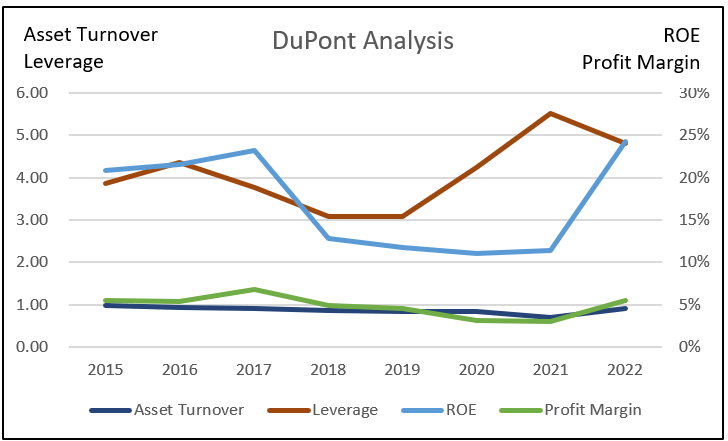
This poor capital efficiency picture is supported by a DuPont Analysis which showed that there was hardly any change in asset turnover over the past 8 years. Refer to Chart 3.
In the context of Vision 2025, while the company built a vertically integrated business, there was no consistent uptrend in ROE. From 2015 to 2022, ROE only grew at 2 % CAGR. You can see that a significant portion of the growth occurred in 2022.
More significantly was that the growth in the ROE seemed to be due to growth in leverage. It was a debt-driven growth as there was hardly any change in the profit margins.
The relatively "stable" profit margins and gross profitability are not signs of an operation with “continued productivity-driven margin improvement”.
This is reinforced by the SGA margins. While revenue had more than doubled from 2015 to 2022, there was no trend indicating a decrease in the SGA margins.
Chart 3: DuPont Analysis (Author)
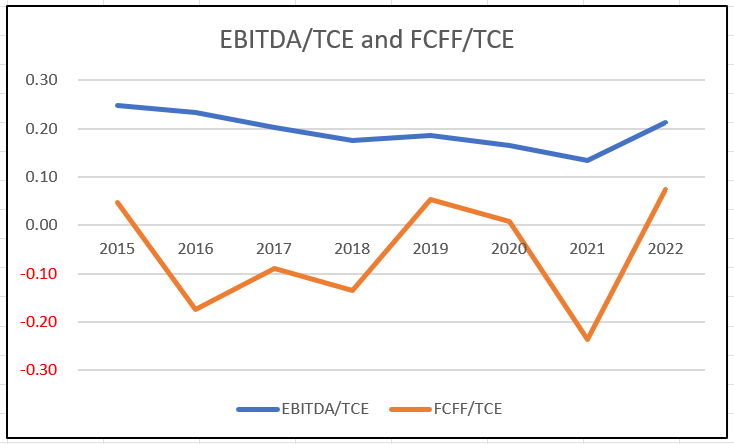
Of course, from 2015 to 2022, there were growths in EBITDA and FCFF in line with Vision 2025. But I think looking at these outputs without considering the inputs can be misleading.
To get a more realistic picture I scaled the EBITDA and FCFF by the Total Capital Employed (TCE) where:
TCE = Total Equity + Debt – Cash.
Chart 4 illustrates the trends over the past 8 years for these metrics. You can see that there were no growth trends for both of them. EBITDA/TCE showed a declining trend. Furthermore, there were 4 years when the FCFF/TCE was negative.
Chart 4: EBITDA and Cash Flow efficiencies. (Author)
The key takeaway is that the company has yet to deliver its “continued productivity-driven margin improvement.”
1H 2023
For the first half of 2023, the company continued with the revenue and PAT growth trends.
- Revenue grew by 5 % compared to that for the first half of 2022. This is of course a significant reduction compared to the full-year 2022 revenue growth of 32%.
- Operating income increased by 73% due to higher pricing and cost savings that were partially offset by inflation, downtime, and lower volume.
However, from a long-term perspective, I consider quarterly results as “noisy” and pay less attention to them compared to the longer-term trends.
Growth
Over the past 8 years, revenue grew at 12 % CAGR. To get an understanding of what drove the growth, I broke them into 2 categories:
- Acquisitions vs others. “Others” refers to a combination of organic growth, divestiture, and others such as forex.
- Price vs volume.
Overall, acquisitions accounted for 78% of the revenue growth.
Price growth accounted for about 27% of the revenue growth, the bulk of which occurred in 2022. Refer to Table 1.
These are of course rough estimates but they point to the direction of the growth contribution.
Table 1: Growth Analysis (Author)
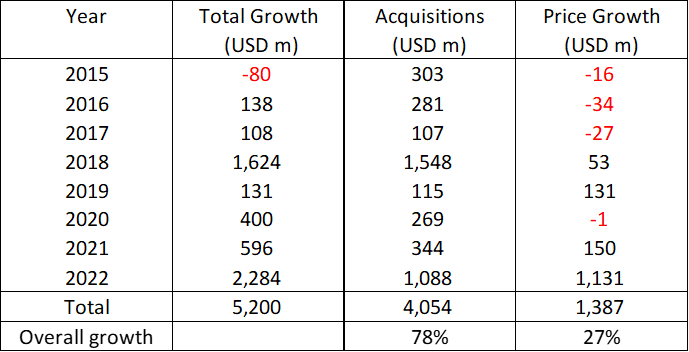
Notes to Table 1. The values in each row represent the change in revenue for the year compared to the previous year. Acquisition and Price growth are two different dimensions of the Total growth and as such they do not add up to the Total growth.
I deduced that without the acquisitions, revenue growth rate would be less than the long-term US GDP growth rate. You should not be surprised as the packaging sector is a mature one. For example, according to Mordor Intelligence , the global packaging market is expected to grow at a CAGR of 3.94% during the forecast period (2023-2028).
In the context of price vs. volume, you should not be surprised by the higher volume contribution given the scale of the acquisitions. More significant is that there were years when there was negative price growth.
The huge price growth in 2022 explained not only the 2022 spike in revenue but also profits. In 2022, the Gross profit margin (GP margin) increased from 15.2% in 2021 to 19.5 % in 2022.
The price growth continued through the first half of 2023 where it accounted for a USD 424 million increase compared to the total revenue increase of USD 227 million. Note that for the first half of 2023, the total revenue growth was reduced by volume-mix and forex losses.
Looking at the historical price performance, I am more inclined to believe that the 2022 and 2023 price spikes are one-offs. This is supported by the picture shown in Chart 5.
Chart 5: Producer Price Index - Corrugated and Solid Fiber Box Manufacturing (FRED)
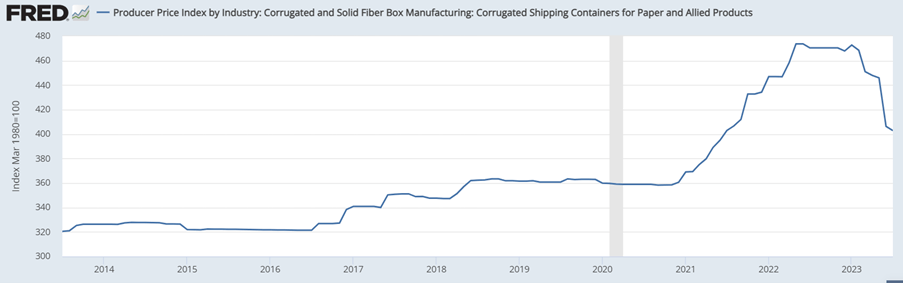
I have earlier mentioned that there was no change in the asset turnover. Over the past 8 years, while revenue grew at 12% CAGR, total assets also grew at 12 % CAGR. This was an asset-driven revenue growth.
Looking at Table 2, you can see that GPK spent about USD 6 billion on CAPEX and acquisitions over the past 8 years. Due to the annual acquisitions, it makes more sense to treat them together as the company had not indicated the portion of the CAPEX for old plants and those for the newly acquired plants.
Table 2: Sources and Uses of Funds 2015 to 2022 (Author)
Notes to Table 2:
a) Other financing includes factoring and supply chain financing arrangements.
b) Net CAPEX is after accounting for sales of PPE.
c) Net acquisitions are after accounting for divestitures.
Growth needs to be funded and one metric for this is the Reinvestment. This is defined as:
Reinvestment = CAPEX & Acquisitions – Depreciation & Amortization + Net Changes in Working Capital.
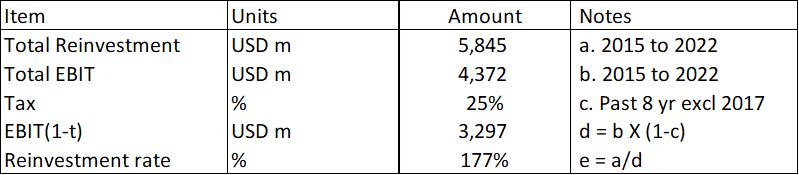
I then determined the Reinvestment rate = Reinvestment / after-tax EBIT.
The Reinvestment rate for the past 8 years was 177%. Refer to Table 3. This is not a sustainable rate as the amount spent to fund the growth far exceeded the after-tax EBIT.
Table 3: Reinvestment rates of 2015 to 2022 (Author)
Did growth over the past 8 years create shareholders’ value? For growth to create shareholders' value, the returns have to be greater than the cost of funds.
Over the past 8 years, the average return as measured by EBIT(1-t) / TCE was 9%. As can be seen from Table 4, this far exceeded the cost of funds by 7 %.
Table 4: Estimating the WACC (Various)
Notes to Table 4: This was based on the first page of the Google search for the term “GPK WACC.”
What are the takeaways for the valuation of GPK? Over the past 8 years, GPK has managed to grow its revenue and earnings. While this growth has created shareholders’ value, it is not a sustainable growth rate.
- The Reinvestment required for growth far exceeded the after-tax EBIT.
- Growth was fueled by Debt that has resulted in a 246 % Debt Equity ratio as of the end of Dec 2022.
- There were years when the FCFF was negative. We needed positive values for a meaningful DCF valuation.
I postulate that growth will have to eventually slow down to a sustainable rate. When this happens, the company will be able to generate a lot of positive free cash flow.
Financial position
I normally avoid companies with a Debt Equity ratio greater than 1. This was my first red flag for GPK. I also have other concerns about GPK's financial position based on the following:
- As of the end of Dec 2022, GPK has USD 150 million in cash. This was only about 1 % of its total assets.
- As of the end of Dec 2022, GPK had a Debt / Total Capital ratio of 66%. According to Damodaran Jan 2023 datasets, the packaging and container sector average ratio was 38 %.
- Its average cash conversion cycle increased from 45 days in 2015/16 to about 52 days in 2021/22.
- Over the past 8 years, there were 2 years with negative cash flow from operations.
But there were also positive points:
- Over the past 8 years, GPK generated about USD 411 million in cash flow from operations annually compared to an annual average PAT of USD 284 million. This is a good cash conversion ratio.
- Its EBITDA / Interest expenses for the past 2 years averaged 9.
Management has stated that it plans to reduce Debt. But this is not achievable if GPK continues with acquisitions at an unsustainable Reinvestment rate.
You can see from Table 2 that it is almost impossible to maintain the high acquisitions yet return capital to shareholders, and reduce Debt.
Valuation
In valuing GPK, I assumed that its revenue would continue to grow at its historical growth rate for Years 1 to 3. Thereafter it starts to reduce to reach the long-term perpetual growth rate of 4% by Year 5.
I assumed that the Reinvestment rate would be governed by the fundamental growth equation of growth = Return X Reinvestment rate. Based on this, for Years 1 to 3, we would have unsustainable Reinvestment rates ie greater than 100 % of the after-tax EBIT. But by Year 5, it would be reduced to about 43 % of the after-tax EBIT.
Thus, by Year 5, the company would generate considerable Free Cash Flow to the Firm. The key parameters driving the Free Cash Flow are GP margins, SGA margins, and Return.
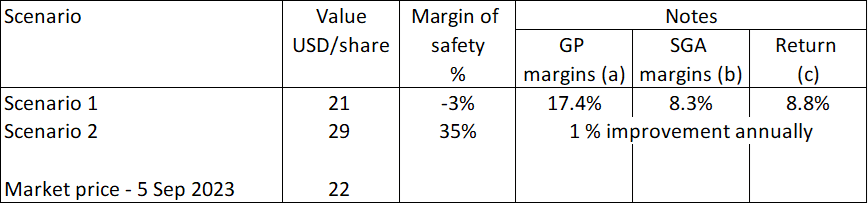
I considered 2 Scenarios in my valuation.
- Scenario 1. This is the steady one where the GP margins, SGA margins, and Return are the 2015 to 2022 averages.
- Scenario 2. This is one with efficiency and productivity improvements. I assumed that there would be 1% improvements in each of the 3 metrics every year.
The key assumptions and the results of the valuations are summarized in Table 1. You can see that there is no margin of safety under Scenario 1. But there is a 35 % margin of safety under Scenario 2.
My only concern with Scenario 2 is that I have yet to see the improvements planned under Vision 2025. But if you are confident that management can deliver the numbers, you will invest.
But I would hold off until management can show that they can:
- Drive productivity improvements rather than just revenue growth.
- Bring growth down to a more sustainable level.
Table 5: Summary of valuation and margin of safety. (Author)
Notes to Table 5: Scenario 1 for (a), (b) and (c) = average of 2015 to 2022. Scenario 2 = 1 % improvements annually for the next 5 years for the 3 parameters starting from the Scenario 1 values.
Valuation model
I valued GPK based on a 3-stage Free Cash Flow to the Firm Model where:
- Stage 1. There is a high revenue growth of 12.4% per year for Years 1 to 3. This is based on the 2015 to 2022 CAGR in revenue.
- Stage 2. The growth rates in Years 4 and 5 reduced proportionately to 4 % in Year 5. This 4 % is based on the long-term US GDP growth rate.
- Stage 3. Thereafter there is perpetual growth at 4%. This is the terminal growth rate.
A sample calculation is shown in Table 6.
Table 6: Sample calculation for Scenario 2 (Author)
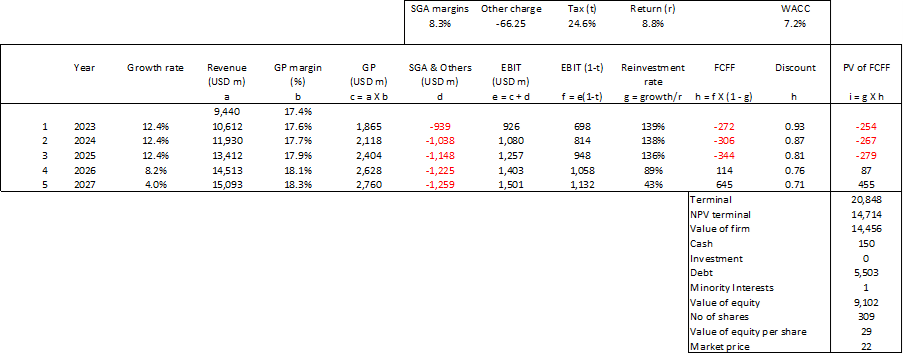
The critical parameters are the GP margins, SGA margins, and Return. Refer to Table 5.
SGA & Others. Over the past 8 years, GPK incurred about USD 66 million per year for write-offs and other restructuring charges. I assumed that these charges would continue. As such the cost as per item “d” comprises the SGA expenses (based on % of revenue) plus these other charges.
FCFF = EBIT(1-t) X (1- Reinvestment rate).
The tax rate was based on the past 8 years' average rate excluding 2017 as this was a tax credit year.
Reinvestment rate was derived from the growth equation and = Growth rate / Return
Return = EBIT(1-t) / TCE. I took the average 2015 to 2022 values to represent the long-term return.
The discount was based on the WACC as shown in Table 4.
The value of Equity = Value of the Firm + Cash equivalents + Investments – Debt – Minority Interests.
The Cash, Debt, and Minority Interests were based on the Dec 2022 values.
Risks and limitations
There are 2 critical assumptions in my valuation:
- Sustainable Reinvestment rate for both Scenarios.
- Delivering the productivity-driven margin improvement for Scenario 2.
The crux of my valuation is that GPK would progress from a high-growth rate to a lower long-term perpetual growth over the next 5 years. Accordingly, for both Scenarios, I assumed that GPK would reduce the Reinvestment rate to a sustainable level by Year 5.
This does not mean that there will not be further acquisitions. Instead, I assumed that further acquisitions would be funded by internally generated funds.
If GPK fails to move towards the sustainable Reinvestment rate, there will not be any positive Free Cash Flow to the Firm. In other words, I am not sure whether a DCF valuation makes sense if this reduction in Reinvestment rate does not happen.
Secondly, GPK has yet to show any productivity-driven margin improvements even though this is critical for Scenario 2. You may argue that this is because I chose 2015 as the base year for my analysis.
Vision 2025 was first stated only in 2019. Shouldn’t we then be looking at improvement with 2019 as the base year?
Looking at Charts 2, 3, and 4, you can see that there are margin improvements from 2019 to 2022.
But I rather not use this basis as this looks like choosing a low base period just to meet the numbers. The company may have articulated Vision 2025 in 2019. But Vision 2025 was built on a business model that vertically integrates low-cost mills with a network of highly efficient converting facilities that was completed in 2014.
The real concern is whether management has plans and programs to drive the productivity-driven margin improvements. I could not find much discussions in the 2022 Annual Report on these. Even in the Q2 Presentation of results, there was hardly any mention of specific programs to drive efficiency and productivity.
Conclusion
While GPK had achieved revenue and profit growths over the past 8 years, these were driven by acquisitions rather than efficiency or productivity improvements.
There are limits to this growth by acquisitions. Firstly, the Reinvestments to drive growth are at an unsustainable Reinvestment rate. Secondly, it has resulted in high leverage.
The packaging sector is not a high-growth one. Of course, kudos to management for driving growth so far. But I think the company is nearing a stage where the tough part of Vision 2025 - productivity-driven margin improvement – has a central role.
My analysis and valuation showed that there is only a margin of safety if there are efficiency and productivity improvements. Revenue growth alone is not sufficient.
You can understand why I do not consider GPK stock an investment opportunity as I have yet to see a track record of productivity-driven margin improvements.
I am a long-term value investor and my analysis and valuation are based on this perspective. This is not an analysis for those hoping to make money over the next quarter or so.
For further details see:
Graphic Packaging: Yet To Deliver The Productivity-Driven Margin Improvement Of Vision 2025