NEE - Green's Portfolio: Focus On Utilities In July-August 2023
2023-09-05 03:43:41 ET
Summary
- I increased my portfolio investment in July-August to focus on stocks and funds in the Utilities sector, which has been underperforming.
- For July-August, I closed positions in 12 stocks in the portfolio, with a mean gain of +20.8% not including dividends. I opened 4 new positions.
- Details are provided for the portfolio's 18 Utilities stocks and 5 CEFs with large Utilities exposure.
The allocation of investment in my Green's portfolio changed during July-August, as always, but during this period I emphasized stocks and funds in the Utilities sector. About 37% of new investment was added to 10 Utilities stocks and 4 CEFs with high Utilities exposure. I did this by deploying some of my cash reserve and profits from trades this year. Utilities has been the worst-performing sector over the past year, and I view this as an opportunity to open/add to positions for trading when the sector rebounds. In the meanwhile, I will earn dividends as I focus mostly on well-known, dividend-paying stocks in the S&P 500 index.
My portfolio is a retirement investment in a Roth IRA, so my profits are tax-fee. Readers of previous articles know that I favor high-yield income in combination with swing/position trading of stocks, mostly well-known names in the S&P 500, all as part of managing for risk. It's dynamic and I enjoy doing this as a small part of my retirement time. It's working well: over the past 4.5 years, my annual total return on investment has been 25%.
Stock Allocation Changes
In my 2023 mid-year review article , my portfolio reflected some significant changes for stock positions across sectors compared to my reporting in September 2022. In the past 2 months, there were more changes, with an increasing focus on the under-performing Utilities sector.
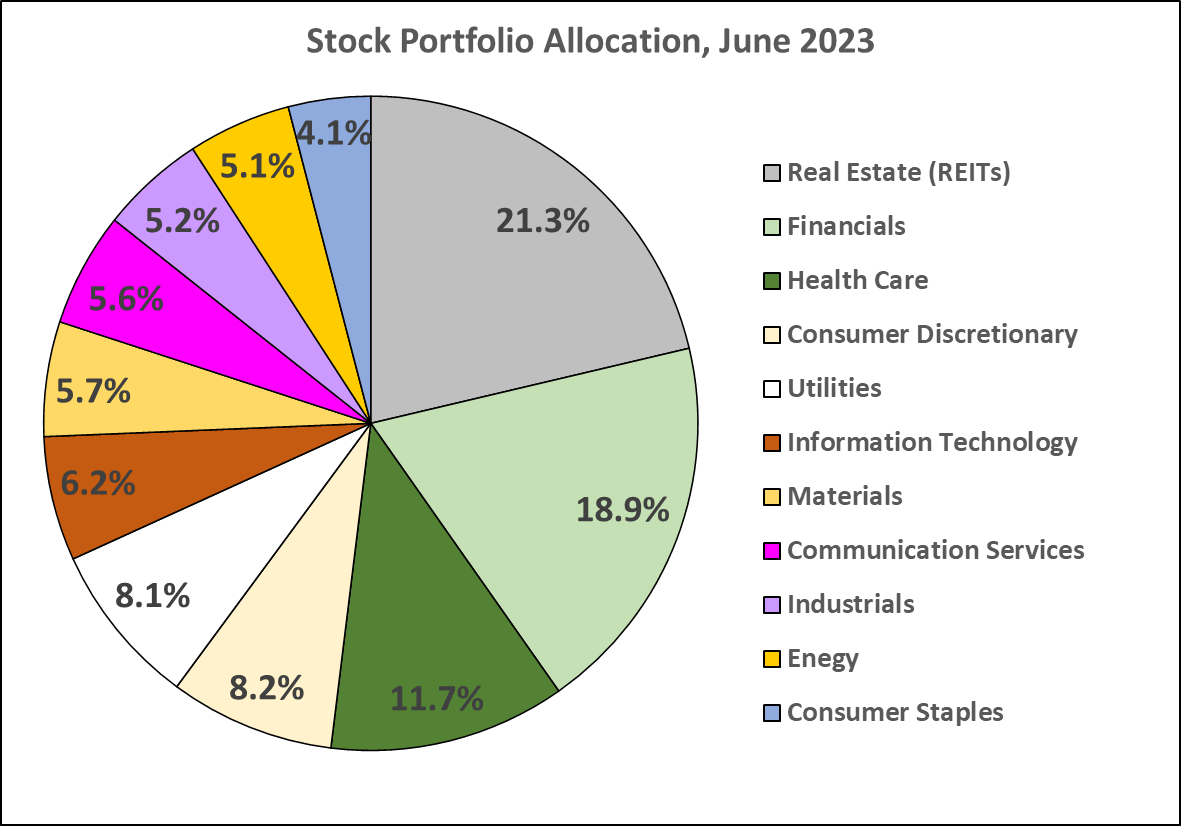
My portfolio allocation at the end of June 2023 was comprised of 39,428 shares across 61 CEFs, representing 59.3% of total portfolio investment. In addition, I held 12,421 shares across 117 individual stocks, representing 39.2% of portfolio cost. There was also a small cash reserve, at 1.5%. Below is a pie chart of my stock allocation across sectors. In June, REITs, Financials, and Health Care were the largest sectors, at 51.9% of my stock portfolio.
Stock Portfolio Allocation, June 2023 (author)
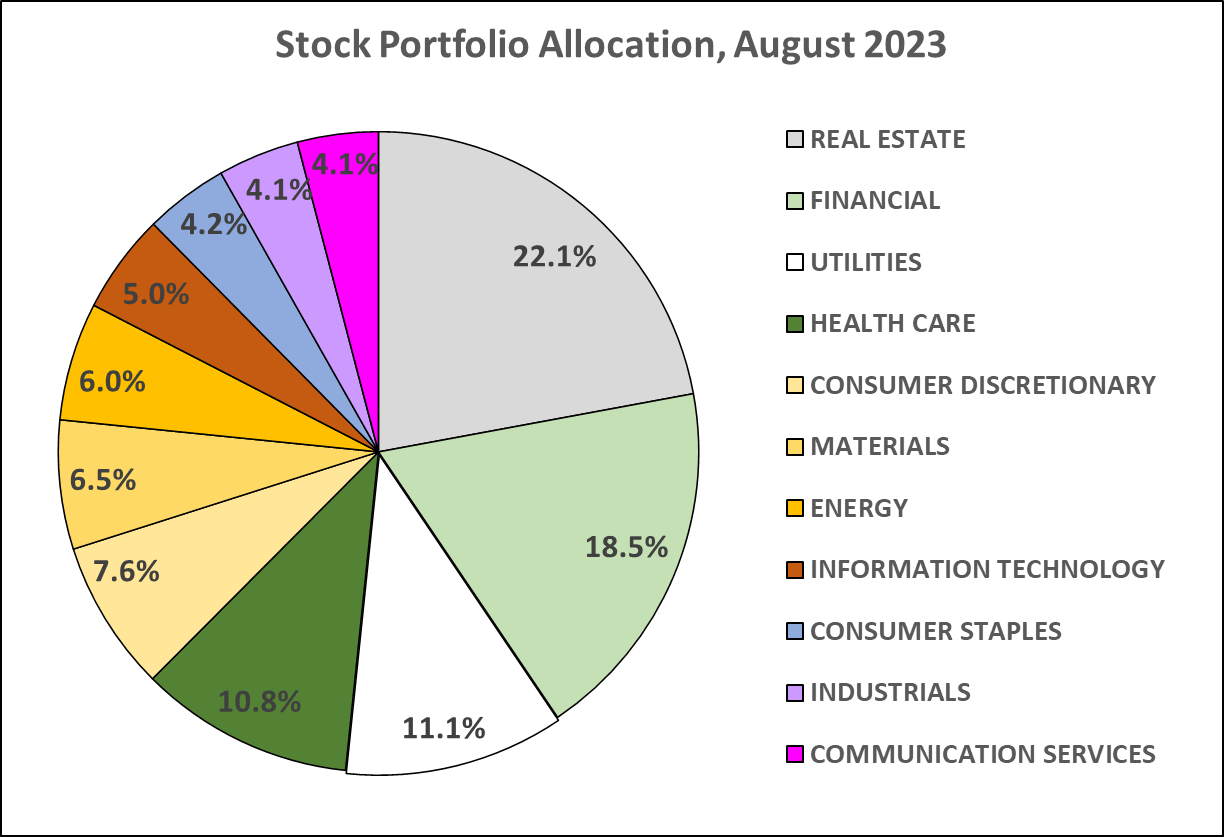
At the close of August, the portfolio has changed. With 40,785 shares across the same 61 CEFs and 12,558 shares across 108 individual stocks, the overall allocation to income and trading did not change much. However, it changed across sectors, as presented in the pie chart below. REITs and Financials are still my largest holdings, but Utilities increased to 3rd largest from 5th largest in June. These top 3 sectors currently comprise 51.7% of my stock portfolio. Stocks in the Energy sector also advanced to 7th from 10th but at less than 1% difference, and stocks in the Information Technology sector dropped 1.02% from 6th to 8th.
Stock Portfolio Allocation, August 2023 (author)
Changes in the portfolio result from both adding new positions and adding to existing positions as well as selling positions from the portfolio, which I detail below. In past articles I have presented all of the stocks in the portfolio, but I will do that regularly on the quarter. Here I focus on changes in the Utilities sector holdings that I have made over the past 2 months.
Readers who elect to follow my articles have free access to my trading blog , wherein I discuss all stock buys and sells for each day that trading occurs.
Portfolio Sells in July-August
During this period, I closed positions in 12 stocks, bringing the total closed stock trades to 59 for the year to date.
These 12 trades were for a mean gain, not including dividends, of +20.81% or a cost-weighted gain of +14.35%. The average number of months in the trades was 15.1, longer than my average time in trades, and ranged from <2 months for Amgen Inc. ( AMGN ), Charles Schwab ( SCHW ), and KeyCorp ( KEY ) to >2 years for Becton, Dickinson ( BDX ) and Capital Southwest ( CSWC ). For the first 47 trades this year, the mean time in trade was 8.9 months. As in the past, my positions are moderate in size, to manage risk.
In the table below, selected data is presented for the 12 stock trades, including ticker symbol and name, average unit cost, share sell price, % gain, trade close date, and months in the trade.
| Symbol |
| Description |
| Unit Cost ($) |
| Sell Price ($) |
| % Gain |
| Close Date |
| Mo. Held |
| AMGN |
| Amgen Inc. |
| 216.18 |
| 253.20 |
| 17.12% |
| 8/7/2023 |
| 1.8 |
| BDX |
| Becton, Dickinson and Co. |
| 231.52 |
| 282.67 |
| 22.09% |
| 7/25/2023 |
| 26.6 |
| CHTR |
| Charter Communications |
| 405.38 |
| 423.50 |
| 4.47% |
| 8/21/2023 |
| 16.0 |
| CMCSA |
| Comcast Corp. CL A NEW |
| 39.88 |
| 46.00 |
| 15.33% |
| 8/21/2023 |
| 20.4 |
| CSWC |
| Capital Southwest |
| 19.88 |
| 22.00 |
| 10.64% |
| 8/21/2023 |
| 43.7 |
| GSK |
| GSK plc SP ADR |
| 30.59 |
| 34.61 |
| 13.13% |
| 8/21/2023 |
| 11.1 |
| KEY |
| KeyCorp |
| 8.68 |
| 212.45 |
| 43.43% |
| 7/26/2023 |
| 2.7 |
| NSC |
| Norfolk Southern Corp. |
| 221.54 |
| 236.75 |
| 6.87% |
| 7/25/2023 |
| 22.5 |
| RRC |
| Range Resources - LOUISIANA I |
| 22.80 |
| 33.50 |
| 46.91% |
| 8/7/2023 |
| 5.5 |
| SCHW |
| Charles Schwab |
| 47.94 |
| 67.50 |
| 40.79% |
| 7/20/2023 |
| 2.6 |
| UNP |
| Union Pacific |
| 192.40 |
| 234.50 |
| 21.88% |
| 7/26/2023 |
| 10.0 |
| VRA |
| Vera Bradley |
| 6.09 |
| 6.52 |
| 7.02% |
| 7/3/2023 |
| 18.8 |
Taking profits is always subjective as I do not use any hard and fast rules. I mostly look for technical indicators of overbought conditions, using volume, MACD and Williams %R, and moving averages. I often mention my thinking for taking profits in comments in my trading blog. As of this date, 5 of the stocks sold are trading higher than my exit price and 7 are trading lower. Of those Norfolk Southern is down -12.8% and Schwab is down -10.4%.
The 59 trades closed for the year so far have a cost-weighted gain, not including dividends, of +14.49%. which is below my typical target exit of 20% for a trade. Of these, 37 (62.7%) were for <1 year in the trade.
Positions Opened in July-August
During this period I opened only 4 new positions, all of which I have traded previously:
- AES Corp. ( AES ), a S&P 500 Utilities sector stock
- FMC Corp. ( FMC ), a S&P 500 Materials sector stock
- Incyte Corp. ( INCY ), a S&P 500 HealthCare sector stock
- Telus Corp. ( TU ), a S&P 500 Communications Services sector stock
Since opening the trades, I've added shares, as I typically do, building my stake slowly as long as prices continue to move below my average unit cost. Except for Incyte, all of these were at new 1-year lows when I opened the positions. Readers of previous articles know that contrarian trading is my style, especially as I consider that stocks that are components of the S&P 500 have less risk of failing to turn around in time.
Sector Performance in July-August
While opening new positions in this period was limited, I added a considerable amount to my existing portfolio. In my view, there was a compelling sector for focusing investment during this time.
Using my TD Ameritrade Sector Performance charts, it is striking how the Utilities sector has significantly under-performed the S&P 500 and the other 10 sectors for every major time period for the past year. Utilities have been the worst performing sector for the past 1, 3, 6, and 12 months, with the sector down -13.97% for the past year, compared to a +13.84% gain for the S&P 500 overall. Here are the charts for the 1 and 12 month periods:
Sector Performance v. S&P 500 (TD Ameritrade)
Following Utilities, the Communications Services sector has dropped quickly to the 2nd worst-performing sector for the past 1 and 3 month periods, replacing the Consumer Staples sector which ranked 2nd worst for the 6 and 12 month periods.
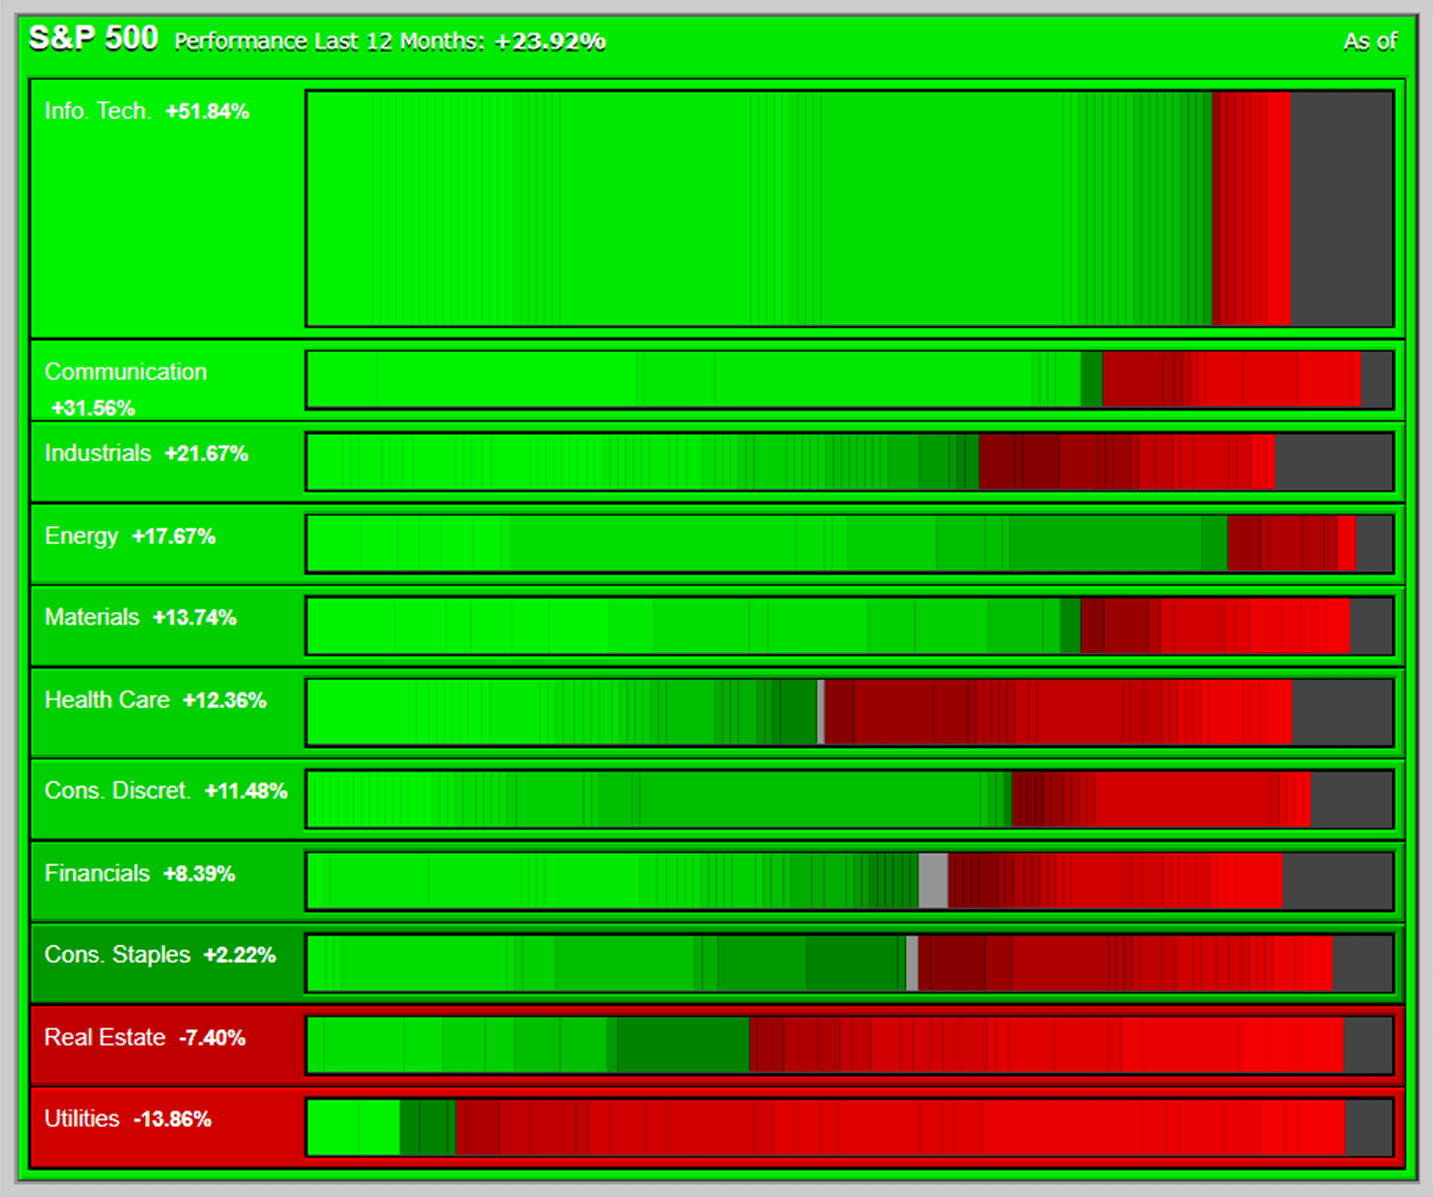
With apologies to those who are red-green color blind, the TD Market Monitor heat map shows how poorly the Utilities sector has really performed over the 12 month period. Only 5 (16.7%) of the 30 stocks in this sector have gained at all over the past year, and the 9 worst are each down >-20%. The 5 best-performing are PG&E Corp. (PCG), Constellation Energy Corp. ( CEG ), Atmos Energy Corp. ( ATO ), Edison International ( EIX ), and Pinnacle West Capital Corp. ( PNW ). The last time this sector sold off I traded 4 of these for profits.
The 9 worst-performing Utilities stocks over the past year are well-known names: WEC Energy Group Inc. ( WEC ), NextEra Energy Inc. ( NEE ), DTE Energy Co. ( DTE ), Evergy Inc. ( EVRG ), American Electric Power Co. ( AEP ), Xcel Energy Inc. ( XEL ), Eversource Energy ( ES ), AES Corp., and Dominion Energy Inc. ( D ).
12 Month Market Monitor S&P 500 (TD Ameritrade)
The Utilities sector has under-performed for several reasons, including being highly sensitive to interest rates, demand changes from unusual weather patterns, and surely issues such as management and adjusting to more sustainable energy models. It may also be that investor sentiment is affected by fear of potential liability for wildfires in some areas. Many analysts here at SA cover the sector and its stocks closely, so readers are encouraged to check them out to better understand what's happening with specific companies.
For whatever reasons, many of the S&P 500 Utilities stocks are real bargains based on technical price levels. Names such as WEC, AEP, NEE, ES, AES, LNT , BKH , and XEL are trading at levels first reached in 2019 and 2020, and their quarterly dividends have increased in recent years. Even if these trend lower, I am more than willing to wait for what should be rebounds of up to 40% or more to regain their recent highs.
Portfolio Additions in July-August
Over the past 2 months I added about 1,200 shares to stocks and about 1,350 shares to my Closed-end Funds [CEFs], a 69%/31% split regarding percentage of dollar investment. For my deployment of new money to stocks, 36% was for additions of >350 shares across 10 stocks in the Utilities sector, with the rest to 30 names in the other 10 sectors. For my deployment of new money to CEFs, 39% was for 300 shares to 4 CEFs with high exposure to Utilities stocks, with the rest to 24 other CEFs.
For additions to Utilities stocks, in order of dollar investment, I added the most to UGI , NEE, BKH, AES, and ES. This affected the ranking of my overall positions in the Utilities sector. In the table below, I present the 18 Utilities stocks currently in my portfolio, listed by highest cost, with the closing price on 8/31, my average unit cost, and the dividend yield.
| Symbol |
| Cls. 8/31 |
| Cost/share |
| Div yield |
| D |
| 48.54 |
| 66.89 |
| 5.50% |
| NRG |
| 37.55 |
| 33.32 |
| 3.95% |
| UGI |
| 25.18 |
| 25.55 |
| 5.84% |
| ES |
| 63.82 |
| 70.57 |
| 4.11% |
| WEC |
| 84.12 |
| 84.82 |
| 3.65% |
| NEE |
| 66.80 |
| 69.04 |
| 2.74% |
| BKH |
| 55.00 |
| 57.77 |
| 4.55% |
| AEP |
| 78.40 |
| 77.82 |
| 4.23% |
| XEL |
| 57.13 |
| 60.46 |
| 3.58% |
| BEP |
| 25.42 |
| 26.66 |
| 5.24% |
| AES |
| 17.93 |
| 18.29 |
| 3.66% |
| WTRG |
| 36.90 |
| 40.50 |
| 3.17% |
| LNT |
| 50.17 |
| 47.77 |
| 3.56% |
| SO |
| 67.73 |
| 55.13 |
| 4.08% |
| DTE |
| 103.38 |
| 106.56 |
| 3.69% |
| EVRG |
| 54.97 |
| 51.58 |
| 4.46% |
| DUK |
| 88.80 |
| 81.02 |
| 4.55% |
| OGE |
| 34.05 |
| 34.42 |
| 4.86% |
The mean dividend yield for this group is 4.19%. Of my 18 positions, only 3 (UGI, WTRG, and OGE) are not components of the S&P 500. Other S&P 500 Utilities stocks not in my portfolio at this time include: AEE, ATO, AWK, CEG, CMS, CNP, ED, EIX, ETR, FE, NI, PEG, PGC, PPL, PNW, and SRE. Overall, my Utilities positions are down -5.1% on cost, which is fairly good given the selloff that is still underway. I plan to continue to add to these stocks if prices decline.
I have 5 CEFs in my portfolio that have significant concentrations of Utilities sector stocks, including:
- Reaves Utility Income ( UTG ), ~77% Utilities
- DNP Select Income ( DNP ), ~77% Utilities
- BlackRock Utilities, Infrastructure, & Power Opportunities ( BUI ), ~48% Utilities
- John Hancock Tax-Advantaged Dividend Income ( HTD ), ~48% Utilities
- Cohen & Steers Infrastructure ( UTF ), ~ 39% Utilities
During July-August, I added to 4 of these: UTG, DNP, HTD, and UTF. I typically like to add to CEFs when discounts to NAV are wide, in the 5-10% range, but at this time UTG is trading at a small premium, and DNP is trading at a large premium, as usual.
My additions to CEFs are primarily to continue to generate income, and these are paying as follows: UTG (8.65%), HTD (8.65%), UTF (8.55%), DNP (7.78%), and BUI (6.78%), according to data from CEFConnect . My additions to individual utilities stocks is also to generate income, but it is even more so to provide opportunities for swing/position trades as the names rebound from their year-long downtrends.
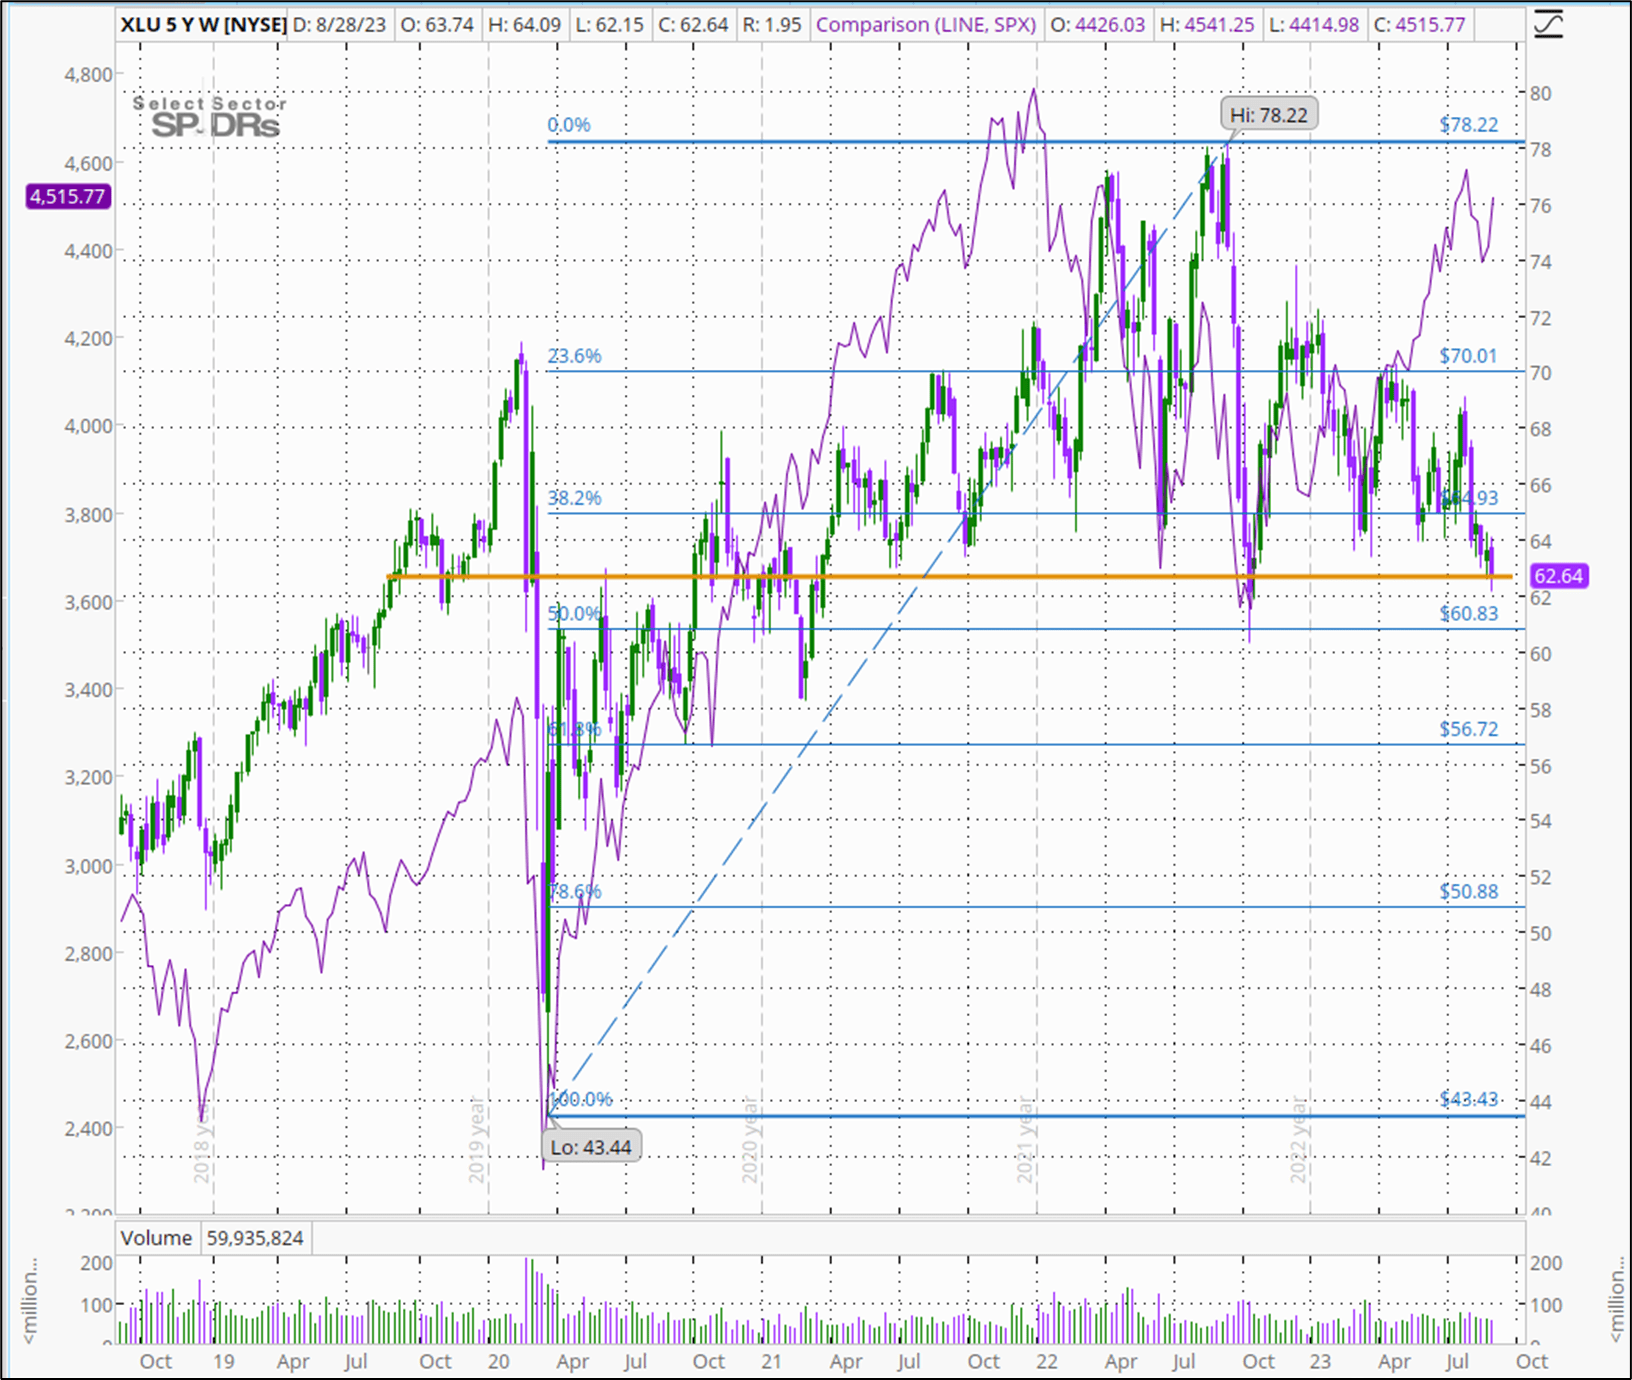
Some astute readers will say, why not simply buy the index? That's one approach. The SPDR Select Sector ETF for Utilities ( XLU ) has 33 individual names, with 10 comprising 58% of the fund, according to the Aug. 31 CFRA fact sheet. Using my TD Ameritrade 'thinkorswim' platform, the 5 year weekly chart below for XLU shows that the ETF is now trading at a cost first reached 4 years ago (gold horizontal line). And current price is approaching the 50% retrace of the uptrend from the March 2020 COVID recession low to the mid-Sept. 2023 high, as seen by the Fibonacci retracement sequence lines in blue. That might be a level of support for traders. Also, while the XLU out-paced the S&P 500 (here using the SPX, in purple) before COVID, it started lagging when interest rates were raised in 2022. The XLU then peaked after the SPX topped, and while the SPX is now rebounding, Utilities are continuing to sell off. The annual dividend yield for the XLU is currently 3.35%, and price is down -24.8% from the mid-Sept. high. Some of the component stocks in this fund have even greater upside to their recent highs. In my view, this is still a buying opportunity even though I do not know when the bottom will be in for this downtrend.
5 yr. Weekly Price Chart of the XLU (author, using TDA 'thinkorswim' platform)
One disadvantage of just buying the index (or any index) is that it is a "continuum of performance," as I have written about before. Not only do sectors rotate regarding relative performance to the S&P 500 itself, but the stocks within each sector represent a continuum of performance For the Utilities sector for the past 12 months, while Dominion is down -42%, PCG is up +31% on price. So trading individual names gives me the opportunity to consider the price movement of any individual stock.
Final Thoughts
Utilities have traditionally been a reliable defensive sector investment. In recent months Utilities stocks have sold off while other sectors in the S&P 500 have rebounded. This presents a great opportunity in my view to enter these names, collect reliable dividends, and realize price gains of up to 40% when the sector rebounds. With the new allocation of funds to Utilities stocks and related CEFs, this sector now comprises 31.1% of my total portfolio's cost basis. But as noted, the CEFs have other stocks than just Utilities. Using the TD Ameritrade Income Estimator tool, the 18 stocks and 5 CEFs will generate about $8.6k per year in distributions, or 13.6% of total portfolio income.
Despite current weakness, I already have closed 4 trades in the Utilities sector in 2023 for gains: ATO (+36.36%), AWK (+16.48%), RRC (+46.91%), and XEL (+17.85%). I previously loaded up on Utilities after the sector sold off in the early months following the COVID recession bottom, and in 2022 I sold positions in 15 Utilities stocks, with gains of >30% for 6 stocks ( CEG , SRE , ED , LNT, ATO, and AES) and gains of 20-30% for 6 others ( NI , ETR , BKH, CMS , DTE, and NRG). I don't know when the bottom in the Utilities sector selloff will occur, but expect it will be when interest rates stop rising. I expect that stocks in the sector will then rebound, as they have in the past after the sector has rotated to under-performing.
I hope that readers have found some ideas here of interest. Please do your own due diligence before investing in any stock or fund mentioned in this article.
Best to your investing/trading!
=Green=
For further details see:
Green's Portfolio: Focus On Utilities In July-August 2023