RRC - Green's Portfolio: 2023 Review And 2024 Outlook
2024-01-03 03:05:50 ET
Summary
- In 2023, my portfolio generated record levels of tax-free income from CEF and stock distributions. Profits from swing trades were good but less than the past 2 years.
- 2023 was a year of investing in underperforming sectors in expectation of future profits as interest rates are cut. All current portfolio holdings are listed.
- I emphasize the benefits of investing within a Roth IRA and discuss a technical analysis pattern for the S&P 500 as a trading guide for 2024.
Managing a retirement portfolio is a continuing process and there isn't necessarily anything special about the end of a calendar year, except perhaps taxes, but convention defines this as a time to assess progress and revisit plans for the coming year. My Green's Portfolio is an actively-managed Roth IRA account, rolled out here at Seeking Alpha in late 2017, the year I retired. Here I reflect on progress in 2023, changes along the way, and areas for focus for 2024. What I do is not necessarily a recommendation for others, but perhaps investors will find some ideas to consider based on my experience and the highlights I summarize for what I consider the keys to the success that I've had.
From the start my portfolio was defined as an actively-managed, dynamic mix of basically income investments and trading. The idea behind that was that I could accelerate portfolio growth compared to a more static portfolio approach of buying and holding a basket of stocks or funds. I am also relatively risk adverse and prefer simple strategies and tactics. While I have done simple trading of option premiums, I now am essentially a long-only trader. No margin, no shorting, no options.
My portfolio started in 2017 with about a $100k investment. It has grown more than an order of magnitude over the past 6 years, through rollovers from my retirement plan, income from stocks and funds, profits from swing/position trades, and overall price appreciation.
2023 Portfolio Summary
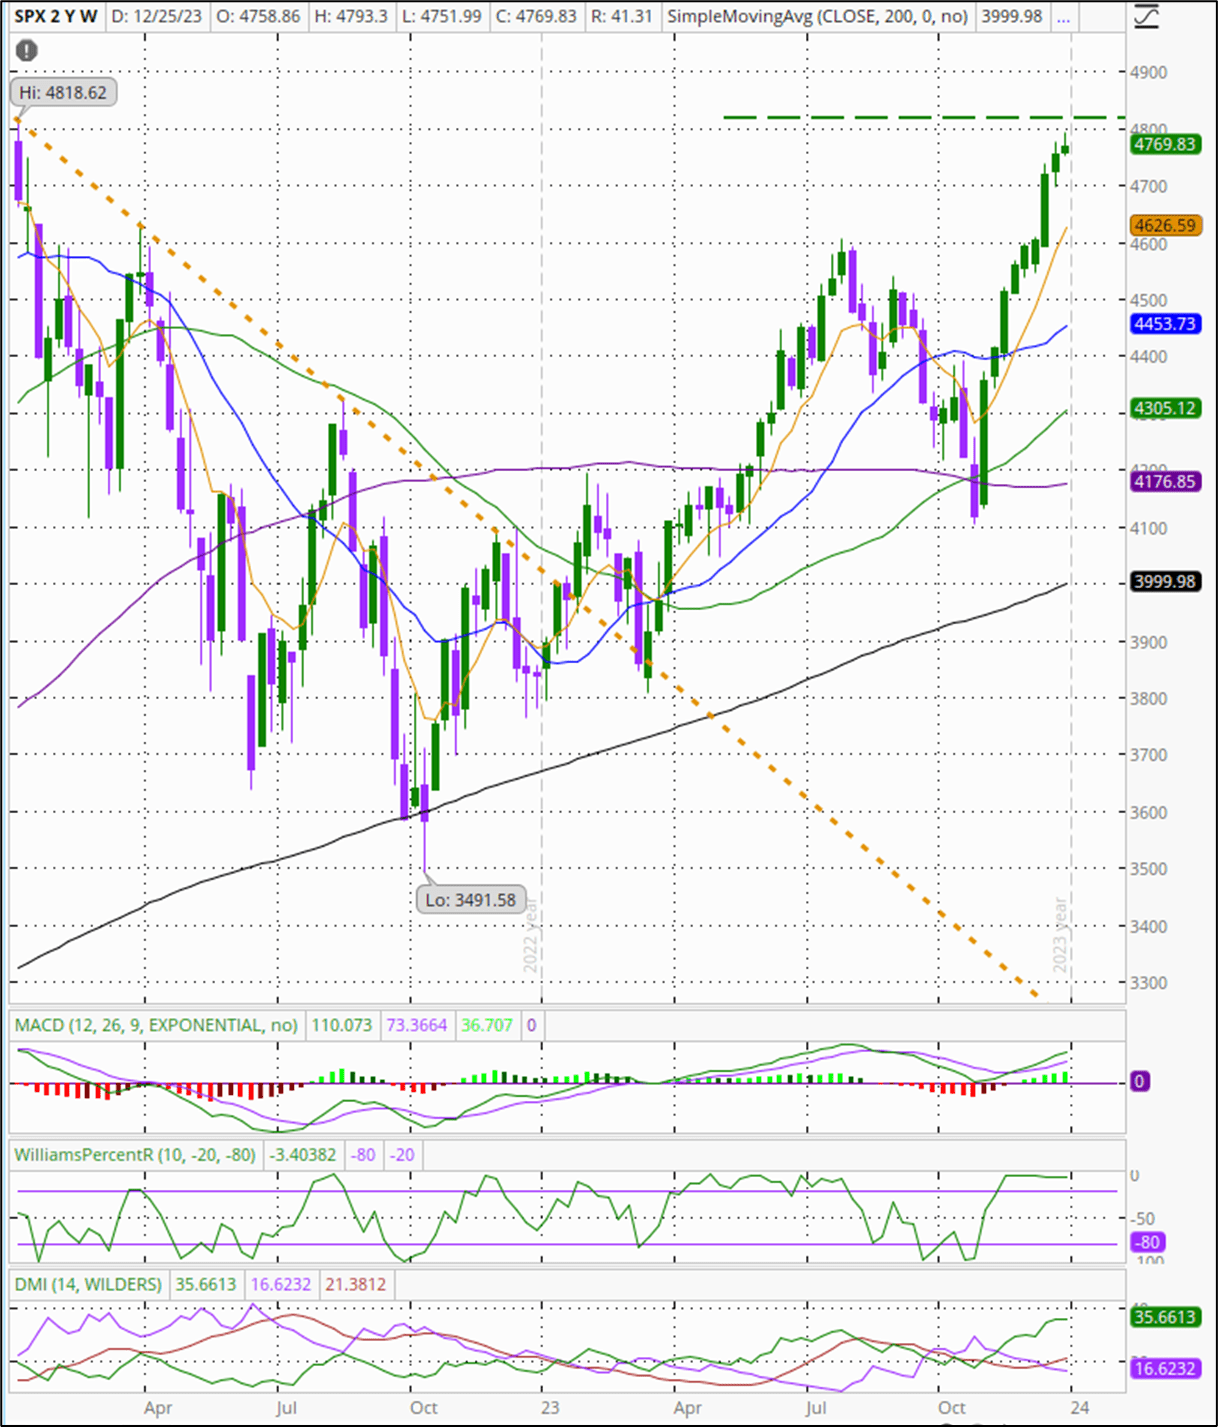
With a portfolio focused more on income than capital appreciation, I don't expect to match the returns of high-flying stocks that now dominate the S&P 500. While 2023 was a good year with the S&P gaining about 24%, it followed a miserable 2022, such that the 2 year gain was, well, not a gain. The index ( SPX ) is still just shy of the high just 2 years ago, with a loss of -0.48%. The 2-year weekly chart below of the SPX shows the roller coaster ride that occurred as a result of the 2022 bear market and the rebound now under way, on hopes for the end of interest rate hikes and for possible rate cuts in 2024.
2-Year Weekly Chart of the S&P 500 (Author, using TD Ameritrade 'thinkorswim' platform)
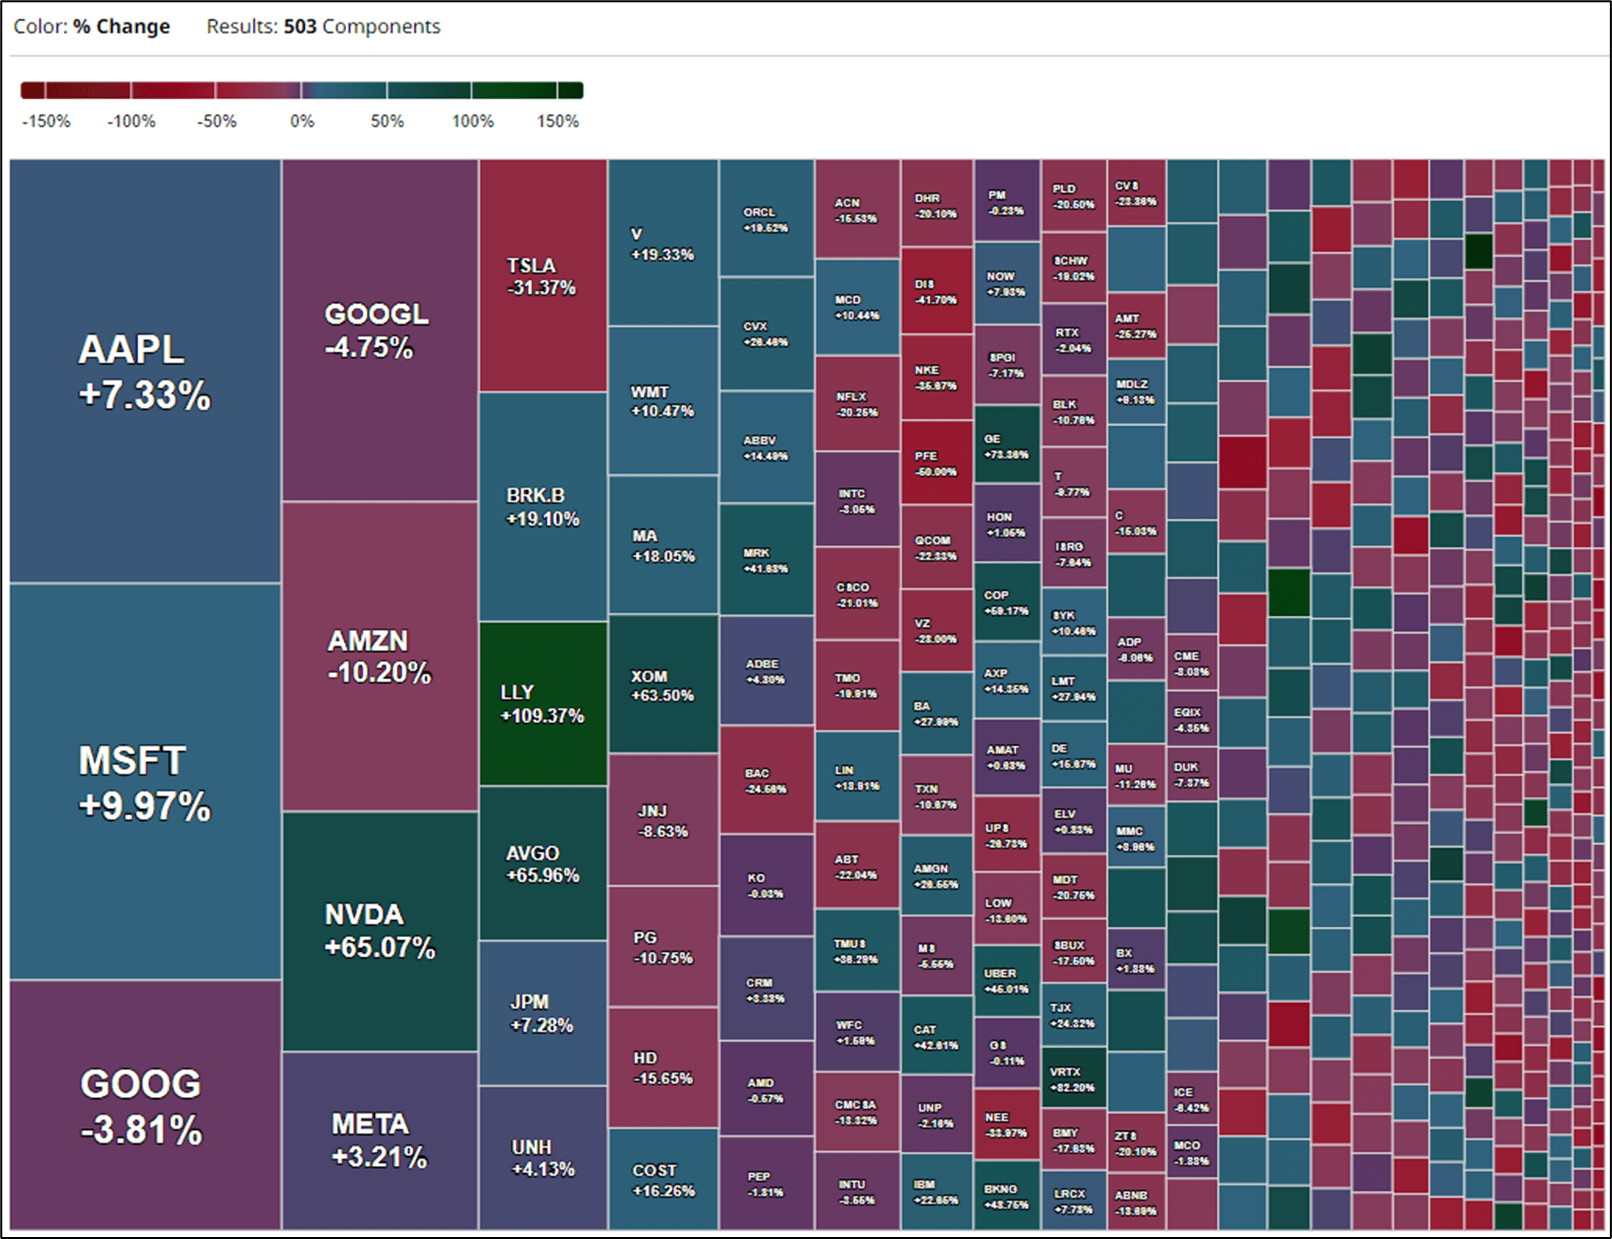
The 2-year S&P 500 gain/loss heat map below from Barchart shows some great gainers, such as Eli Lilly and Co. ( LLY ), Nvidia Corp. ( NVDA ), and Exxon Mobil Corp. ( XOM ), but the 2 largest cap stocks have only gained <10% over the past 2 years: Apple Inc. ( AAPL ) and Microsoft Corp. ( MSFT ). Among other big names, Alphabet ( GOOGL and GOOG ), Amazon ( AMZN ), and Tesla ( TSLA ) all lost ground.
S&P 500 Components Heat Map, 2022-2023 % Gains (Barchart.com)
In 2023 my total portfolio gain was +11.6%, but my 2 year return was only for a small net gain despite record trade profits in 2022. That's following the general market trend, but I have also been working to take advantage of the market weakness to build a portfolio that is providing a very high level of reliable income and that possess good potential for capital appreciation. I've bought stocks and funds loaded with under-performing sectors over the past 2 years such as Utilities (-10.9%), REITs (-22.12%), Health Care (-3.48%), and Financials (-4.02%). While not large components of my portfolio, 4 other sectors also lost ground over the past 2 years: Communication Services (-9.04%), Consumer Discretionary (-12.55%), Materials (-5.17%), and Consumer Staples (-4.89%).
At the close of 2023, my portfolio had 166 holdings, which is smaller than at many times during the past 2 years, when it at times exceeded 230. The reduction came as a result of a strategy that I focused on this year: concentration. I discuss this in more detail further on. My basic portfolio structure, however, has remained the same: a larger portion for high yield income and a smaller portion for capital appreciation through trading. That said, the two are not mutually exclusive. The income portfolio is comprised of Closed-end Funds [CEFs], which I greatly prefer over mutual funds or ETFs. The capital appreciation portfolio is comprised of individual stocks, mostly components of the S&P 500. For 2023, distribution income exceeded $59k, and this is growing steadily each year. I didn't close as many trades in 2023 compared to the previous 2 years and my trading profits were shy of those years as a result, but my 3-year average is >$44.3k. All tax-free in my Roth.
Closed-end Funds
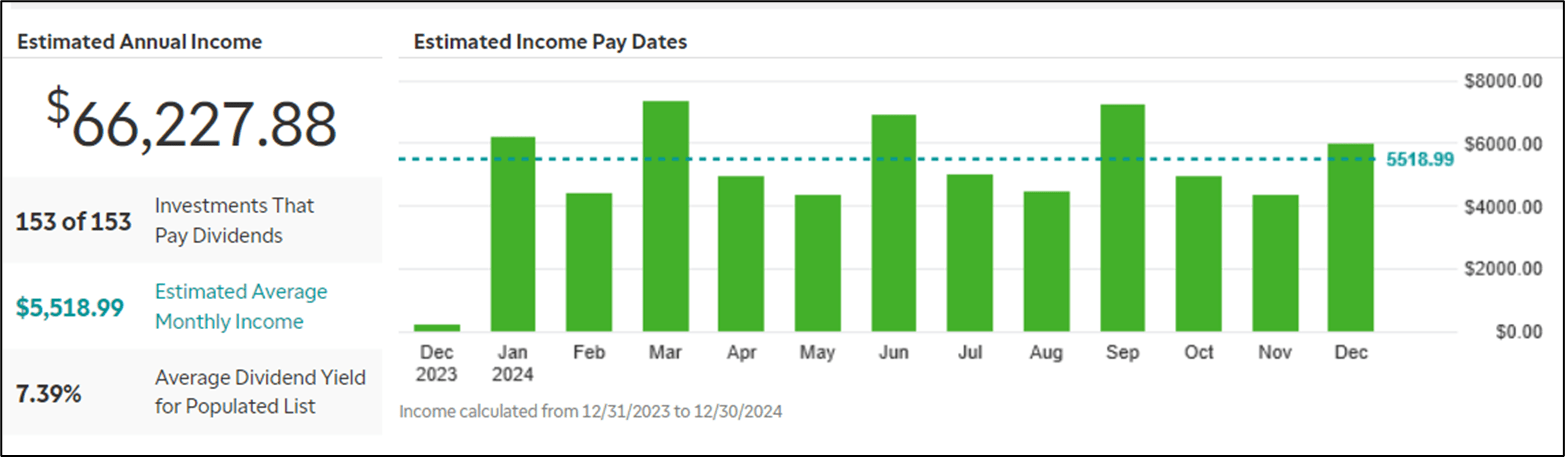
At the close of 2023, my portfolio holds 58 CEFs, which have a current average annual distribution yield of 8.62%. Using my TD Ameritrade Income Estimator tool, these funds will generate >$51k in tax-free distributions in the coming year, which is 77% of the total >$66k in portfolio distribution income expected for 2024. Total overall portfolio distribution yield averages 7.39% for 153 dividend-paying positions.
Portfolio Estimated Income for 2024 (TD Ameritrade)
CEFs now comprise 65.9% of total portfolio investment, with individual stocks at 32.9% and my cash reserve at 1.2%. While 58 funds seems like a lot, the investment is increasingly concentrated. The 10 largest funds now comprise 30% of total portfolio investment and 45.5% of all CEFs by cost. The 22.3k shares in these 10 CEFs comprise 48.2% of the total 46.3k shares in CEFs.
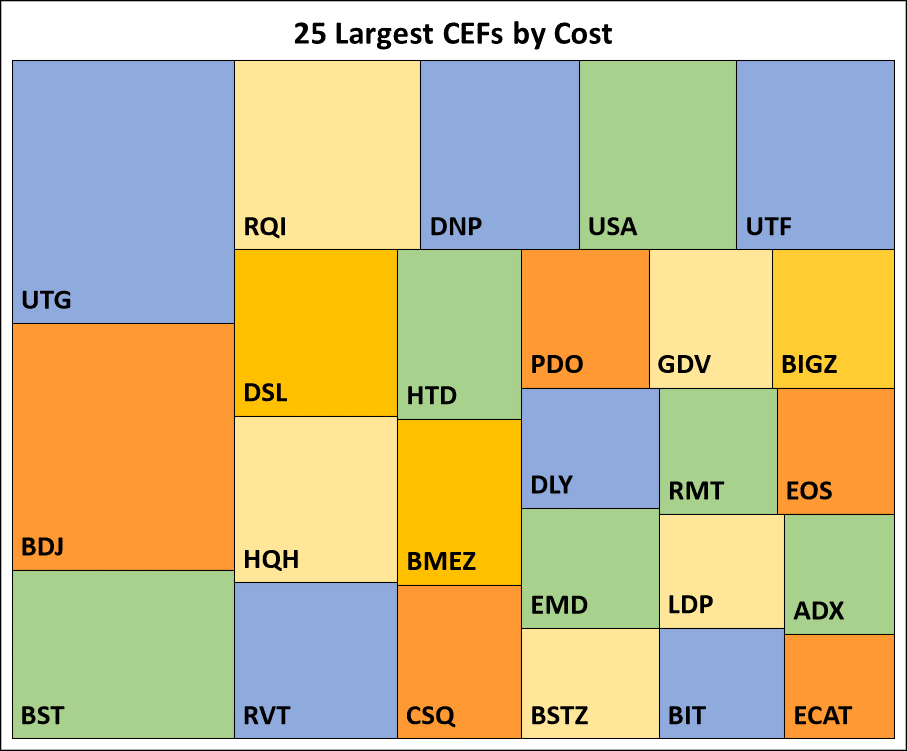
The largest 25 CEFs, shown in the graphic below, comprise 50.5% of total portfolio investment and 76% of CEF cost. They will generate about $38k or 58% of annual distribution income. My largest CEF holding is the Reaves Utility Income Fund ( UTG ), followed by the BlackRock Enhanced Equity Dividend Trust ( BDJ ), the BlackRock Science & Technology Trust ( BST ), the Cohen & Steers Quality Income Realty Fund ( RQI ), and the DNP Select Income Fund ( DNP ). As Utility stocks have been beaten down for much of the past 2 years, DNP (comprised of 70% Utility stocks) is trading at an historically low premium to its net asset value and at nearly a -3 Std. Deviation below its 15 year monthly mean. I added >1,300 shares to DNP in December alone.
25 Largest CEFs by Cost (Author)
Stocks
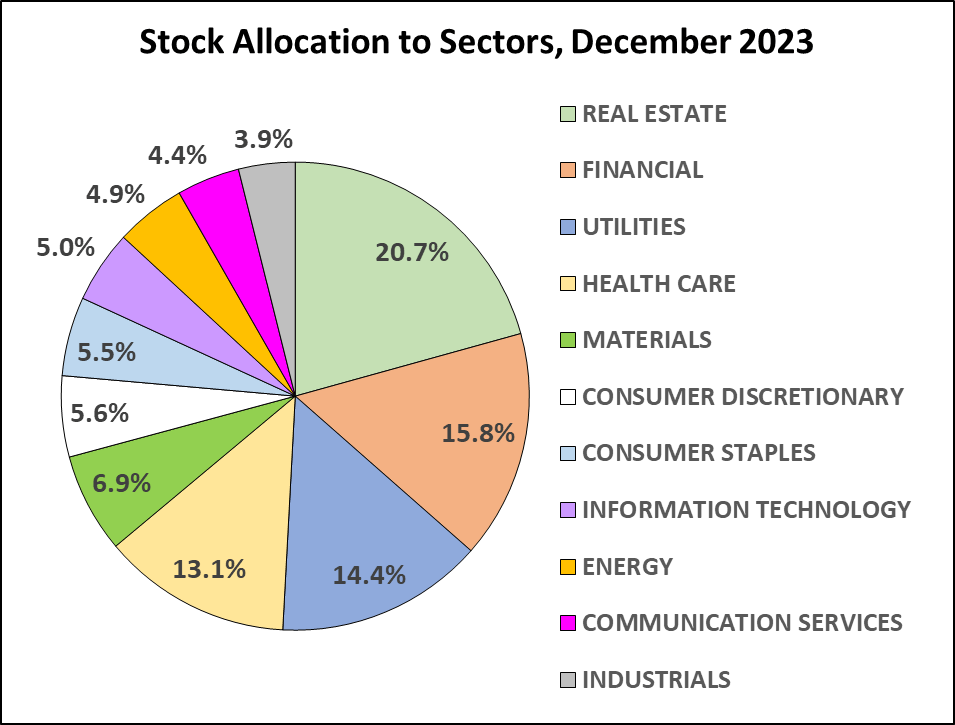
In addition to CEFs, my portfolio includes 108 individual stocks across the 11 standard economic sectors. Here, too, my holdings are concentrated. The allocation of investment to stocks changes constantly and has changed a lot over the past few years, but I now have 64% of stocks by cost in only 4 sectors: REITs, Financials, Utilities, and Healthcare. Whereas stocks in the IT sector are only 5% of my current portfolio, they were the largest sector in June 2022, at 22%. My current portfolio allocation for stocks is shown in the pie chart below.
Stock Allocation to Sectors, December 2023 (author)
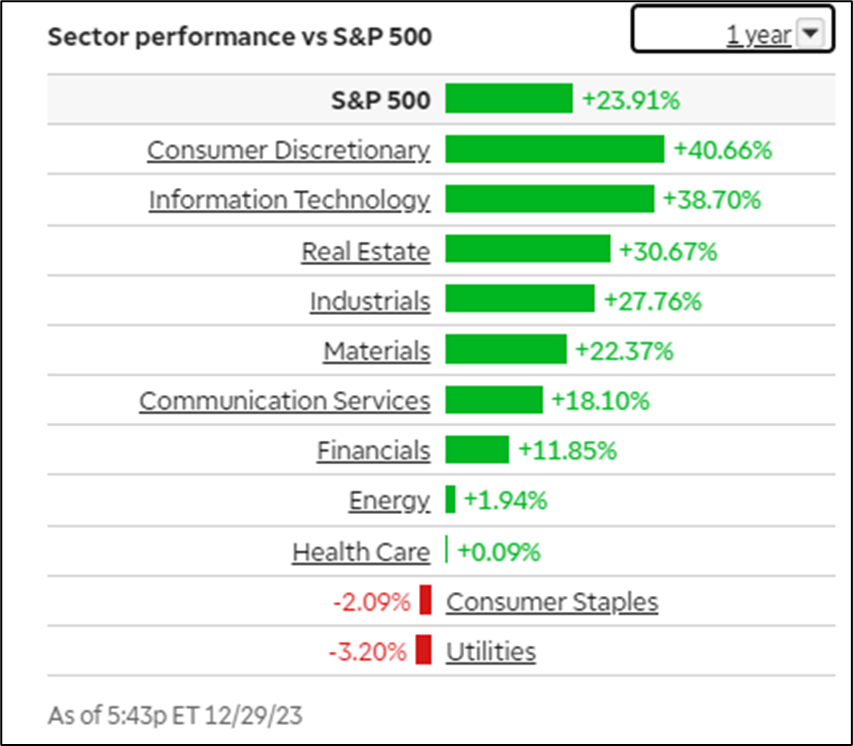
I tend to build concentrations as sectors rotate to relative under-performing compared to the overall S&P 500. So some sectors, such as Utilities, which are still beaten down compared to others, are still under accumulation. The 1-year sector performance summary graphic from my TD Ameritrade site shows how my portfolio concentration generally aligns with the weakest sectors. The greatest exception is my concentration in REITs, which I hold for their outsized income as well as that the sector was bottoming as recently as 3 months ago. Like Utilities, REITs are interest rate sensitive, and I expect major rebounds in all of these once rates are cut in the coming year and afterwards.
2023 Sector Performance vs the S&P 500 (TD Ameritrade)
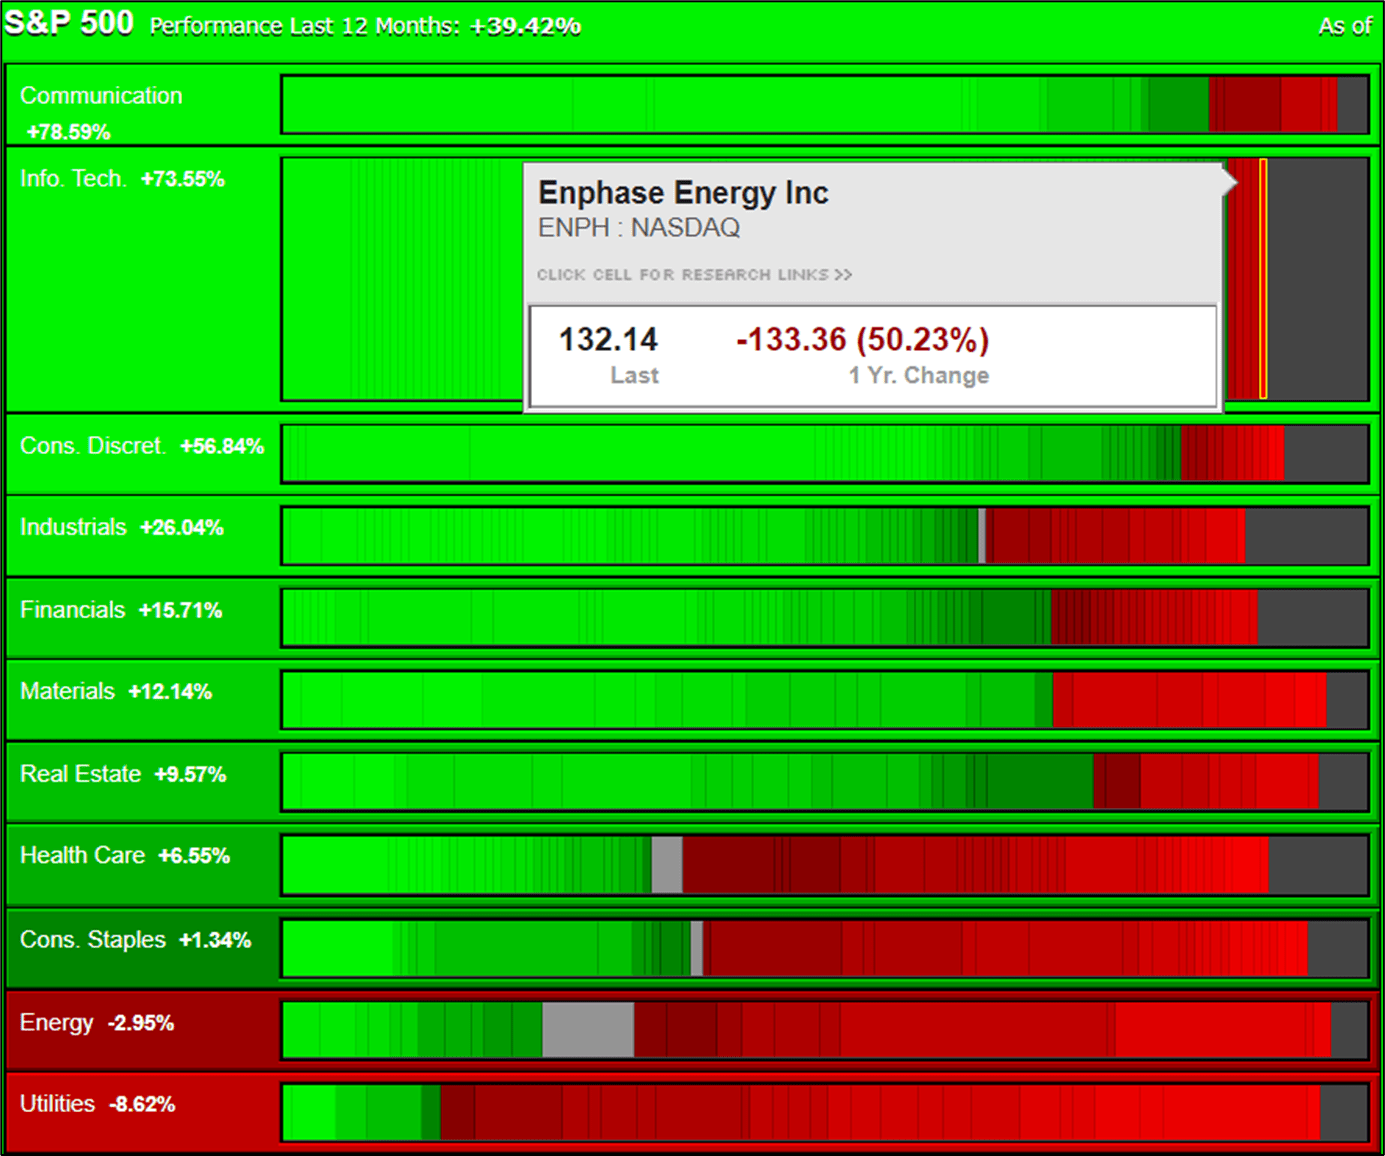
As I have described in previous articles, I prefer to trade stocks in the S&P 500, mostly because they are more likely to survive periods of weakness due to stronger fundamentals, they are more liquid for trading, and they often pay dividends while I wait for prices to appreciate. I use my TD Ameritrade sector heat maps to identify the weakest performers in the weakest sectors. The graphic below is for the S&P 500 index by sector performance for 2023, with Enphase Energy ( ENPH ) in the IT sector highlighted to show the type of summary data that is seen for each bar along the chart. As I have said before, the market is a continuum of performance, and I rely a lot on sector rotations to identify the under-performing stocks in the under-performing sectors as my trade candidates. I often use this simple graphic in lieu of other screener tools.
1 Year S&P 500 Sector Performance (TD Ameritrade)
For 2023, Utilities have been the laggards and I now hold 16 of the 30 stocks in the S&P 500 index, including the 8 weakest: AES Corp. ( AES ), NextEra Energy Inc. ( NEE ), Eversource Energy ( ES ), Dominion Energy Inc. ( D ), Ameren Corp. ( AEE ), Evergy Inc. ( EVRG ), Exelon Corp. ( EXC ), and American Electric Power ( AEP ), as well as 8 others in the index: Xcel Energy Inc. ( XEL ), WEC Energy Group Inc. ( WEC ), Entergy Corp. ( ETR ), Alliant Energy Corp. ( LNT ), DTE Energy Co. ( DTE ), Duke Energy Corp. ( DUK ), Consolidated Edison Inc. ( ED ), and Southern Co. ( SO ). My portfolio now also includes others not in the S&P index: Black Hills Corp. ( BKH ), Brookfield Renewable Partners ( BEP ), National Fuel Gas Co. ( NFG ), OGE Energy Corp. ( OGE ), UGI Corp. ( UGI ), and Essential Utilities Inc. ( WTRG ). I've traded other names in the index in the past ( ATO , CEG , CMS , CNP , EIX , NI , NRG , PNW , and SRE ) and would re-open positions for any of these that dip to new 2-year lows.
Throughout the years, if a stock or fund appreciates a lot in price, I tend to sell or at least trim some shares. The sector strategy has worked well for me. In 2022, I traded 4 Utilities stocks (CEG, EXC, ED, and LNT) all for 35-52% gains, and in 2023 traded NRG, ATO, and XEL for 18-36% gains. If the stock later sells off, I will often trade it again. As I have written before, I am an incremental trader, so I often buy and sell relatively small numbers of stocks and funds for each trade as prices drop or rise. With a large portfolio I'm managing risk, and diversification is not an objective, per se.
Trades
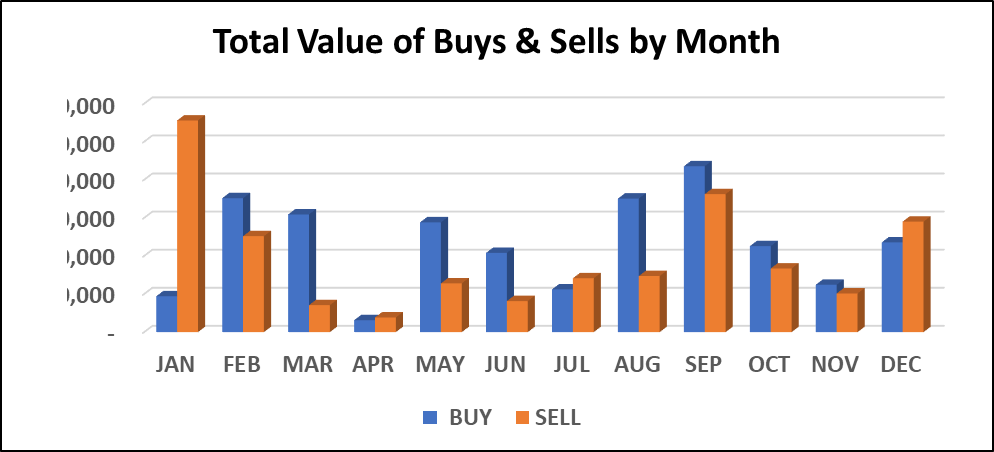
My incremental trading approach is not for everyone, but I enjoy the challenge of the markets and earning about companies. My active management means that I'm exhibiting that "high touch" that many investors pay-up for when they use professional managers. In 2023 my buys and sells, combined, nearly totaled half of my entire portfolio value, but the net difference was only about 4.2% of portfolio value. The chart below of monthly buy and sell activity shows how this happens. When this works well, I'm buying more, incrementally, when prices dip and taking profits when prices rip. In the past, I would like to see profits in the 20-30% range, but this is only a guideline.
Total Value of Trades for 2023 by Month (Author)
In 2023 I closed 96 stock trades for a mean weighted gain of +12.8%, not including dividends. Of those, 5 trades were for smallish losses (weighted mean of -4.0%) and 91 were for a mean weighted gain of +13.1%. Four of the 5 losses (mean -$37) were for some shares from long-held CEFs that I sold to raise some cash, and the dividends over the years far exceeded the small loss of capital.
For the set of winning trades, 5 were of long duration (>1 year) with a weighted mean gain of +10.3%, 48 were held for <1 year for a weighted mean gain of +18.1%, and the other 38 were "multiple" term trades for a weighted mean gain of +10.7%. In most cases, my mind set for trades is that I'm just trying to capture profits for a price trend that I think has played out or that is good enough for the time in the trade. It seldom has anything to do with thoughts that the companies are no longer good, profitable, or whatever. It's just a trade to raise cash for another "better" (hopefully) profit. The objective is to grow the bottom line in realized gains terms. I have traded some names two or three times in as many years depending on price trends.
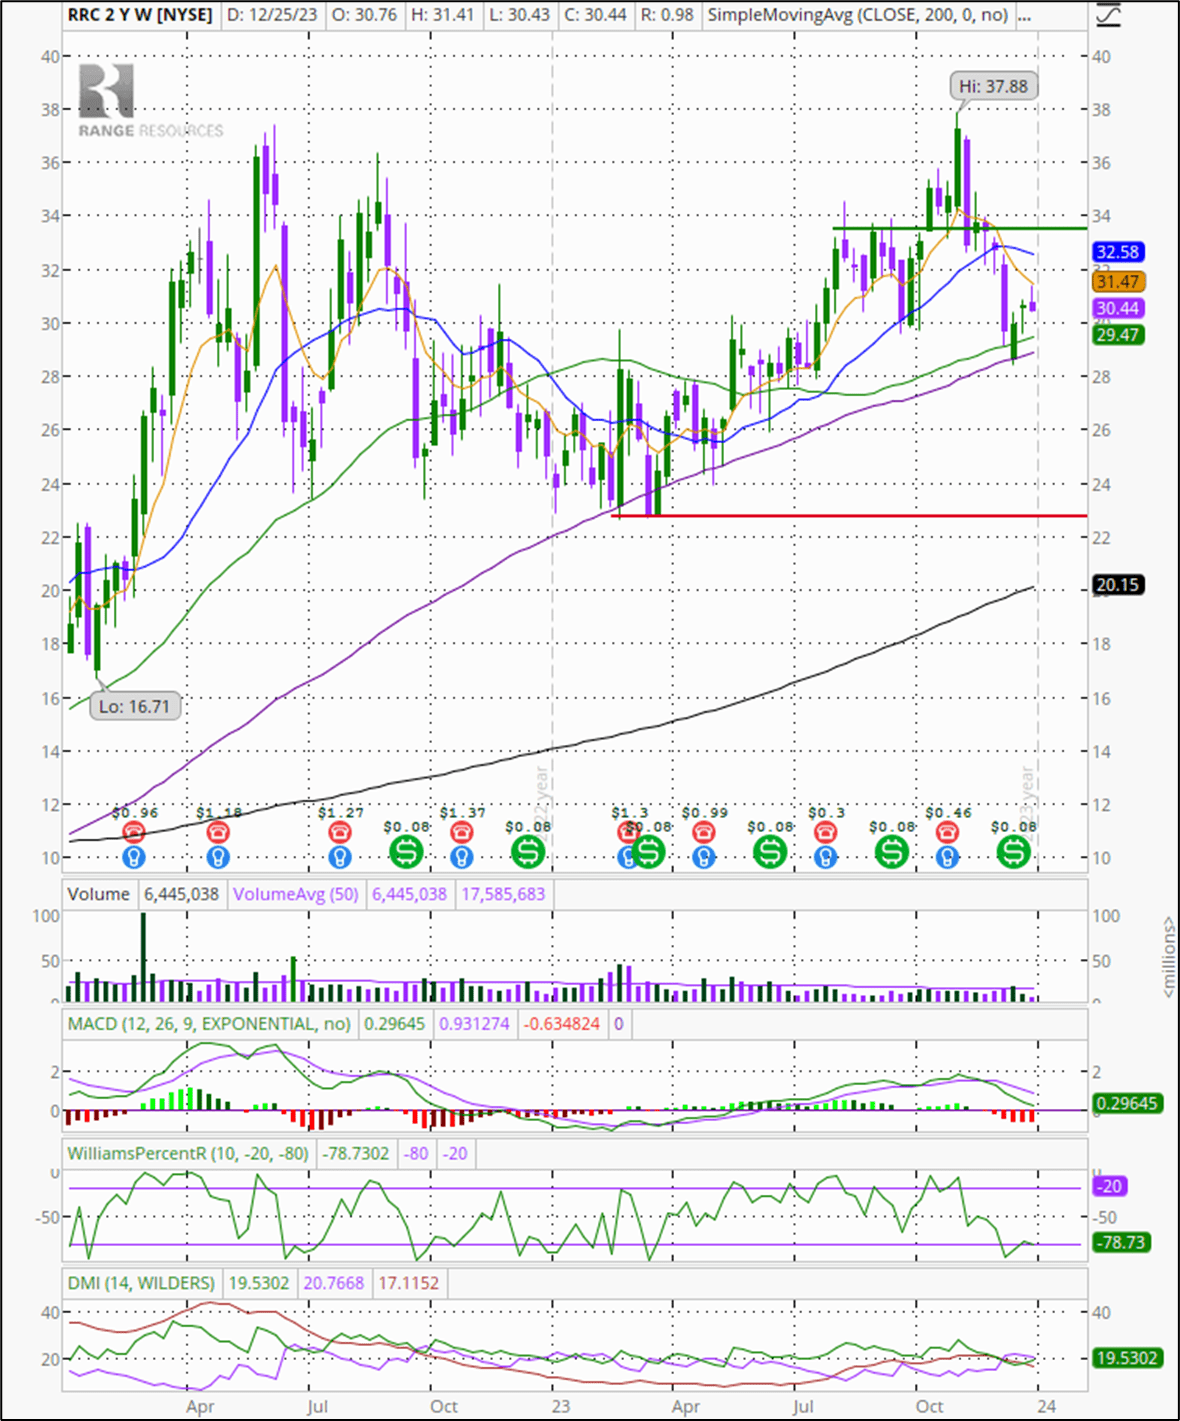
One good example of my trading style is for my trade in Range Resources ( RRC ), shown below using a 2-year weekly chart. I opened the position on February 21 at an average cost of 22.80 (red horizontal line) after RRC broke support at the 100 week moving average, and following a choppy selloff from mid-2022. The stock started gaining again and I sold on August 7 (green horizontal line) at 33.50 after the move was getting extended short-term. The gain, not including dividends, was +46.9% for 167 days in the trade, or +70.5% annualized. Nearly 5 months after exiting the trade, the stocks is now lower. In this case, as many times, I did not catch the high pivot when I exited.
2 Yr chart for Range Resources (author, using TD Ameritrade 'thinkorswim')
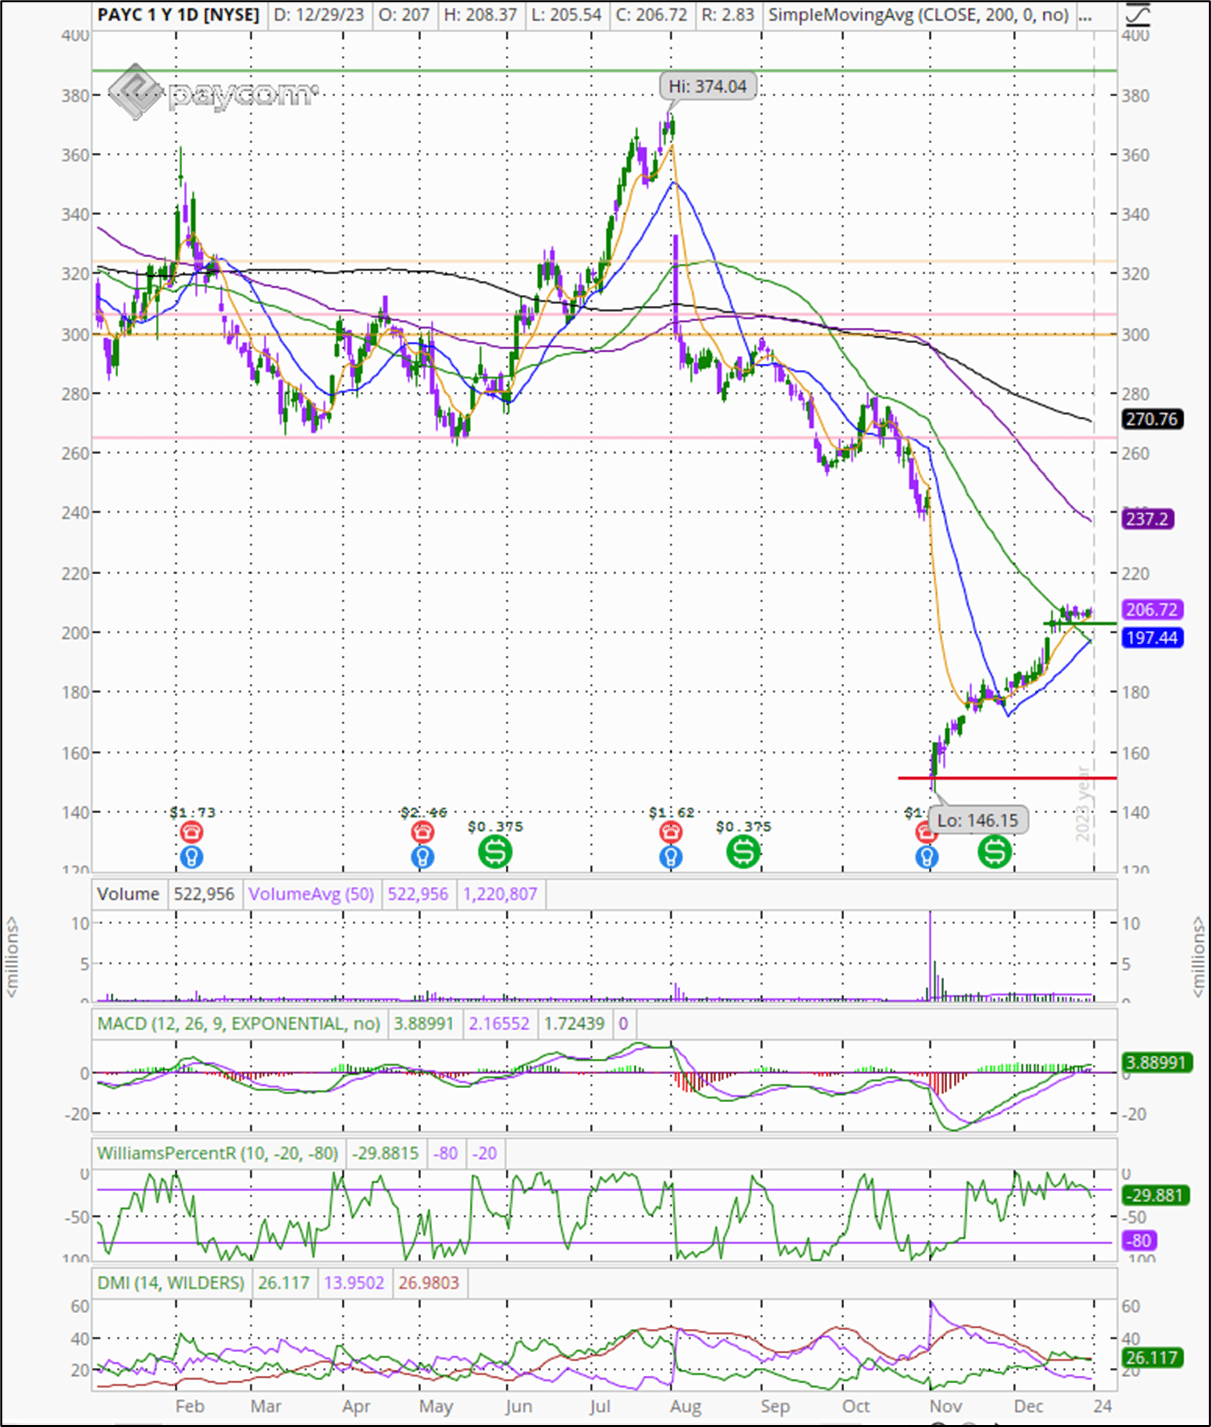
For another example, one of my favorite trade setups is a huge gap down after an earnings event. Here I use a 1-year daily chart, my most common chart view. I bought shares of Paycom ( PAYC ) on November 1, 2023 at 301.40 after an earnings selloff and sold the stock on December 18 at 405.24 for a gain, not including dividends, of +34.45% for the 47 days in the trade (+183.98% annualized). Investors often seem to over-react to earnings events, and in this case the stock started gaining the next day, on higher volume. Paycom is now trading sideways and I am happy to pocket the profits regardless of whether the stock continues to climb. I often feel comfortable trading stocks like PAYC, a S&P 500 Industrials sector stock, when many others no longer want to own them.
1 Yr Chart for Paycom (Author, using TD Ameritrade 'thinkorswim')
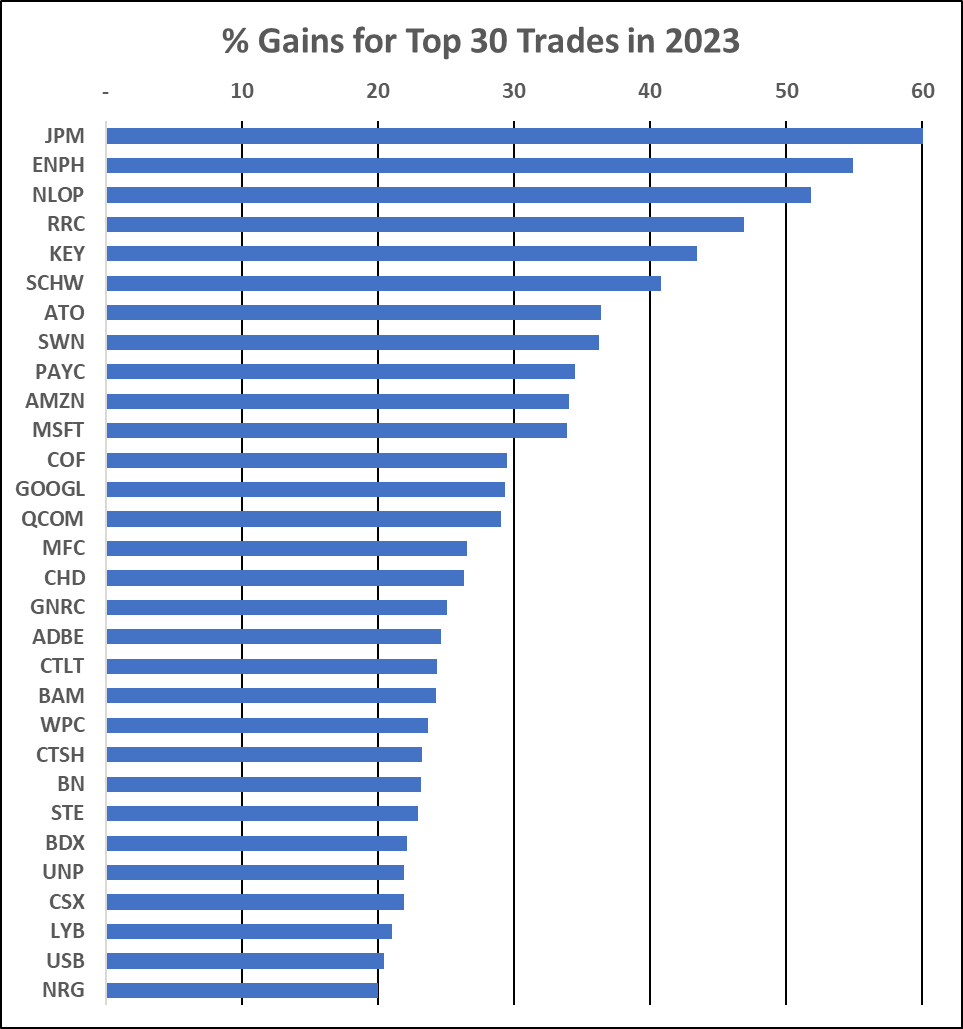
Overall, compared to the past 2 years, my trades for 2023 were fewer and less profitable. Given that the overall markets have been only more or less flat for the past 2 years, this is not of concern. That said, there were some nice trades, with the largest (for JPM ) at +60.1%. The graph below shows the tickers for the top 30 trades with gains >20%, which had a weighted mean gain of +27.2%. Annualized gains were higher as 20 of these 30 were short-term trades.
% Gains for Top 30 Trades in 2023 (Author)
Current Portfolio
With an active portfolio of 108 stocks, space does not permit any detailed discussion of the holdings, but I list the tickers below by sector and by cost of investment. Regular blogs are no longer allowed by Seeking Alpha, but they have been kind to allow my former blog to continue for the past 2 years, and I provide daily updates for any buys and sells. I will post a link to that soon.
CEFs - The top 25 CEFs by cost were shown in the graphic previously. The other CEFs currently in the portfolio are: HYT , JPC , THQ , BCAT , PDI , CPZ , BOE , KIO , QQQX , CHW , GBAB , AOD , AWF , EVT , TPZ , HPS , DFP , BUI , CCD , ETY , TY , NPCT , STEW , AIO , KF , BCX , RNP , EOI , ETG , ETO , FFA , MEGI , and GAB .
Real Estate - The 16 REITs by cost of investment are: EPR , UHT , MPW , LTC , O , NHI , CCI , NNN , GOOD , DOC , DBRG , VTR , HR , WPC , ONL , and PLD .
Financials - The 14 Financial stocks in the portfolio, including one preferred stock, are: WU , HASI , MKTX , PYPL , GPN , BPYPM , BXMT , FIS , PFC , LADR , FNMA , BNS , TD , and USB .
Utilities - The 22 Utilities sector stocks were listed previously.
Health Care - My portfolio currently holds the following 14 Healthcare sector stocks: PFE , NVAX , BAX , MDT , TFX , PRGO , BIO , RARE , VTRS , XRAY , INCY , ABT , BMY , and GEHC .
Materials - There are currently 8 Materials sector stocks in the portfolio: SMG , SEE , IP , FMC , BALL , MOS , ALB , and CTVA .
Consumer Discretionary - Five stocks in this sector are in the portfolio: LEG , PENN , MHK , WHR , and JOUT .
Consumer Staples - My portfolio now has 9 Consumer Staples sector stocks: CLX , WBA , TSN , HRL , CAG , NHTC , GIS , KMB , and ADM .
Information Technology - My portfolio has 5 stocks from the IT sector: GLW , UPLD , IPGP , DOCU , and TXN .
Energy - I currently hold 6 Energy stocks: SWN , PBA , TRP , DVN , ENB , and EPD .
Communication Services - Five communications stocks are components of the portfolio: VZ , WBD , BCE , TGNA , and TU .
Industrials - My portfolio holds the following 4 Industrials sector stocks: MMM , SWK , G , and GE .
Readers are reminded that these are stocks that, when purchased, had mostly under-performed the others in their sectors and which were selected as candidates for swing trades. Although some are currently profitable, the unweighted mean unrealized loss for the 166 stocks across these 11 sectors is currently -10.9%, and the weighted mean is -18.5%. This is fairly representative of the portfolio since its inception. Fortunately, most of these companies pay dividends and buying low results in a higher yield on cost, so I get paid while I wait for stocks to rebound.
My portfolio is growing steadily by earning income from high yield funds and stocks bought on sale, and taking profits from swing trades. But another strategy has helped grow my portfolio and its cost basis, tax-free.
Saying Goodbye to the Tax Man
The core structure for success in my view is the lesson I learned from the popular tax guru, Ed Slott, and written about by many other investment professionals: invest within a Roth IRA if possible. A good chunk of the early growth of my portfolio was from rollovers from my 457 retirement plan. I saved additional money to pay the taxes up front, but limited the amount each year so as to not eat into the principal of the withdrawal and to stay within my pre-rollover tax bracket. It took 5 years to complete my 457 rollovers. For my last, smallest rollover for 2023, I was able to do an internal transfer of stocks that were already in a traditional IRA. I also was eligible to continue to make annual contributions and I've done that each year since retirement.
Once done, the profits I earn on my investments are forever tax free and are something I can pass along to my beneficiaries tax-free, as permitted. If I were to invest money otherwise, outside a Roth, and grow profits, I would just grow my tax burden. Then those taxes get assessed through RMDs every year. Now in my Roth, no RMDs!
The original idea behind the tax deferred approach was that income would be lower in retirement. Many retirees are finding that this is not the case. And I do not believe that future tax rates will be lower than they are now.
As important, I find that investing inside a Roth account gives me the freedom to take advantage of what the market offers without worrying about time in the trade. The Roth allows me to be a trader and not a buy-n-hold investor because of concerns about paying short-term capital gains. Others will disagree and success has many paths, but this is my preference and style that I have developed over the years. Many stocks do not increase in price uninterrupted throughout the years, so trading allows me the freedom to "ride the waves." I have traded stocks two and three times in as many years. During the time that my portfolio has been active, we have seen the 2018 4Q correction, the 2020 pandemic recession, the 2022 1Q-3Q bear market, and the 2023 Aug-Oct pullback. That's a lot of volatility and opportunity to trade the ups and downs of the market.
I also manage taxable accounts and have definitely felt limited for taking profits when the calendar is on the short-term. Starting a Roth, if eligible, is the first advice I offer to investors, especially young folks who can benefit for many years of tax-free portfolio growth. I would also fund a Roth first before other tax-deferred schemes, or at least do some of both. The main idea is that time is on the side of investors if they can grow wealth tax free as early in life as possible.
Growing the Cost Basis of my Portfolio
After years of rollovers from my tax-deferred retirement plan, I'm now at the point where basically all portfolio growth has to come from earnings within. One strategy I've focused on in 2023 was concentrating my investment in CEFs, as I have explained. Fortunately, I do not need to make any withdrawals, so all profits can be re-invested. I play this 2 ways: with income and capital appreciation. Concentration of investment in CEFs brings in a continuing high level of money for new investment. Unless my favorite funds are on sale, I take the distributions and use them as a source of fresh money each month to expand the stocks in the portfolio. So the core idea is that my income is the tool to grow the cost basis of the portfolio. If the price of a top-tier fund such as RQI dips below my average unit cost, I'll add shares to that as well. Readers from my past articles know that I care little about shorter-term unrealized gains and losses. This is a long game and my objective is to keep buying stocks for swing trades or to hold them for income. Without new investment, I have >$66k in fairly reliable income to work with to buy new stocks or add to existing positions. And this does not include the realized tax-free capital gains from closed swing trades. Swing trade profits vary over time, but the most recent 3-year average is >$43k.
Expectations for 2024 and Beyond
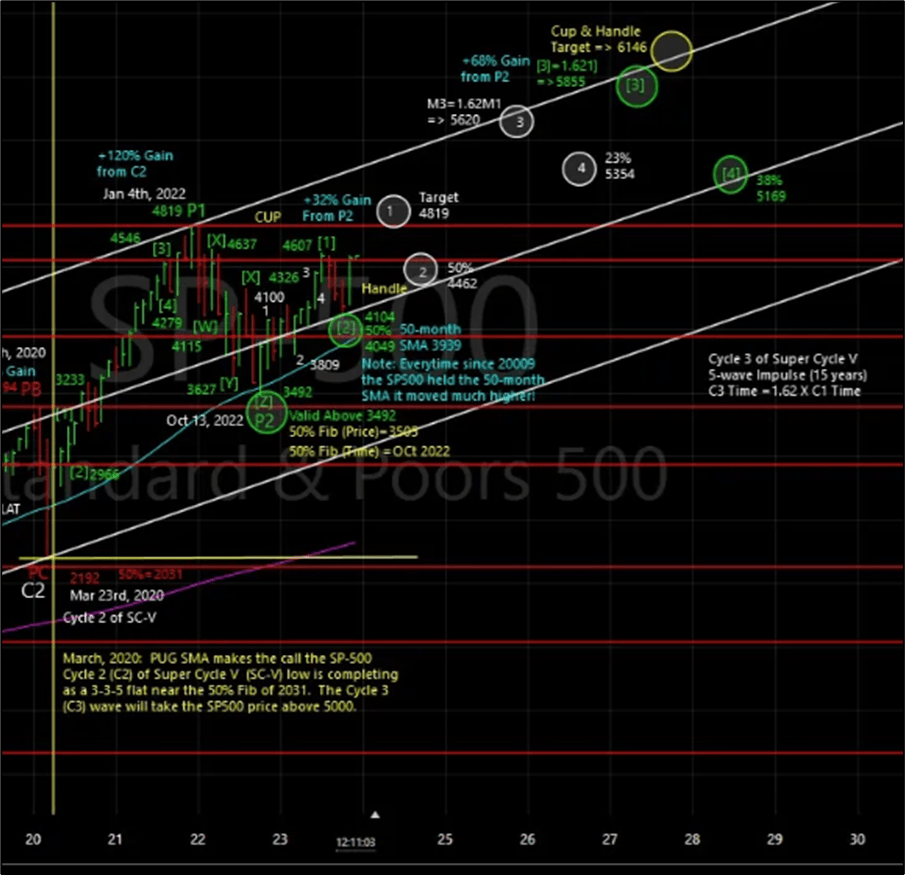
Readers of past articles know that I am intrigued by the idea of repeating patterns of stock price action across time, which I first learned about nearly 20 years ago. While I consider it a possible and not probable reflection of future price action, I've looked for current Elliott Wave practitioners where I think they have successfully worked out a long-term pattern for the S&P 500. In the past few years I have become more interested in the market pattern developed by PUG Stock Market Analysis, who has provided periodic free-access charts for the SPX. The current chart below, dated December 1, 2023 shows that the SPX is in the early stages of a Primary 3 (P3) up-trending wave within a longer-term Cycle. For very general patterns, Elliott Waves consist of alternating 5-leg impulsive waves and 3-leg corrective waves. These waves can sub-divide into lower degrees, such that Minor degree waves are subdivisions of Major degree waves, which are in turn subdivisions of Primary degree waves.
S&P Technical Analysis Long-Term View (partial) (pugsma.com)
The current PUG SMA wave pattern suggests that the current market uptrend, a longer-term Primary 3 wave, will complete in 2032 (labeled P3 in green on the full chart available on the PUG SMA website). Shorter-term, the SPX is nearing a Minor 1 target (white circle) probably sometime in early 2024 at SPX 4819. That would be a pivot top whereby the SPX would then experience a 50% Fibonacci retrace (Minor 2 wave) to about SPX 4462 sometime in the second half of 2024. A typical longer and stronger Minor 3 wave would then unfold, with a current price target of SPX 5620 in late 2025. Following another pullback for Minor 4 at SPX 5354, the final uptrend leg would complete Minor 5 and, simultaneously, Major 3 by mid-2027 at SPX 5855. The current free-access chart fits the historical price of the S&P back to 2007.
I don't follow lower degree waves that other practitioners use, but I have found these higher degree waves generally useful for what to expect. I often talk about any changes for these patterns on my trading blog. Readers have seen that I tend to start taking profits when the SPX (or SPY) approaches pivot targets, as now. I started writing about what turned out to be the 2022 bear market in February of that year. It lasted until mid-October, and I used that expectation of continuing downside after spring to my advantage for trading. I think it was responsible for making 2022 my most profitable year for swing trades.
Key Thoughts
The past two years have been challenging for the markets, and the next few may be similar if the PUG SMA technical analysis projection holds.
Most investors are not DIYers, and the degree of active management varies widely across even those who are. My style is focused on generating reliable, high-yield income from CEFs for about 60-65% of my portfolio investment, and generating additional profits through swing trading of mostly under-performing individual S&P 500 stocks. I want to capture realized gains and steadily grow the cost basis of my portfolio.
My incremental trading approach is not necessarily a recommendation for others, but perhaps readers have found an idea or two here for their use. Please do you own DD before making any investment decisions.
Best to your investing/trading!
=Green=
For further details see:
Green's Portfolio: 2023 Review And 2024 Outlook