PTZIF - Greenhaven Road Capital Main Fund Q4 2022 Investor Letter
Summary
- Greenhaven Road is a boutique hedge fund with the patience and confidence to step outside of the norm. Greenhaven Road Capital digs deep, searching in places rarely trafficked to locate the few hidden gems that will outperform a diversified portfolio of blue chips.
- The Fund returned approximately -4.3% net for the fourth quarter.
- In this letter, I want to highlight some areas where my views are different than those of other market participants.
- I know continued multiple compression and a recession are very possible and would not be positive. At the same time, multiples for small cap stocks are at or near lows not seen since the great recession.
Dear Fellow Investors,
The Fund [1] returned approximately -4.3% net for the fourth quarter. Returns vary by entity and class so please check your individual statement for actual returns.
While I believe our performance compares favorably on a three- and five-year basis, 2022 was a humbling year to say the least. I always believed that having a material down year would be inevitable if I managed money long enough, but the magnitude of the decline – especially when overall markets were more muted – surprised me. In retrospect, too many of our investments were small and “growthy,” still progressing along their paths to profitability, and correlated to interest rates. In 2022, we sustained the pain of our holdings’ multiple compression without any of the benefits of the durable growth they experienced.
As you all know, my family’s capital is invested alongside yours. Greenhaven Road has a steep hill to climb, and we deeply appreciate the steadfastness our investors have demonstrated in the face of this year’s volatility. To date, this January has been one of the best months we have had in years. In this letter I will go into a lot of detail on the companies we own, even including some arcane accounting (apologies in advance). What we own matters. The details matter. I do believe that time is our friend and we will ultimately be rewarded for our patience. While 2022 was a brutal year for the share prices of most of the companies we own, it was not a horrible year for the businesses. In fact, the progress was celebratory for several of our businesses.
In the depths of the recession after the Great Financial Crisis, I was so frustrated by the disconnect between market prices and my valuations that I started blogging with the theme of Fundamentals Matter, analyzing companies and highlighting their fundamental value. I ended 2022 with a similar level of frustration, which I now get to express in these letters to you. Smaller, misunderstood companies were an incredibly painful place to be during the risk-off multiple compression of 2022 because their fundamentals were not immediately obvious to enough market participants… or they just didn’t care. Over time, these fundamentals should come into clearer focus, and the core idea that fundamentals ultimately matter is a hill I am willing to die on. I think the fundamentals are on our side. I see them, I hope you see them, and, in time, I believe that Mr. Market should see them.
In the last letter, I outlined five characteristics that appear throughout our portfolio and I believe position many of our holdings well to withstand a weaker economy. As a reminder, they are listed below:
- Low Churn – Predictable/stable demand makes it easier to manage a company through a downturn, as it significantly reduces the likelihood of revenue falling off a cliff.
- Secular Tailwinds – Even in a recessionary environment, secular tailwinds can provide company-specific growth despite a shrinking GDP.
- Positive Product Lifecycle Dynamics – A combination of new products or products that are early in their adoption curve can provide growth, even in a weak economy.
- Operating Leverage – When combined with revenue growth, operating leverage should lead to accelerated profitability. We don’t own companies with broken unit economics that are growing for growth’s sake.
Instead, we own companies with strong unit economics that are scaling and, over time (as they hold down general and administrative, development, and marketing expenses), the companies’ profitability growth should exceed their overall growth rate.
- Strong Balance Sheets – None of these companies are reliant on the markets to fund their operations. They have years of cash to operate and are either profitable or quickly approaching profitability.
These favorable qualities are particularly attractive when facing the prospects of a weakening economy. To be clear, a severe recession would not be good for our holdings. But even in a recession, I believe that low churn, secular tailwinds, positive product lifecycle dynamics, and operating leverage should position our companies to still grow, just at slower rates.
LOOK DIFFERENT / SEE DIFFERENT / THINK DIFFERENT / DO DIFFERENT
In this letter, I want to highlight some areas where my views are different than those of other market participants. For the past year, investing in misunderstood companies has been a painful exercise, both mentally and financially. That may persist, and in some cases I may just be wrong… only time will tell.
A little context may be helpful.
For the past several years, we have been in a particularly strong period of increasing flows to passive strategies (primarily indexing), and it is now quite common to see the five largest holders of a company include Vanguard and BlackRock, both of which algorithmically buy or sell based on index inclusion or money flows with no regard to company fundamentals. In addition, the “sell-side” research firms have responded to their own declining revenues by increasing the number of companies covered per analyst, likely leading to gaps in both domain knowledge and attention. Currently, none of our holdings are in the S&P 500 and many are not even in the Russell 2000. I believe that there are opportunities in these nooks and crannies because so much trading volume is passive and the large brokers lack focus and resources.
Let’s look at one of our largest holdings: PAR Technology ( PAR ). We can consider the analysis by a 163-year-old bulge bracket sell-side research firm as a proxy for how the company is analyzed broadly. After ignoring PAR for several years, the firm in question was effectively obligated to initiate coverage after underwriting a convertible bond offering. With a $27 price target and a neutral rating, this bank is decidedly not excited by PAR.
While we own PAR for their enterprise software business, the company has three revenue streams: a government contracting business, a hardware business, and a software business. I am not sure which analyst coverage universe is most appropriate, but PAR was assigned to the Payments and Digital Assets analyst who covers approximately 25 companies, including Mastercard, Visa, and Charles Schwab. (Note: Payments represented 0% of PAR’s revenue when he initiated coverage).
From what I can tell, sell-side analysts have two goals. The first is to predict revenue and earnings, typically in the same format in which the company announces its results. The second is to present the information in their own firm’s framework. As research has been standardized, many firms use a set of ratios for all companies (P/E, etc.) as well as a standardized balance sheet, income statement, and cash flow statement. This approach yields a consistent, standardized research process and product, but it can also create blind spots, especially as each analyst is being asked to cover an increasing number of industries and companies in the face of dwindling research budgets.
On PAR’s last conference call, the CEO laid out a credible path to dramatically improving the software business’ profitability by holding its expenses flat while growing revenues. While I was ebullient, the sell-side was “meh.”
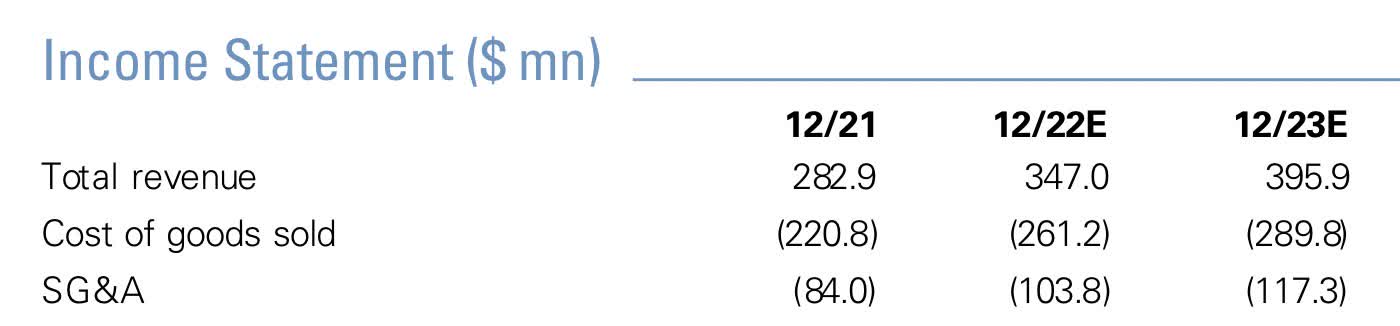
The aforementioned analyst’s projections and models are for PAR as a whole, looking at the company’s revenue in aggregate and reporting it as such in the firm’s standardized template. As you can see in the table below, when PAR’s 3 business lines are consolidated, the numbers do not look very appealing.
PAR’s combined 2023 growth numbers are fine, growing the top line at 14%, but the overall company is still losing money. Without a more granular analysis, it hardly seems a place to put a significant portion of my life savings or yours. When you combine the constraints of a standardized sell-side firm’s model and the fact that PAR reports its numbers in a way that camouflages the underlying economics of its enterprise software business, a divergence of views can emerge.
My approach to looking at PAR is different. I don’t have the constraints of a standardized firm model, which is effectively trying to fit a square peg into a round hole. I also spend almost no time on the government business because I believe it is not a core part of their business and something they could (should) sell this year. As a crude overall calculation, I suggest that the government business + cash on hand + hardware = debt. Under this framework, all that matters is the enterprise software business, which I define as software revenue + support + payments. While sell-side analysts spend their time trying to estimate a quarterly earnings number down to the penny, I spend my time trying to understand the growth trajectory, duration of that growth rate, and magnitude of the operating leverage.
Now, so far, PAR does not do itself any favors in its reporting methodology. They do not report a single enterprise software number that includes support and payments revenue, thus modeling the enterprise software business has been very difficult. And when you have 25+ companies to cover as an analyst, you are seemingly not equipped to back into the number on your own.
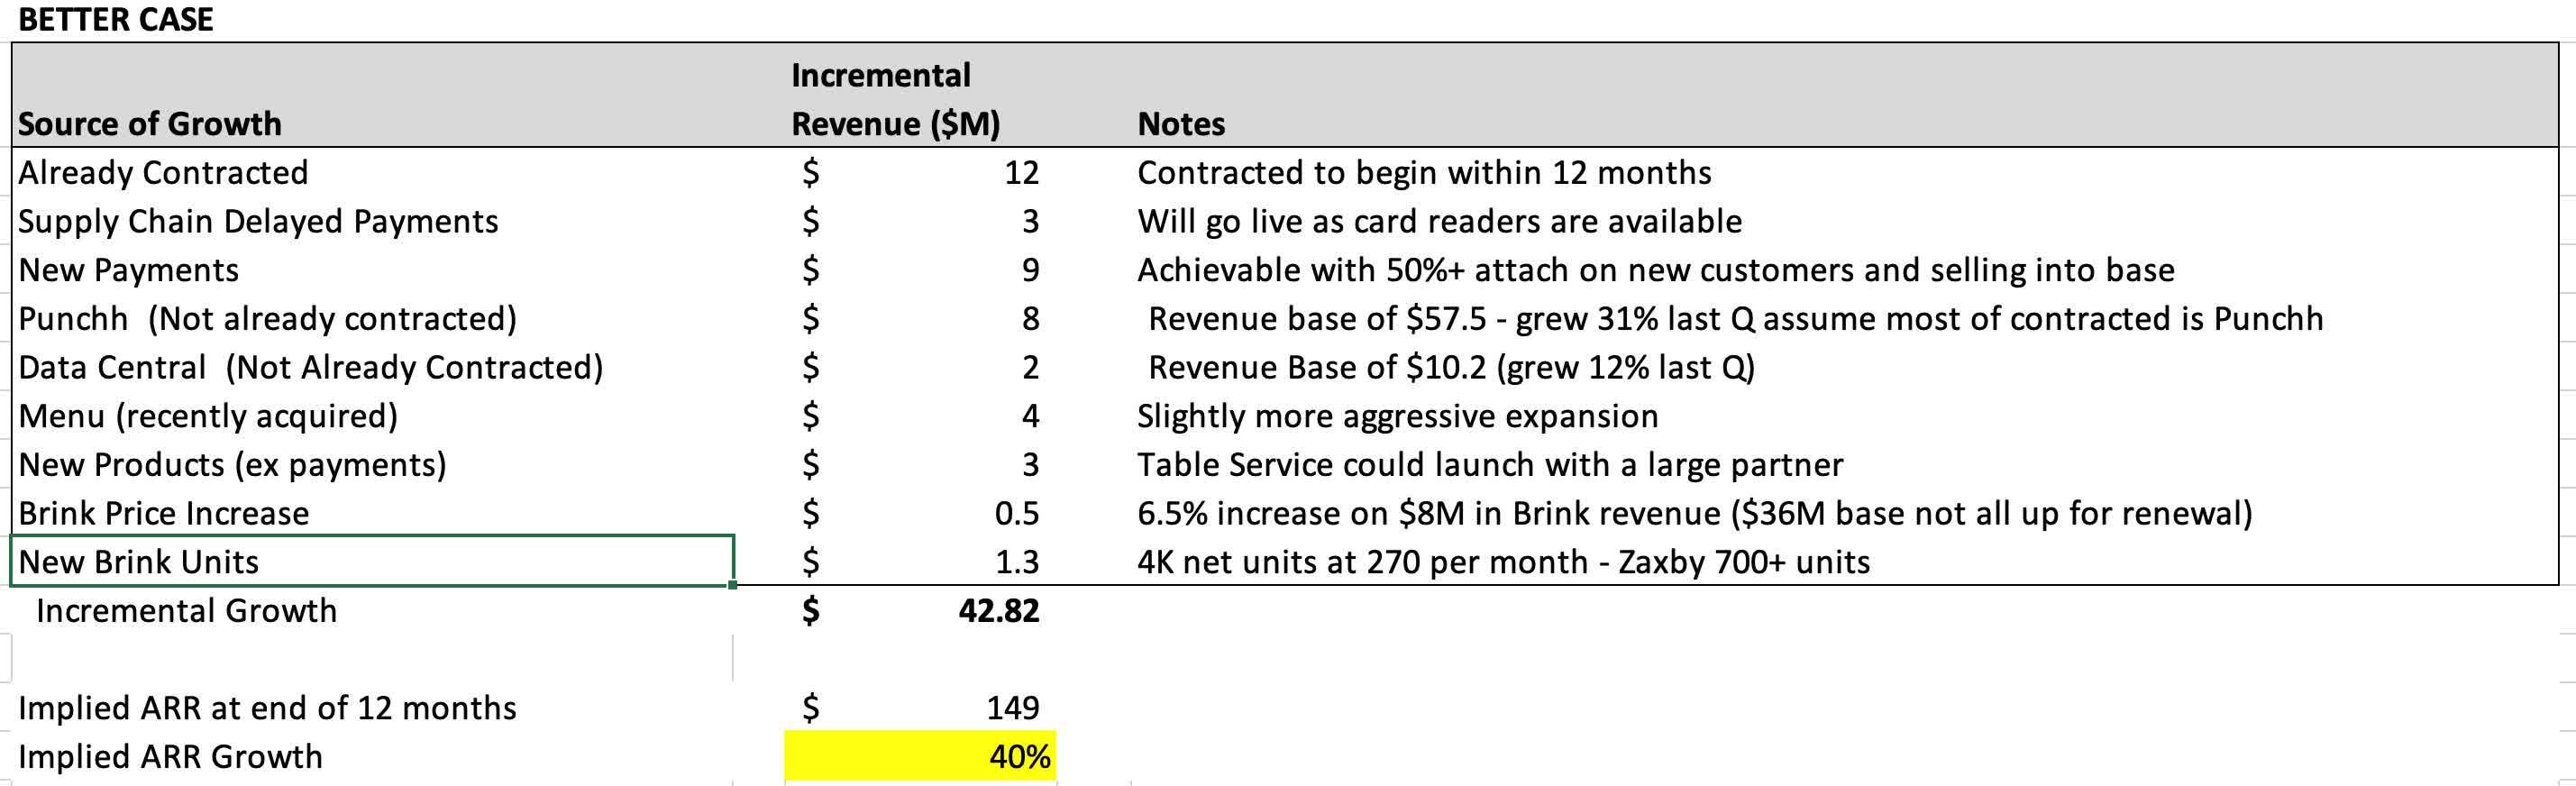
Fortunately, PAR does report Annualized Recurring Revenue ((ARR)) for the enterprise software business and, in my opinion, the growth of the ARR and the profitability of the software business are by far the biggest drivers of the company’s future returns. I am most interested in how much ARR can grow in the next 12 months. My “better case” model for incremental ARR over the next 12 months (below) has it growing from $107M to $149M.
The above implies software ARR growing at 40%. Could it be 30% in a recession? Sure. It might even be 20%, but I have high conviction that the software business is growing substantially faster than is evident in any of the sell-side reporting.
Even more impactful, PAR has said they expect to hold expenses for the software business flat in 2023. The impact of growing revenue by 40% and holding enterprise software expenses flat gets lost in a model that has software, hardware, and government expenses all lumped together. However, if you are focused on just the enterprise software portion of the overall business, the operating leverage (one of our five characteristics) is enormous, adding over 20% points of margin for the year. The enterprise software goes from losing money to making money, and, when analyzed separately, the software business ends the year as a Rule of 40 company. This typically comes with multiple expansion from the recent year-end 4.5X Annual Recurring Revenue ((ARR)). But, given what I believe to be the likelihood for sustained growth for the enterprise software business, we don’t need multiple expansion to compound our investment at high rates of return.
We got our head kicked in owning PAR last year, and you may be asking if any of this software stuff will ever matter. Will the market notice the changing economics or operating leverage? My expectation is that the company will change the reporting and thus force/help the analysts to notice.
Time is our friend here. The business is getting bigger, healthier, and more profitable, and, over the course of this year, PAR’s management will want a brighter and brighter light shining on the software business. So far, the breadcrumbs have been enough that the path can be seen, but only by somebody like me who parses the company like a religious scholar. In a year, it should fit into everybody’s standardized model templates, assuming private equity does not buy the company first. If you apply the multiples recently paid by private equity for the slower growing Coupa Software, you get a price more than twice as high for a company growing less than half as fast ( link) .
I also believe my view about Cellebrite ( CLBT ) is materially different than the market’s. As you may remember, Cellebrite is a former SPAC that sells software to government agencies to collect and review data from cell phones and computers. The company supports over 30,000 different configurations of operating system versions and phone types. Given the constant evolution of software, hardware, and encryption, customers need the most current version of Cellebrite’s offerings (low churn).
Cellebrite historically sold their software as a perpetual license with a large, one-time upfront payment and smaller ongoing support payments. Like many other software companies, they now are transitioning away from perpetual licenses to term licenses as doing so typically yields a higher lifetime value of the customer and a less lumpy business, which should be more attractive to investors. There is short-term pain, however, in forgoing the large one-time payments in exchange for a long stream. Given the low churn, critical nature of Cellebrite products, and their government customer base, they should do quite well getting off of the lumpy perpetual license treadmill.
One of the most successful transitions away from perpetual licenses to software-as-a-service ((SAAS) was Adobe ( ADBE ), which saw both higher lifetime value to their customers as well as a higher valuation multiple for its stock. Cellebrite’s customer base is different than Adobe’s; they deal primarily with government agencies, such as the FBI, DEA, and police departments. Many of these agencies still want to host their own software (“on-premise”) and because they traffic in sensitive data, they are slow to transition to the cloud. Under GAAP accounting rules, when a customer hosts their own software, a large portion of the revenue must be recognized up front.
This chart is my understanding of how revenue for a pre-paid three-year contract is recognized in the financial statements if a contract is signed on the first day of the quarter (slightly more muted if signed on the last day).
The chart is not reflective of how a customer is billed or how cash flows through the business, but simply what the arcane accounting rules dictate for representing on-premise software transactions. Notice the highlighted cells. For on-premise software, there is a large upfront recognition. The net result is that, when you are looking at Year 2 for the same quarter, it looks like an 87% decline in revenue year over year from $41 to $5. I agree that revenue recognition is one of the most boring topics in the world, but it is important to understand that in this case the accounting rules for on-premise software clearly distort the quarterly revenue picture.
Last quarter, Cellebrite’s overall reported revenue increased only 9% year over year (yawn). I am sure that the lackluster results are accurate under GAAP rules, but I believe that there is a large mismatch between GAAP reported results and the underlying business. The GAAP reported results have the company lapping a disproportionate number of large on-premise software contracts sold in Q3 and Q4 of 2021, creating difficult comparisons this year when those contracts are contributing 80%+ less revenue because of the accounting rules.
If we look at the revenue on a two-year basis, which smooths out a portion of this revenue recognition issue but not all the transition from perpetual licenses to term licenses and subscriptions, revenue has grown approximately 16% per year.
I believe that an even more accurate representation of the health of the business is the growth in annualized recurring revenue ((ARR)) . We own the business for the high margin, high quality (low churn) recurring revenue. The ARR is not as impacted by the accounting rules for revenue recognition. Unlike GAAP reported revenue, which grew 9%, ARR grew 36%. Over time, the revenue recognition and resultant “lumpiness” should dissipate as more and more agencies gain comfort moving to the cloud, the transition from perpetual ends, more adopt a pure SAAS model, and more on-premise term deals are layered in.
Triangulating between the ARR, product pipeline, announced deals, and the potential for price increases, I believe that 20%+ growth is quite likely for an already profitable company. Additionally, I think it is highly likely that the company gets operating leverage, leading to margin and profitability growth as sales, marketing, and administrative expenses come down.
I ran a screen on Capital IQ for NASDAQ-listed software businesses that have the same characteristics as Cellebrite: profitable, valued at less than 3x revenue (EV/Sales), 75%+ gross margins, growing revenue 16% (the aforementioned twoyear growth rate) or higher. The result? Nothing. No other NASDAQ listed software businesses meet these criteria, and I think 16% growth is understated as well. Further, I believe Cellebrite is much higher quality than the average software company given their low churn, secular tailwinds, and a strong product portfolio.
There are worse things than owning a very high-quality asset with a very low valuation, but I do want us to get paid for this. Over time, the revenue recognition issue should diminish, the SPAC taint will diminish, and the company will get better at explaining their story. We should also benefit from continued growth and operating leverage, and it takes zero imagination for me to see the share price double. While this may sound overly optimistic, as I was writing this letter, Canadian competitor Magnet Forensics ( MGNT ) agreed to be bought out by a private equity firm. Magnet’s ARR is growing faster than Cellebrite 50% vs. 37% but on a much smaller base. The acquisition price was 9.5X 2024 ARR vs. approximately 2X for Cellebrite, or ~4X its current multiple.
This theme of LOOK DIFFERENT / SEE DIFFERENT / THINK DIFFERENT / DO DIFFERENT is evident in many of our holdings. In the appendix to this letter, I outline two new holdings (Patrizia and Clarus Corp), which both have what I believe are hidden assets and again fit this theme. Similarly, recent investments outlined in our previous letter, such as classic/collector car insurance company Hagerty ( HGTY ), fit this theme as many people underappreciate the financial impact of onboarding their State Farm partnership, recently launched online marketplace opportunity, or understand the contractual changes of the reinsurance contract with Markel. We don’t only own misunderstood companies, but we own our fair share. In my experience with less liquid, less followed companies, prices can move down aggressively (e.g., 2022) but they can also move up very rapidly.
TOP 5 HOLDINGS
PAR Technology ( PAR )
As discussed earlier in the letter, I think there is a very clear path to continued growth in the enterprise software business for PAR.
At the Needham investor conference in early January, CEO Savneet Singh touched on a few themes that are key to our investment, including low churn. When speaking about the core POS system, he stated that they “have never churned a customer where we have a direct relationship in 4 years.” On the product front, he highlighted the crossselling opportunity, noting that “greater than 80% of customers signed in 2022 attached payments.” He also announced a new table service product, stating that “in 2023 you will see a couple of great announcements.”
In terms of the overall business, he said “…had a really good end to the year,” and when asked about a recession he said, “If it wasn’t for CNBC, I wouldn’t know we were in this economic climate. Brink had a great Q4 as we said on our Q3 call and nothing changed. In fact, I was surprised how much came in” adding that Payments hasn’t seen an “ounce” of slowdown and that the back office is “on fire because again back office is a cost savings tool”.
The above strikes me as pretty bullish commentary. It might surprise you that, in the same period he was talking about (Q4), PAR stock was down more than 10%, sliding more than 20% at its low. In the end, fundamentals matter and I think they are on our side with PAR.
KKR ( KKR )
While some companies do investor days that are broadcast widely, KKR hosts a small group of investors for a Teach In and then quietly releases the deck on their website. The last one was in 2019, and the most recent one was on January 11 th ( link ) . Fair warning: the document is 145 pages long and goes into great detail. As for the themes I have been emphasizing, here are a few tidbits from the Teach In and how they fit into the framework.
Low Churn – $113B in “dry powder” (slide 6), capital that KKR is contractually guaranteed to receive from limited partners to invest. Perpetual Capital is 46% of fee-paying AUM (slide 111).
Secular Tailwinds – In addition to the continued allocations to private equity, KKR is increasingly penetrating Insurance and Private Wealth. The assets in these pools are ~4x the size of pension fund assets, which are the traditional private equity clients (slide 10 and 47).
Positive Product Lifecycle Dynamics – Over 50% of assets raised in the last 12 months were for strategies that did not exist 5 years ago (slides 20, 93). KKR is not just the original leveraged buyout business. More than 30 strategies are targeted to raise capital in the next 12-18 months, including real estate, private credit, infrastructure, climate, and European direct lending (slides 28 and 109).
Operating Leverage – 50% of AUM is in strategies that are not yet scaled (slide 109).
Strong Balance Sheet – $22 billion in cash and investments (Q3 2022).
In 2021, the management team outlined a path to $7 per share in after-tax distributable earnings for 2026. At an average market multiple this would imply a $130 share price, or 30% annual returns from today (slide 7). Note their methodology excludes the value of the balance sheet. Now, this month, they declared (bold font theirs), “ We have a higher confidence in achieving these targets today than we did one year ago. ”
KKR ended the quarter as a $46 stock and last reported $20 per share in cash and investments. Management has provided 145 pages of data highlighting a very credible path to earning $7+ per share in 2026 and significantly higher in future years. In the end, fundamentals matter and I think they are on our side with KKR.
Cellebrite
Discussed at length earlier in the letter. When I adjust revenue for revenue recognition issues of onpremise software, I cannot find a less expensive, profitable software company with a similar growth profile. In the end, fundamentals matter and I think they are on our side with Cellebrite.
Elastic ( ESTC )
The share price of Elastic ended the year more than 30% below where it ended its first day of trading after its 2018 IPO. During this time period, the topline has grown approximately 5X. What started at a nosebleed valuation has compressed into a company that is very reasonably valued on a relative and absolute basis. During the quarter, the company announced layoffs of 16% of the workforce to accelerate profitability in 2023. This is an outstanding company with a strong balance sheet and excellent prospects, but we have been a seller of the shares and expect it will not be in the top 5 holdings in the next letter as I diversify the “types” of bets in the portfolio.
API Group ( APG )
Discussed at length in the last letter, API Group held an investor day in November to highlight the opportunities created from their acquisition of Chubb, the European fire safety business of Carrier insurance. I walked away from the event still convinced that there is a reasonable path to growing free cash flow to $1B as supply chain issues normalize, the Chubb opportunity is seized, and working capital dynamics normalize, which is attractive when compared to its $4.5B market capitalization. There is also the opportunity for multiple expansion, as the company trades at a discount to peers despite the superior quality of the business. This is another business that takes no imagination for me to see a doubling or tripling of the share price in the intermediate term. In the end, fundamentals matter and I think they are on our side with API Group.
SHORTS
During the quarter, the Fund remained short some major indices as well as a flying taxi company (not a joke) and an EV charging company. We added additional short positions, including a zero revenue battery company and an EV company that has a market capitalization in excess of $10B though it delivered fewer than 8,000 cars in 2022… because in the end, fundamentals matter.
OUTLOOK
When I look at our portfolio at the beginning of this new year, I have a mix of raw emotion, reminiscent of storied basketball coach Bobby Knight ( colorful speech ) , and optimism. I know continued multiple compression and a recession are very possible and would not be positive. At the same time, multiples for small cap stocks are at or near lows not seen since the great recession. There is a lot of fear, which creates the opportunity for individual stocks to be severely mispriced. I am convinced that we own more than our share of these mis-priced stocks, and the hunting for new ideas has been as fertile as it has been in years because fundamentals matter, and few are paying attention right now.
Onwards,
Scott Miller
APPENDIX – NEW INVESTMENTS
During the quarter, we initiated two small positions. Both are representative of the “waters” we are fishing in. Both are small and cash generating, with high insider ownership, strong capital allocation, and hidden assets on the balance sheet.
NEW INVESTMENT: PATRIZIA ( PTZIF )
Another company where the Greenhaven Road view is decidedly different than other market participants is a new investment in a German asset manager, Patrizia. My view is so different that I have feared it is wrong, but after extensive review of financial statements and time talking to the company, I think I have identified a hidden asset. The question is, how big is it?
Patrizia is a German real estate business that has transitioned from being “asset heavy,” owning large stakes in several property developments, to an asset light manager with $57B in AUM. When it was an asset heavy property developer, valuation metrics like price to book made a lot of sense. As it has transitioned to asset management and away from ownership, these metrics make little sense and it’s no longer appropriate for the company to be covered by REIT analysts. There are a lot of parallels between KKR and Patrizia, including what I believe is the market’s underappreciation for the strength of its balance sheet.
In very round numbers, Patrizia was valued at €700M at the time of our first purchases. We were paying less than €8 per share for a company with €2.4 of cash per share, just under €2 per share for their ownership share of a large housing development in Berlin called Dawonia, and €3.85 per share for their earned but not yet realized incentive fee for the portion of Dawonia they do not own but have developed and managed for investors. I realize that property values in Berlin have likely declined and a haircut should be applied to the value of the real estate and the incentive fee, but it is hard to argue that we were paying more than a couple hundred million euros for the asset management business.
The asset management business has three sources of revenue. The largest and most durable is management fees: the €57B in AUM generated approximately €245M in management fees in 2022. The smallest source is transaction fees, which relate to fees earned when a property is bought or sold. These fees are estimated to total approximately €30M in 2022, down as uncertainty has slowed transactions. For the final source of revenue, the company has guided to 2022 performance fees of €55M.
Now, here is where we return to arcane accounting. Under international accounting rules, as I understand it, for its funds in which Patrizia itself owns less than 5%, performance fees are only recognized upon exit. This applies to every fund except the one that holds Dawonia, which recognizes fees prior to exit.
The result? The incentive fees that will crystallize upon exit appear nowhere in the financial statements. KKR, which operates under U.S. accounting rules, discloses incentive fees that are earned but not yet realized, but Patrizia, which operates under European accounting rules, cannot.
If European real estate returns to 1990s levels, this earned but unrealized incentive fee asset is effectively nonexistent, but Patrizia has earned tens of millions of euros per year in performance fees, indicating a history of profitable investing and a history of realizing fees. I don’t have an exact valuation for the net present value of the performance fees that have been earned but not yet realized, but I am comfortable that it is greater than zero and likely hundreds of millions of euros. Patrizia’s share prices has been highly correlated to German REITs, but I think an asset manager generating hundreds of millions of euros in management fees with an invisible asset of embedded incentive fees should not be valued using book value. In the end, fundamentals matter and I think they are on our side with Patrizia.
I was made aware of Patrizia because of a presentation on MOI Global by Gokul Raj Ponnuraj of Bavaria Industries Group.
NEW INVESTMENT: CLARUS ( CLAR )
The 2022 price chart for Clarus ( CLAR ) looks a bit unusual, bouncing around $20 per share for most of the year, spiking up to $28, and then plummeting to less than $8, a level not seen since 2019. The short interest in Clarus exploded, as did trading volumes. There were approximately 37.3M shares outstanding in July 2022. In August, 87M shares traded – 20 times what traded in several previous months. In the last 4 days of August, more than 37M shares traded hands on no obvious news. It’s typically an enormous waste of time to try to explain short-term moves in stocks, but here we can find some breadcrumbs. A Brazilian hedge fund seems to have blown up ( link ) and a large quantitative options fund seems to have inadvertently acquired enough shares of stock (4.3M) and call options (3.9M) by the end of July that fully exercising them would have resulted in the firm owning 21.9% of the company. By the end of August, that firm sold all but 300k shares but grew its options position to 11.8M which, if fully exercised, would have resulted in 32.4% ownership. We will come back to this massive options position, but the main point here is that a large portion of the buyers and sellers were one fund being margin called (seller) and a fund that quickly acquired and divested a disproportionately large exposure to Clarus.
Our purchase prices were around $8 per share, which implies a market capitalization of roughly $300M. The company does have debt, which should have been approximately $135M as of year-end, and also should have ended the year with $100M+ of inventory. What does Clarus do? I suspect that the options firm had no idea, but this is how Clarus describes itself:
“Clarus Corporation is a global leading designer, developer, manufacturer and distributor of best-in-class outdoor equipment and lifestyle products focused on the outdoor and consumer enthusiast markets. Our mission is to identify, acquire and grow outdoor ‘super fan’ brands through our unique ‘innovate and accelerate’ strategy. We define a ‘super fan’ brand as a brand that creates the world’s pre-eminent, performance-defining product that the best-in-class user cannot live without.”
Clarus has been built by Warren Kanders, who owns approximately 15% of the company. He has allocated capital well and has pursued a buy-and-build strategy of improving underlying brands through better distribution and availability of capital. His first acquisition and highest profile brand is Black Diamond, a leading brand for rock climbers. Most recently, Clarus purchased an Australian company, Rhino Rack, which builds roof racks for SUVs for off-road adventures (think Thule on steroids).
In round numbers, Clarus’ $300M + debt is substantially less than the prices paid to acquire Black Diamond ($90M), Sierra ($79M), Barnes ($31M), and Rhino Rack ($197M). The valuation also appears quite reasonable relative to the $60M+ in EBITDA I expect the company to generate in 2023. There is a “better” case scenario three or four years out where supply chain issues moderate, valuation multiples revert to closer to historical levels, and the stock becomes a three-or four-bagger.
Coming back to the options firm that acquired exposure to 32% of Clarus – in the U.S., if an entity acquires more than 10% of a company, they must hold those shares for at least six months. If not, the company (or, if the company refuses, its shareholders) can sue for the profits under the “short swing profit rule.” There are also exceptions for market makers and arbitragers, both of which have been invoked by the firm in question.
This is also not my area of expertise but, in my opinion, the short swing profits, could easily be $2 per share or >25% of the prices we were paying. The company has filed suit. This potential windfall does not appear on the company’s balance sheet nor is it discussed or valued in the marketplace, as far as I can tell. The short swing profit opportunity is not the reason to buy the shares, but at sub-7X EBITDA that should be growing, it is a potential cherry on top.
In the end, fundamentals matter and I think they are on our side with Clarus.
Dan Roller, a manager in which Greenhaven Road’s Partners Fund is invested, has been very helpful getting comfortable with the long-term opportunity for Clarus.
Disclaimer:This document, which is being provided on a confidential basis, shall not constitute an offer to sell or the solicitation of any offer to buy which may only be made at the time a qualified offeree receives a confidential private placement memorandum (“PPM”), which contains important information (including investment objective, policies, risk factors, fees, tax implications, and relevant qualifications), and only in those jurisdictions where permitted by law. In the case of any inconsistency between the descriptions or terms in this document and the PPM, the PPM shall control. These securities shall not be offered or sold in any jurisdiction in which such offer, solicitation or sale would be unlawful until the requirements of the laws of such jurisdiction have been satisfied. This document is not intended for public use or distribution. While all the information prepared in this document is believed to be accurate, MVM Funds LLC (“MVM”), Greenhaven Road Capital Partners Fund GP LLC (“Partners GP”), and Greenhaven Road Special Opportunities GP LLC (“Opportunities GP”) (each a “relevant GP” and together, the “GPs”) make no express warranty as to the completeness or accuracy, nor can it accept responsibility for errors, appearing in the document. An investment in the Fund/Partnership is speculative and involves a high degree of risk. Opportunities for withdrawal/redemption and transferability of interests are restricted, so investors may not have access to capital when it is needed. There is no secondary market for the interests, and none is expected to develop. The portfolio is under the sole investment authority of the general partner/investment manager. A portion of the underlying trades executed may take place on non-U.S. exchanges. Leverage may be employed in the portfolio, which can make investment performance volatile. An investor should not make an investment unless they are prepared to lose all or a substantial portion of their investment. The fees and expenses charged in connection with this investment may be higher than the fees and expenses of other investment alternatives and may offset profits. There is no guarantee that the investment objective will be achieved. Moreover, the past performance of the investment team should not be construed as an indicator of future performance. Any projections, market outlooks or estimates in this document are forward-looking statements and are based upon certain assumptions. Other events which were not taken into account may occur and may significantly affect the returns or performance of the Fund/Partnership. Any projections, outlooks or assumptions should not be construed to be indicative of the actual events which will occur. The enclosed material is confidential and not to be reproduced or redistributed in whole or in part without the prior written consent of the relevant GP. The information in this material is only current as of the date indicated, and may be superseded by subsequent market events or for other reasons. Statements concerning financial market trends are based on current market conditions, which will fluctuate. Any statements of opinion constitute only current opinions of the GPs, which are subject to change and which the GPs do not undertake to update. Due to, among other things, the volatile nature of the markets, and an investment in the Fund/Partnership may only be suitable for certain investors. Parties should independently investigate any investment strategy or manager, and should consult with qualified investment, legal, and tax professionals before making any investment. The Fund/Partnership are not registered under the Investment Company Act of 1940, as amended, in reliance on exemption(s) thereunder. Interests in each Fund/Partnership have not been registered under the U.S. Securities Act of 1933, as amended, or the securities laws of any state, and are being offered and sold in reliance on exemptions from the registration requirements of said Act and laws. The references to our largest positions and any positions listed in the Appendix are not based on performance. All of our positions will be available upon a reasonable request. All hyperlinks contained herein are not endorsements and we are not responsible for such links or the content therein. |
Footnotes[1] Greenhaven Road Capital Fund 1, LP, Greenhaven Road Capital Fund 1 Offshore, Ltd., and Greenhaven Road Capital Fund 2, LP are referred to herein as the “Fund” or the “Partnership.” |
Editor's Note: The summary bullets for this article were chosen by Seeking Alpha editors.
For further details see:
Greenhaven Road Capital Main Fund Q4 2022 Investor Letter