GSG - GSG: A Commodity Boom Without The Bust
2023-09-08 10:31:41 ET
Summary
- Oil prices are expected to rise due to growing global demand and Saudi Arabia's extended production cuts.
- The iShares S&P GSCI Commodity-Indexed Trust ETF is benefiting from the rising oil prices.
- The future of oil demand is uncertain due to decarbonization, leading to less investment and a more balanced market.
Last year, the war in Ukraine pushed oil prices higher. Recession fears led to lower oil prices in the second half of 2022. In response to the lower demand OPEC lowered supply and in the second quarter of this year oil prices started to rise again. As always it's a story of supply and demand.
Global demand is growing, and Saudi Arabia extended its voluntary crude oil production cuts. The US Energy Information Administration ((EIA)) expects these factors will continue to reduce global oil inventories and put upward pressure on oil prices in the coming months. In its August Short-Term Energy Outlook, EIA forecasts the Brent crude oil price to average $86/bbl in second-half 2023, up about $7/bbl from its July forecast for the same period.
The rising oil prices are of course a strong tailwind for the energy rich iShares S&P GSCI Commodity-Indexed Trust ETF ( GSG ).
What will the future bring? More uncertainty and more balance at the same time.
The uncertainty with regard to the future oil demand due to the decarbonisation leads to less investment, or even underinvestment which in turn leads to an environment that will not lead to the traditional boom & bust cycle. No boom & bust, but more balance is good news for commodity investors because they can avoid that way the nasty effects of the bust.
Let's first take a look at the performance of commodities.
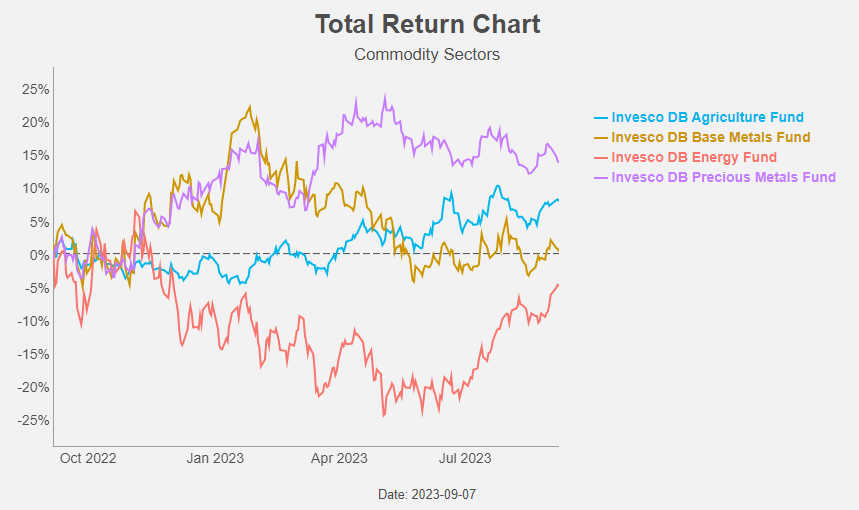
Commodity performance
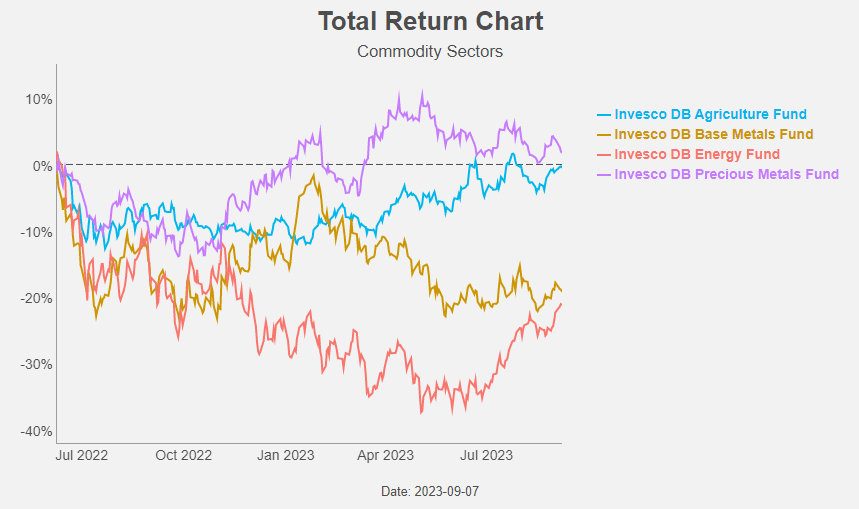
In the past 12 months, energy was the worst-performing commodity sector, and the only one with a negative total return.
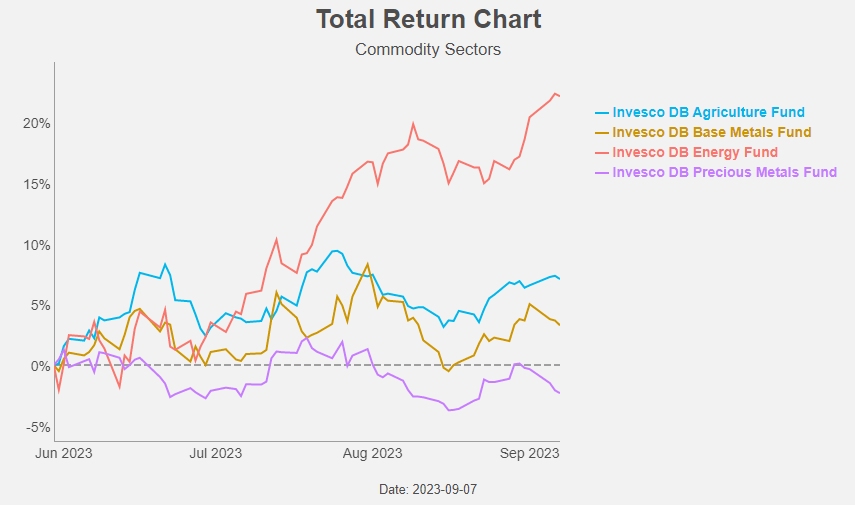
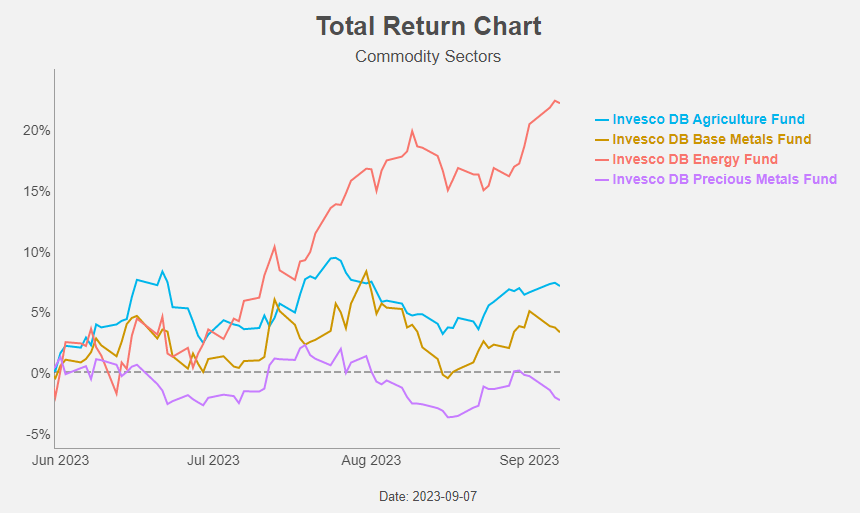
Since the end of May, the picture has turned upward down: energy has the best performance.
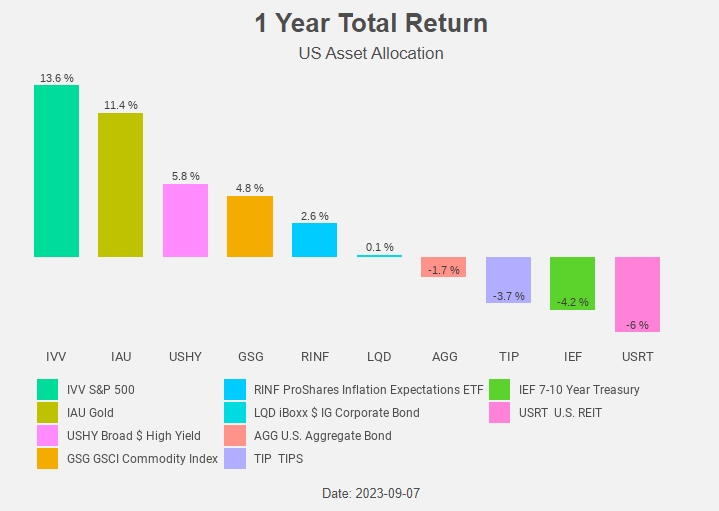
Compared to other asset classes, commodities lag the stock market and high yield bonds, but outperform bonds and real estate.
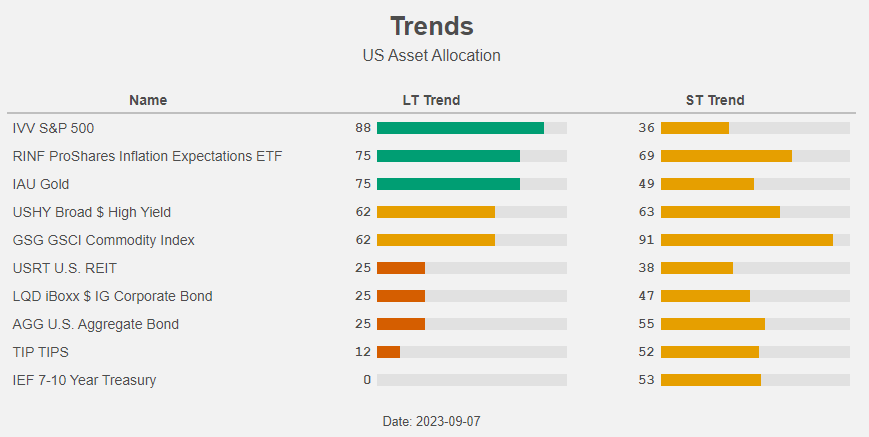
This is also reflected in the long-term trends. Stocks, gold, and inflation expectations are in an uptrend, while bonds (with the exception of high yield) and real estate are in a downtrend. Commodities are in neutral territory.
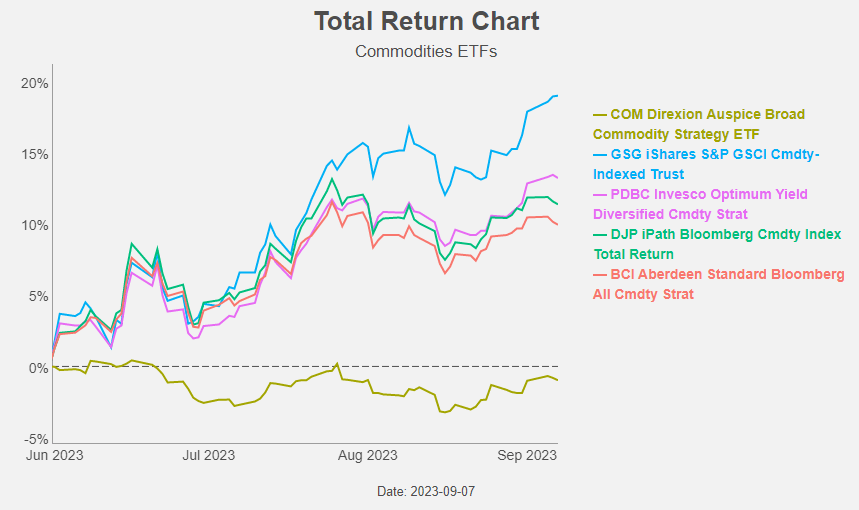
Among commodity ETFs the iShares S&P GSCI Commodity-Indexed Trust ETF is the top-performer. The ETFs with Bloomberg in their name (the iPath Bloomberg Commodity Index Total Return ETN ( DJP ) and the abrdn Bloomberg All Commodity Strategy K-1 Free ETF ( BCI ) have the worst performance with even a negative total return.
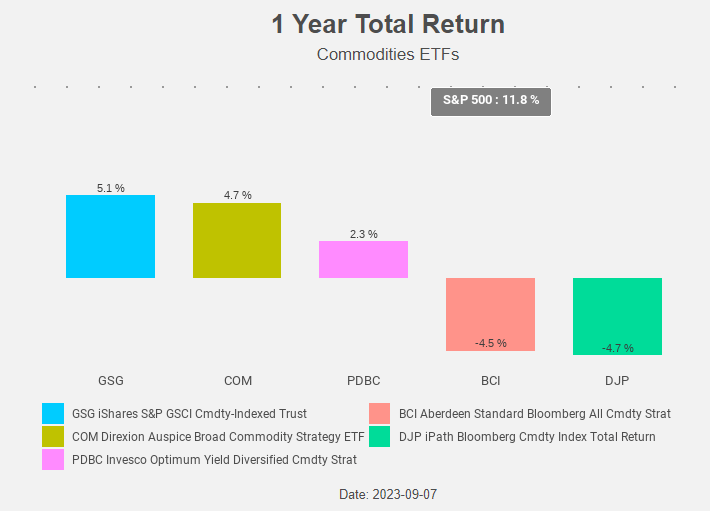
The difference in performance can be explained by the composition of the different ETFs.
The major commodity indexes are:
- The S&P GSCI Index,
- The Bloomberg Commodity Index, and
- The DBIQ Optimum Yield Diversified Commodity Index.
These indexes are all constructed using liquidity and production figures. Given the economic importance of energy in general and oil in particular this leads to a heavy energy-weight. To avoid this energy-tilt the Bloomberg Commodity Index restricts weights of individual commodities and related commodity groups. This results in a much lower energy weight in the Bloomberg Commodity Index (36%) compared to S&P GSCI Index (65%) and the DBIQ Optimum Yield Diversified Commodity Index (63%).
GSG follows the S&P GSCI Index and the Invesco Optimum Yield Diversified Commodity Strategy No K-1 ETF ( PDBC ) follows the DBIQ Optimum Yield Diversified Commodity Index. Like we said, the two other ETFs in our overview follow the Bloomberg Commodity Index (or a version of that index).
The Direxion Auspice Broad Commodity Strategy ETF ( COM ) is a special case. The exposure to commodities can individually be long or flat. For the moment COM is long soybeans, cotton, sugar, crude oil, gasoline and heating oil. COM is flat on the metals copper, gold and silver, on the agricultural commodities corn and wheat and on natural gas.
COM is hence most positive on energy.
Since the top in oil prices in June 2022, COM is the best performer.
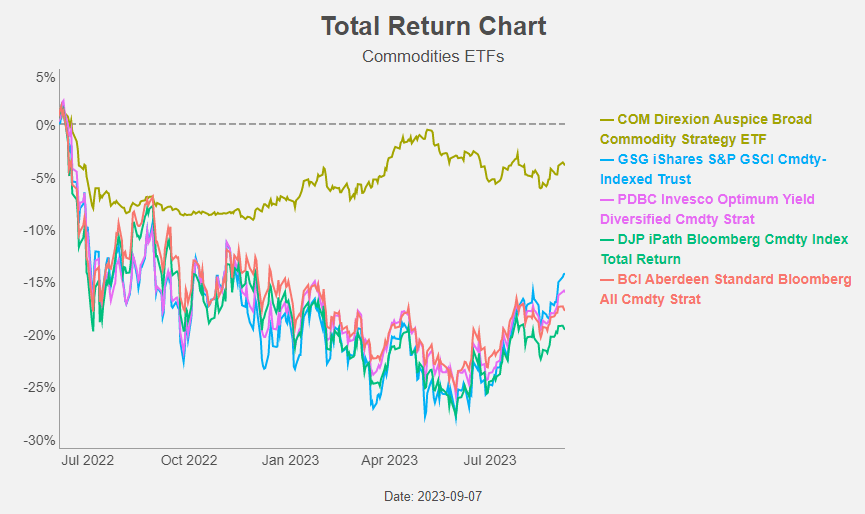
Since the end of May, oil prices are rising again and this is reflected in the performance of the energy-rich ETFs.
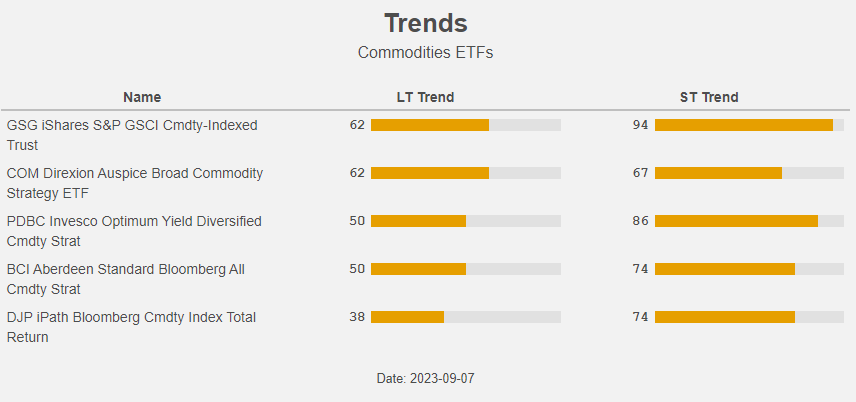
GSG and COM are the two ETFs with the strongest long-term trend.
The outlook for energy
As always it's a story of supply and demand. Let's start with supply.
Wood Mackenzie expects demand to peak at 108 million barrels per day in the early 2030s before beginning its long-term decline. This approaching peak demand and the energy transition force the energy industry to be very disciplined with capex.
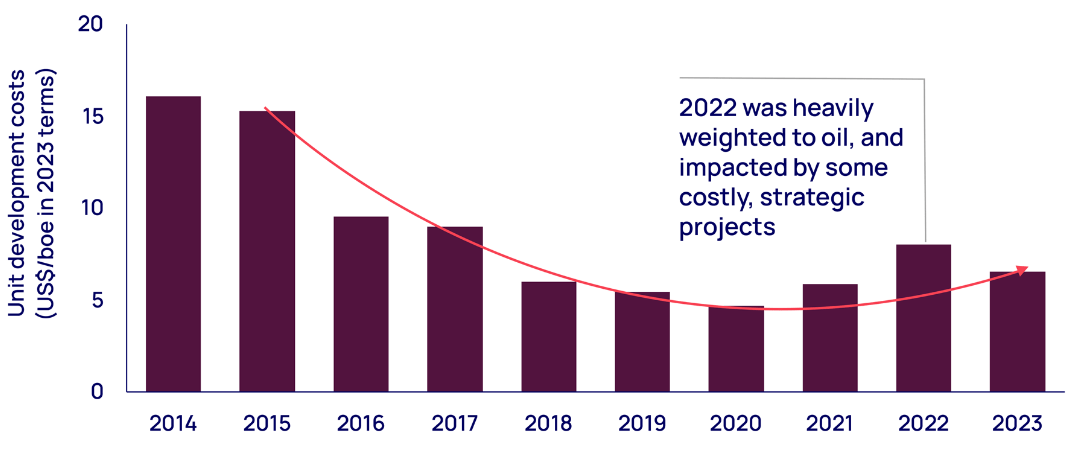
Global capex is estimated to be around US$490 billion in 2023, up from the 2020 low of US$370 billion. Recovering demand, firmer prices, availability of cash flow are fuelling the rise. Nevertheless, the level of investment today is only just over half the average of US$800 billion (in 2023 terms) spent each year from 2010 to 2014.
The good news is that the industry has drastically reduced costs. Development costs are two-thirds lower than 2014.
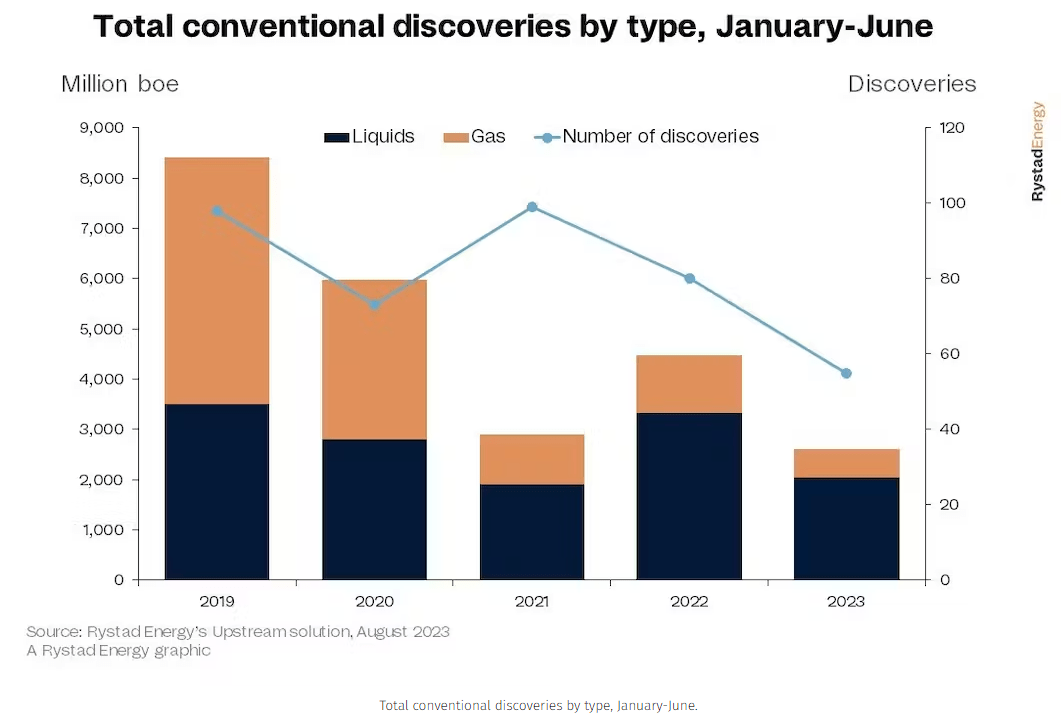
However, despite increased investments, discovered volumes are falling to new lows.
According to Rystad, explorers found 2.6 billion barrels of oil equivalent in the first half of this year, a 42% drop compared with the same period in 2022. It remains to be seen if there will be enough supply to meet the growing demand in the coming years.
In the meantime, Saudi Arabia extended its voluntary crude oil production cuts.
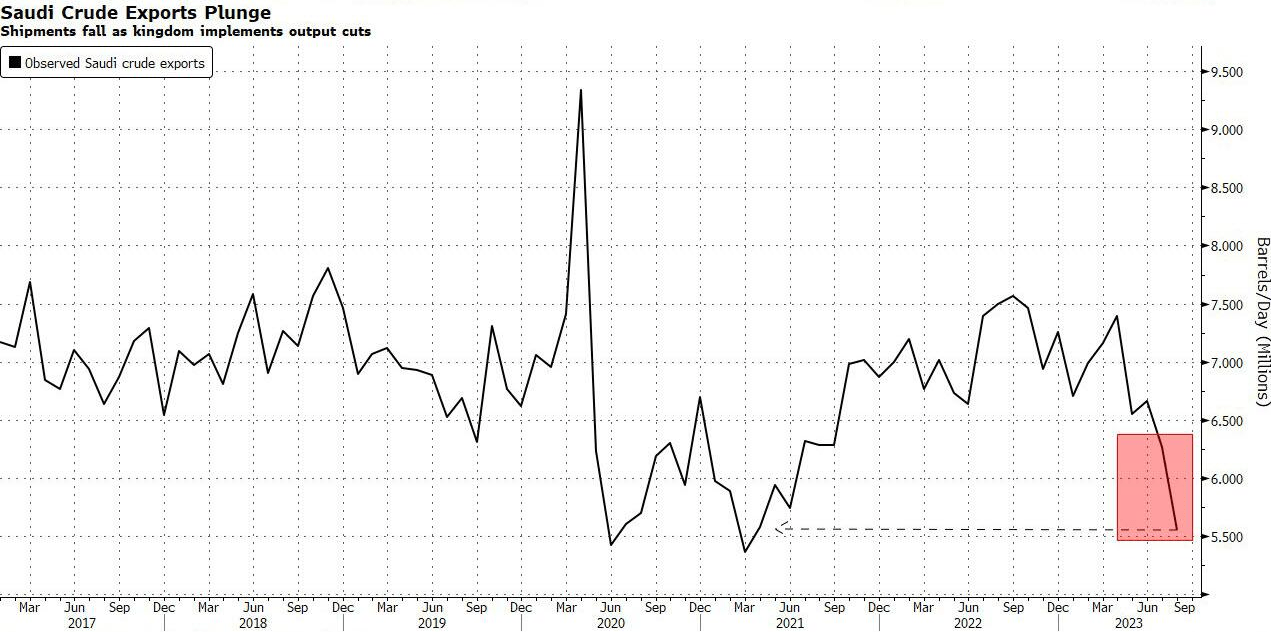
The WSJ reported that Saudi Aramco, the world's largest oil company, is considering a very large equity offering. The higher the oil price, the better the result of the offering will be of course.
In the US the strategic oil reserves are still at a very low level, so it's very unlikely that oil releases from the reserve cab help in adding supply to the market.
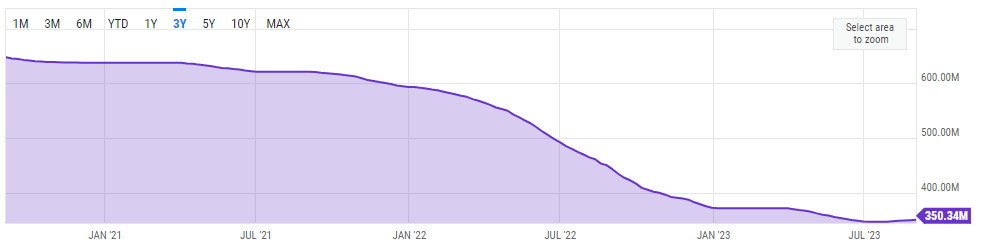
Now, let's take a look at demand. Like we said, Wood Mackenzie expects demand to peak at 108 million barrels per day in the early 2030s. They also expect oil demand to remain above 90 million b/d out to 2050. Their outlook is based on a so-called 2.5 °C pathway, while the Paris treaty counts on a 1.5 °C scenario.
At the moment world oil demand is increasing to record highs, boosted by robust summer air travel, increased utilization of oil in power generation, and surging Chinese petrochemical activity, the International Energy Agency ((IEA)) said in its August Oil Market Report.
In its August Short-Term Energy Outlook, the US Energy Information Administration forecasts the Brent crude oil price to average $86/bbl in second-half 2023, up about $7/bbl from its July forecast for the same period.
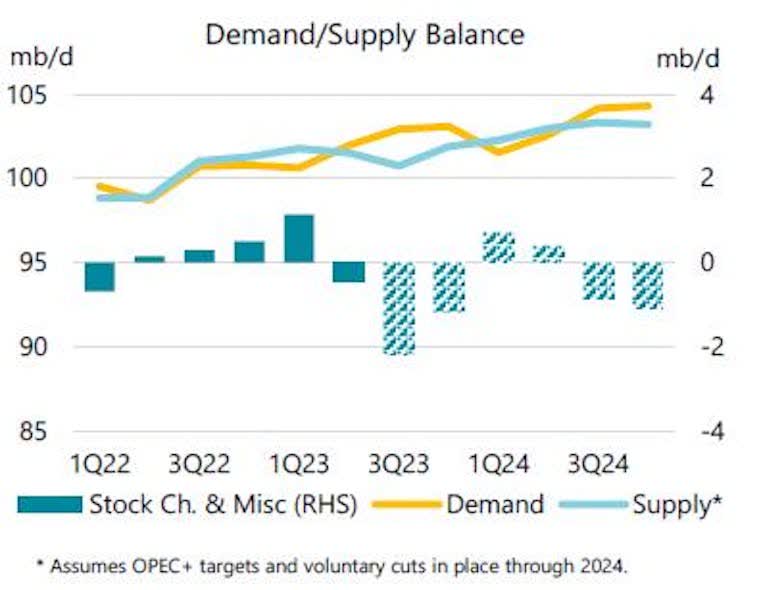
The uncertainty with regard to the future oil demand due to the decarbonisation leads to less investment, or even underinvestment which in turn leads to an environment that will not lead to the traditional boom & bust cycle. No boom & bust is good news for commodity investors because they can avoid that way the nasty effects of the bust.
The role of commodities
We do expect commodities will keep playing their important role as both a portfolio diversifier and inflation hedge.
Commodities are not only outperforming in the current inflationary period. Also, in the past, commodities had the highest so-called inflation beta .
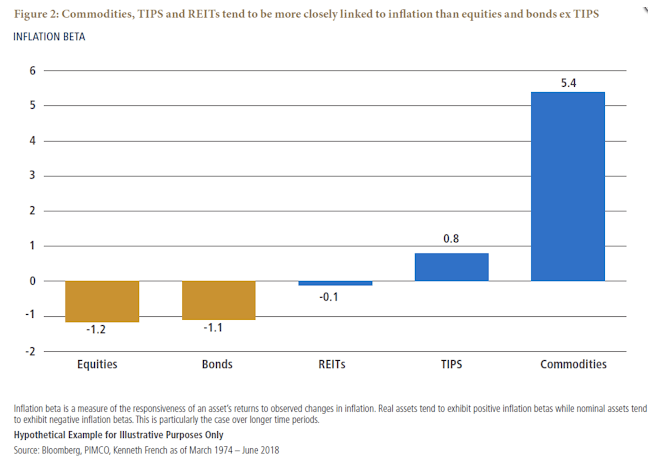
And while inflation has cooled in the last months, a new rise in inflation figures in the coming years cannot be excluded. If the current inflation cycle keeps following the path of the inflation cycle in the 70s.
Figure 17: Inflation cycles (Bloomberg)
Commodity returns this year are much uncorrelated to those of equities and bonds and this was also the case in the past.
Figure 18: Correlation Table (PIMCO)
Conclusion
Due to their inflation hedging qualities and diversification benefits commodities should remain part of your portfolio. Among the different commodity sectors energy is performing best.
The uncertainty with regard to the future oil demand due to the decarbonisation leads to less investment, or even underinvestment which in turn leads to an environment that will not lead to the traditional boom & bust cycle.
We prefer the iShares S&P GSCI Commodity-Indexed Trust ETF: it is energy-heavy and offers at the same time the added diversification benefits that the inclusion of other commodity sectors bring.
For further details see:
GSG: A Commodity Boom Without The Bust