XOP - GUSH: For Oil Bulls
2023-12-23 03:54:19 ET
Summary
- Crude oil inventories are running lower than normal in the world vs. current demand levels, where any supply shock will be difficult to handle.
- Excessive money printing over the decades, rising production costs, and a depleted U.S. SPR emergency stockpile are bullish factors for petroleum prices.
- With little mainstream investor interest in oil/gas names, today may prove an excellent time to own the group with leverage.
- GUSH appears to be well situated as a crude oil spike hedge, if such occurs in 2024.
I have written a number of bullish pieces on crude oil and related U.S. production ideas since the summer. I still believe my articles on Exxon Mobil (XOM) here , United States Oil Fund, LP (USO) here , and Texas Pacific Land (TPL) here are topical and worthwhile reads.
The positive take is largely a function of tightening supplies worldwide vs. growing demand. Some of the squeeze is being caused by planned OPEC+ production cuts to support price. Basically, inventories as a function of demand globally remain lower than normal.
EIA Website - Global Inventory Data, 2024 Forecast
Now we have the Israel-Hamas conflict focused around Gaza. The odds are if/when the military fighting ends, long-term peace will not break out across the Middle East. In fact, I fear the odds of trouble spreading are actually quite high in the months ahead. For example, what if Iran more directly attacks Israel through its funded henchmen surrounding Israel, AFTER western interests actively attack its proxies in Yemen and Lebanon. Western powers are already grappling with what to do about drone and pirate attacks on the critical shipping lanes around Yemen (Persian Gulf oil tankers) and the Red Sea (Suez Canal route to Europe).
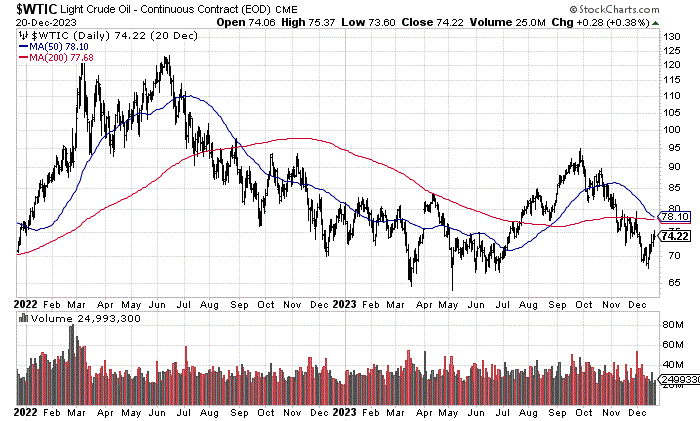
The good news for petroleum owners is crude oil is cheaper than you think, after adjusting for inflation over the decades, while America's Strategic Petroleum Reserve [SPR] emergency supplies in Louisiana and Texas have largely been drained under President Biden. If any significant new supply disruption appears (perhaps out of the blue in a black swan event, which is how crude oil spikes traditionally materialize), a rapid climb in crude oil from US$70 to $150 a barrel or even higher is not out of the question during 2024.
StockCharts.com - Nearby WTI Crude Futures, 2 Years of Daily Price & Volume Changes StockCharts.com - Nearby Natural Gas Futures, 2 Years of Daily Price & Volume Changes
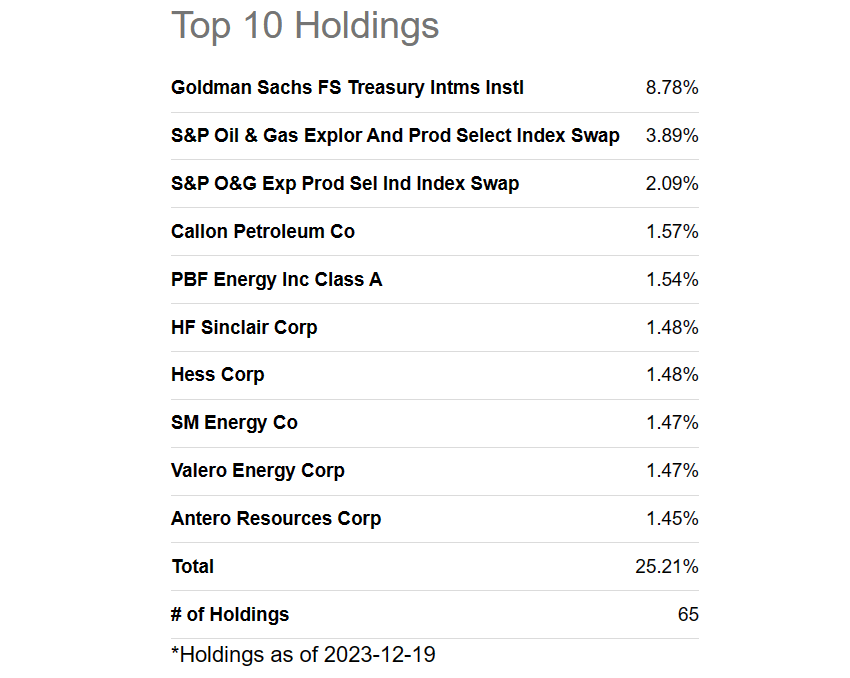
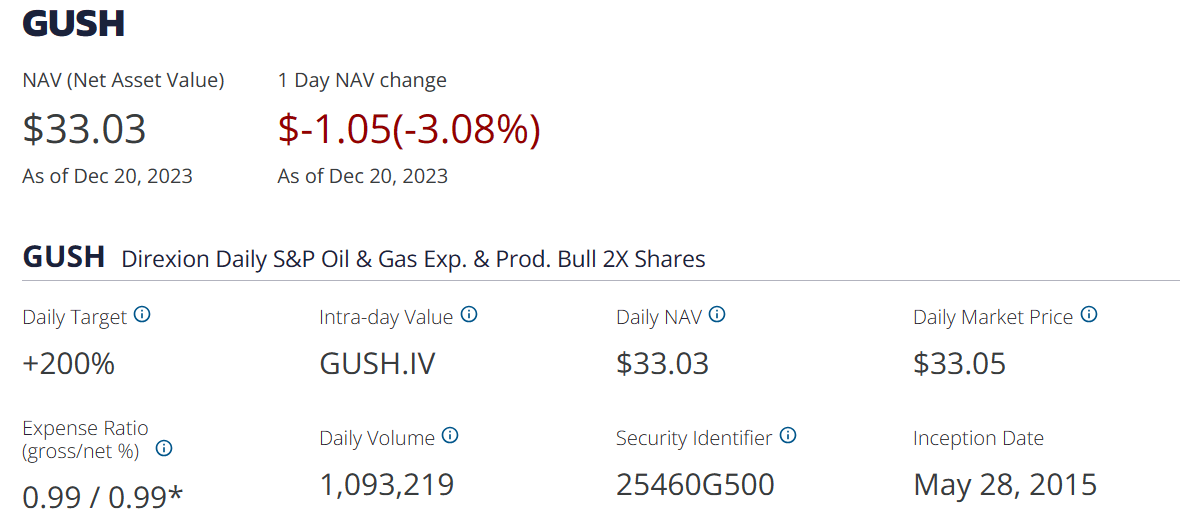
For me, another smart investment alternative to hedge your brokerage portfolio and fight future energy inflation might be through a leveraged, but diversified ETF product, the Direxion Daily S&P Oil & Gas Exploration & Production Bull 2X Shares (GUSH). You basically own a long list of the top U.S. oil/gas production names, plus swap contracts to create extra leverage. Below is the Top 10 holdings list. The big boys are also included (although at slightly lower weightings), like Exxon Mobil, Chevron (CVX), ConocoPhillips (COP), Devon (DVN), EOG Resources (EOG), Pioneer Natural (PXD), Marathon Oil (MRO), and close to 50 others.
Seeking Alpha Table - GUSH ETF, Top 10 Holdings, December 19th, 2023 Direxion Website - GUSH ETF, December 21st, 2023
The fund does charge around 1% annually for management fees, and the swap contracts involve costs and premiums that hurt total return investment gains over time. However, during past crude oil surges, GUSH has proven a terrific way to leverage oil/gas commodity changes. The daily rebalance feature actually helps to compound prolonged advances, almost like pyramiding for a trading strategy. Plus, the trailing dividend yield of 2.3% is not bad for a leveraged ETF.
Performance Stats
The best way to describe how this trust works is by showing some total return charts vs. the underlying Standard & Poor's oil/gas index through the 1x product (100% long), SPDR S&P Oil & Gas Exploration & Production ETF (XOP).
Below I have graphed total returns for both ETFs over the latest 6 months, 12 months, and 2 years. A couple of things to notice. First, when the oil producers are rising, GUSH does a fine job of roughly doubling investment gains over periods of days and even months. Second, when you purchase GUSH at a short-term peak for the industry, your returns have a tough time getting back to breakeven or generating a double on the underlying index. That's mainly the result of the daily rebalance feature. In essence, upside is magnified, while downside creates a hole difficult to get out of.
YCharts - GUSH vs. XOP ETFs, Total Returns, 6 Months YCharts - GUSH vs. XOP ETFs, Total Returns, 12 Months YCharts - GUSH vs. XOP ETFs, Total Returns, 2 Years
Next, we can review how longer-term bull markets in the oil/gas sector play out. Below I have graphed a 3-year trailing return chart, and the ultra-positive period of gains between the late March 2020 bust bottom for crude oil under $20 a barrel to the peak above $120 by early June 2022, after Russia invaded Ukraine.
In a consistent uptrend, the daily rebalance feature acts as a compounding mechanism, where gains beyond the initial and advertised 200% design on the underlying index are possible.
YCharts - GUSH vs. XOP ETFs, Total Returns, 3 Years YCharts - GUSH vs. XOP ETFs, Total Returns, March 2020-May 2022
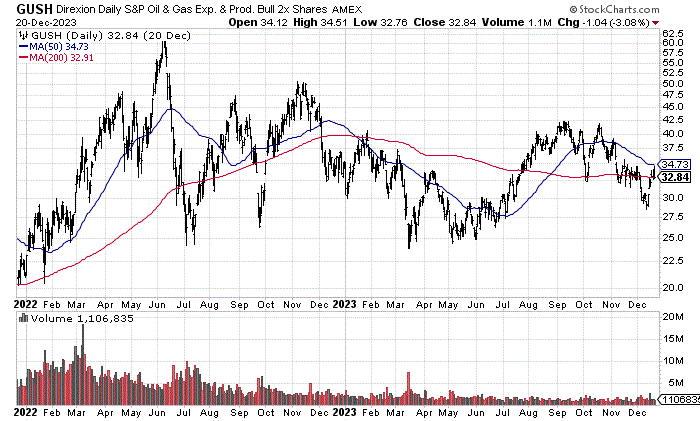
Trading volumes in GUSH since late summer have been running 90% of the Q1 2022 level (the Russia/Ukraine war spike). Investor interest in oil/gas names has truly imploded, with fast money moving on to the Big Tech winners of 2023. One old Wall Street adage is " never short a dull market ." Considering a variety of pulls and pushes on crude oil in the second half, actual price changes have been on the boring side for traders. In a sense, nearly all commodities have become a forgotten asset class for portfolio diversification during the last 18 months of central bank credit tightening. Sliding commodity quotes during 2023 and expectations of such continuing in 2024 during a possible recession scenario now reign supreme for investor sentiment.
StockCharts.com - GUSH ETF, 2 Years of Daily Price & Volume Changes
Crude Oil Remains Inexpensive
What's the upside argument for GUSH? It comes down to the historical catalysts and outcomes for many past U.S. recessions since the 1960s. Whether the 1973-74 OPEC oil shock, the secondary OPEC 1979-80 oil spike, the 1990 Persian Gulf War, or the all-time high move in 2008, recessions are highly correlated with surging energy prices and their related effects (regarding lower corporate profits, higher inflation/interest rates and sagging consumer confidence). The early 2020 oil bust and pandemic situation were not the typical combination of events to force the economy into contraction.
Honestly, U.S. energy pricing is now more susceptible to an oil supply shock in the Middle East (or elsewhere on the planet) than any other moment since the early 1980s. Why? Because one grand idea after the oil shock period of the 1970s was to put together an insurance policy for Americans. It's called the SPR emergency resource, where deep caverns in Louisiana and Texas have been filled with vast quantities of crude oil for a rainy-day disruption. President Biden decided the Russian invasion of Ukraine early last year was the rainy-day event to tap this reserve. Today, the SPR sits at a level 60% lower than 2010's peak and about 50% lower than 2021. What this means is any new shortage in worldwide supply could spike crude oil quotes abnormally vs. the last four decades of price swings.
YCharts - U.S. SPR Oil Reserves, Since 1985
For example, if Iran attacked the oil fields of Saudi Arabia and/or its pipelines and extensive port facilities around the Persian Gulf, many poorer third-world nations, and perhaps even Japan, China and western Europe might have to endure a span of limited quantities vs. what economic conditions require. Empty pumps at the local gas station or airport terminal might become reality again like the 1970s.
The good news at home is U.S. and Canadian production can supply most of America's demand in an emergency, but pressure from allies and the incentive of higher prices could lure our resources to be exported elsewhere. With our SPR stockpile disappearing, and the import screams from others factored into the equation, worst-case scenarios for crude oil prices are now US$200 a barrel or higher (the equivalent of $7-$8 per gallon on refined gas for your car).
Why so high? Because inflation and money printing have pushed up production costs over the decades. While $70 or even $100 a barrel sounds high compared to the lows of 2020 under $20, crude oil traded above $140 all the way back in 2008. To reach the same inflation-adjusted area, $200+ crude oil would be required. Below I have graphed West Texas Intermediate prices since 1980, then adjusted this price to general cost-of-living increases over 43 years. You will notice the adjusted monthly $77 crude oil quote today represents a valuation far below the $40 unadjusted nominal price in 1980. Believe it or not, $77 crude oil sits at a relatively average price over the last four decades when measured against the general price level for goods and services in the U.S.
YCharts - WTI Crude Oil Monthly vs. U.S. CPI Changes, Since 1980
Even more bullish for oil/gas investors is M2 money supply increases and Treasury debt borrowing fully support far stronger commodity pricing over time. As a function of past fiat money printing and future requirements to keep Uncle Sam solvent, energy prices keep getting cheaper and cheaper each year, not more expensive like conventional wisdom believes. In other words, if you project money printing at exaggerated rates will continue (like I do), such should support an ever-rising price trend in crude oil, assuming overall demand holds up under the pressure of green/renewable energy buildout.
YCharts - WTI Crude vs. M2 Money Supply & Treasury Debt Growth, Since 1980
With the real-world cost of production in the US$70+ area globally to keep supplies stable (using my own estimates for depreciation, production costs, rapid reserve depletion, plus drilling and exploration expense required to replace reserves), general inflationary trends argue petroleum prices have considerable upside from current quotes. If prices stay below $70 for long, marginal producers will not explore to find replacement resources, while uneconomic production will be shut down. In time, falling supply would become a problem to match steadily growing demand appetite (from industry estimates).
Another point to ponder is the average OPEC nation needs a price above $70 per barrel to fiscally fund government expenditures. Can Saudi Arabia sell oil for $55 and earn a profit? Sure, but to fund government spending internally, an estimated price around $83 is now reality. If crude oil falls below $70 in 2024, it could lead to new political instability in the region.
Final Thoughts
I will end my discussion by saying the worst time to own GUSH was during the once-in-a-lifetime crude oil bust of early 2020. A collapse in energy demand from economic closures during the pandemic came just after Saudi Arabia announced unexpected supply increases (on its own) to drive weaker competitors around the globe out of business. Over the course of less than six months from Q4 2019, GUSH fell greater than -90% in value. The lesson learned is you want to avoid this ETF if a deep or prolonged recession is coming in 2024.
While I think there are some odds a severe recession could play out, one of the potential "triggers" for a recession might be a material JUMP in crude oil, which is the typical ending pattern for the average economic expansion cycle in America since the 1960s. There is some reverse logic in my bullish outlook.
If crude oil has an amazing swing higher in price left in the tank, perhaps on expanded Middle East turmoil (or another hot conflict spot in the near future) GUSH could be a unique winner soon. All this at a time when Wall Street is more focused on slowing economic growth, not paying attention to the upside crude oil arguments.
While the worst time to buy GUSH comes after a multi-year petroleum product advance, when everyone is bullish on energy names like early 2022, buying it when analyst expectations are low and investor interest is subdued makes plenty of sense to me. Although we are not at the end of a recession currently (where oil/gas demand can only rise like the middle of 2020), I gauge today's setup around $33 as better than average to consider for purchase.
Having said that, I would not overweight the idea in your portfolio. A 1% or 2% position is all the higher for total exposure I will go, as a recession may eventually pull crude oil prices down before any spike appears in the first half of 2024. I plan to use GUSH as one of many oil names in a well-diversified portfolio design. I own a variety of oil and green energy stocks today, each for different company/industry specific reasons.
I rate GUSH a Buy in limited quantities, on my projection of a surprise oil/gas rise next year.
Thanks for reading. Please consider this article a first step in your due diligence process. Consulting with a registered and experienced investment advisor is recommended before making any trade.
For further details see:
GUSH: For Oil Bulls