GVIP - GVIP: A Diversified High Conviction Play For This Stock Picker's Market
2023-08-16 13:14:23 ET
Summary
- The current market conditions present a favorable environment for stock pickers to outperform the stock market.
- High dispersion and high correlation among stocks increase the chances of active managers to succeed in their stock selection.
- The Goldman Sachs Hedge Industry VIP ETF is a well-suited ETF to take advantage of this stock picker's market, offering high conviction and high active share.
It’s not easy to outperform (consistently) the stock market. But sometimes, the stars are better aligned than normally to do it. Now is such a time. The Goldman Sachs Hedge Industry VIP ETF ( GVIP ) is a well-suited ETF to play this stock picker’s market.
Stock picker’s market
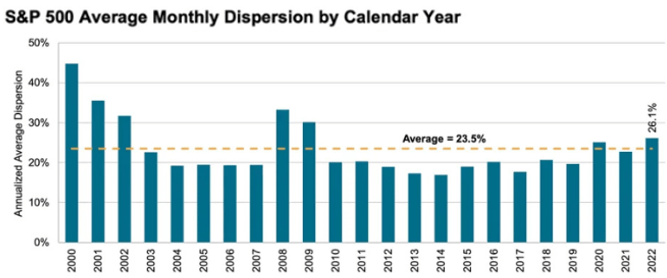
A stock picker’s chances of success increase when the dispersion is high. Dispersion measures the extent to which stocks move in relation to the market average. It’s a measure of the magnitude of differences among the returns of the constituents of e.g. the S&P 500. When dispersion is zero, all constituents have the same return. In that case, it’s very difficult to outperform. When dispersion is high, the difference in return between winners and losers is greater and the opportunity set for outperformance is much bigger.
In 2022 dispersion among constituents of the S&P 500 index was its highest since 2009, creating the conditions for active managers to show their stock selection skills.
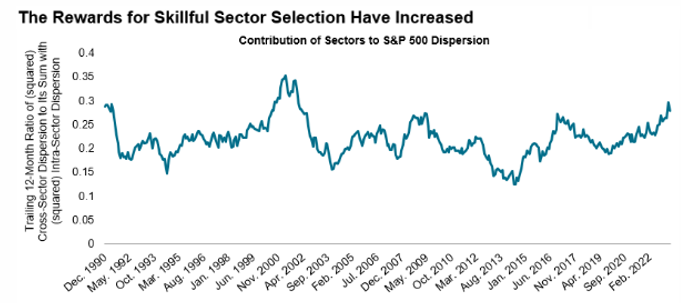
The contribution of cross-sector effects to total S&P 500 dispersion has also risen.
Figure 2: Contribution of sectors to Dispersion (S&P Global)
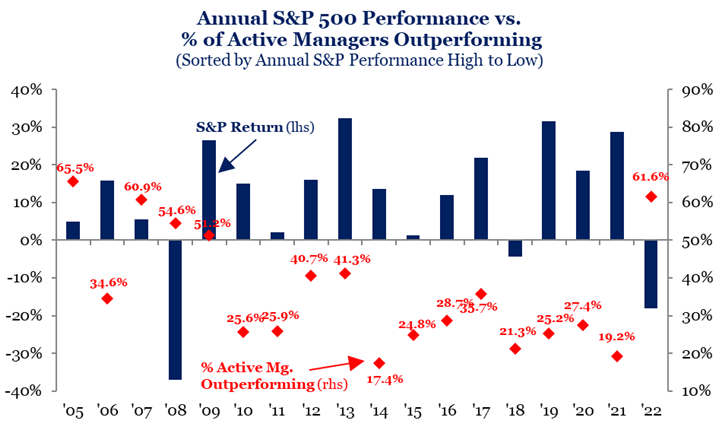
The result of this higher dispersion: more than 60% of active managers were outperforming the S&P 500 in 2022.
Figure 3: % of Active Managers Outperforming (Strategas Securities)
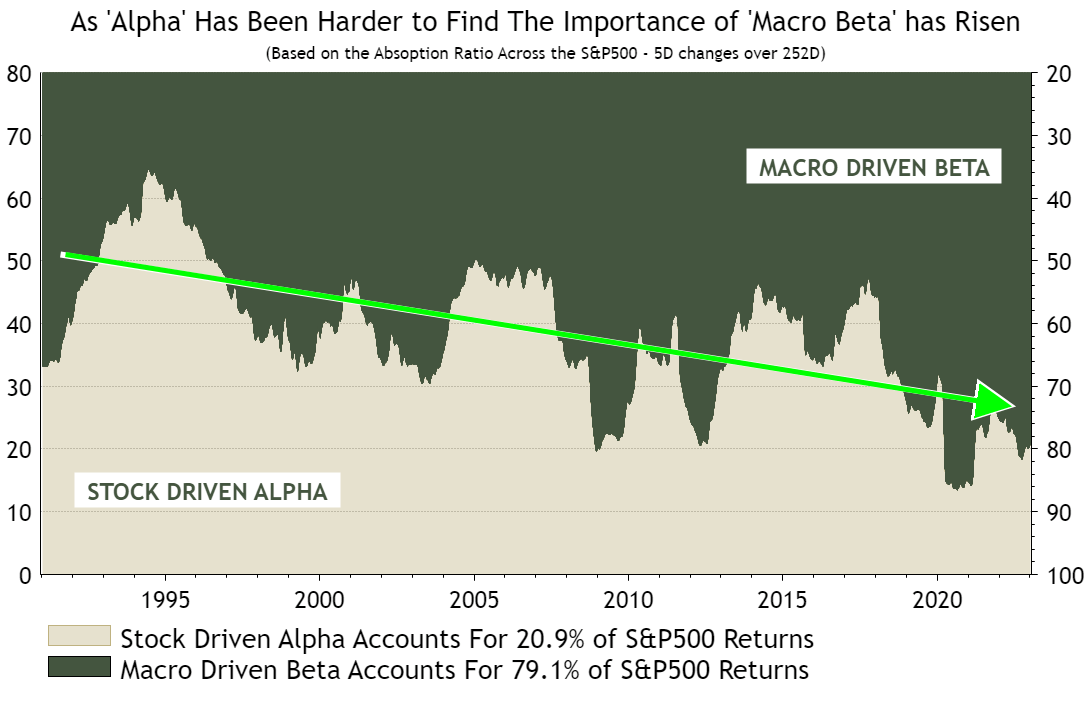
Another measure often linked to a stock picker’s market is correlation. Active investors' chances of success increase when correlation, a measure of how stocks move in relation to one another, is low as this suggests that company-specific rather than macroeconomic news is driving returns.
Charles Cara of Absolute Strategy Research, calculated the so-called “Absorption Ratio” for the S&P 500. This is a measure of how much individual stock moves can be explained by their three strongest common drivers. The more common drivers dominate, the more “top-down” the market was.
According to Mohamed El-Erian , president of Queens’ College, Cambridge, and an adviser to Allianz and Gramercy, it’s time to for “a partial return to à la carte selection after many years of widespread fixed menus.” The past decade investment outcomes were heavily influenced by a common global factor; the combination of artificially low interest rates and massive injections of central bank liquidity boosted virtually all assets (and favoured passive management). This translated in very high correlations. Given the ongoing shifts in the investing environment investors now need to pay more attention to individual security selection as correlations could be lower than they used to be.
Cost of concentration
The impact of correlation is however more nuanced (compared to dispersion). We already saw that low correlations favours active managers. But a case can be made that active managers that hold concentrated portfolios should prefer higher correlations. Higher correlations reduce the opportunity cost of a concentrated portfolio.
Active portfolios, in pursuit of higher returns, are typically more volatile than a simple index fund. To choose active management is to forgo a potential reduction in volatility. Active managers pay a cost of concentration , which rises when correlations are lower. Or put another way, the benefit of diversification is less when correlations are high. Rather than receiving a benefit from diversification, active managers incur a cost of concentration.
The cost of concentration is an opportunity cost—it represents the incremental volatility a manager accepts in order to pursue an active strategy.
If correlations are high, the incremental volatility associated with being less diversified and more concentrated declines.
Figure 5: Cost of concentration (S&P Global)
The cost of concentration is the ratio of average individual stock volatility to portfolio volatility.
Figure 6: Cost of concentration (S&P Global)
The cost of concentration fluctuates through time.
The most important question is now: How much higher do an active manager’s returns have to be in order to justify the incremental volatility he bears?
The required incremental rate of return is linked to the expected market return and ... the cost of concentration.
Figure 7: Required incremental return (S&P Global)
In the early 1990s, correlations were low, providing a large volatility reduction to index investors. After the global financial crisis, correlations were high. Investors in concentrated portfolios paid a low price in terms of incremental volatility. This lowered the required incremental return.
The next question is of course: how difficult is it to earn that required incremental return? We already saw that it’s easier to outperform when dispersion is high. So we can express the required incremental return in dispersion units (by dividing the required rate of return by the dispersion).
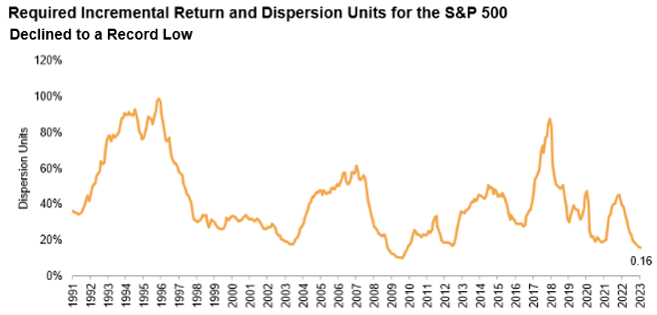
In the period from 1992 to 2019, on average, the incremental return required to justify a concentrated active portfolio amounted to 0.43 dispersion units. In the early 1990s, this rose to more than one, while after the global financial crisis it fell below 0.20.
The same happened at the start of this year.
What is the current outlook ?
At the end of July, dispersion was still high, while correlations dropped at bit.
Figure 9: Dispersion S&P 500 (S&P Global)
Figure 10: Correlation S&P 500 (S&P Global)
The required incremental return from a concentrated active portfolio (in dispersion units) increased a bit, but is still very low by historical standards.
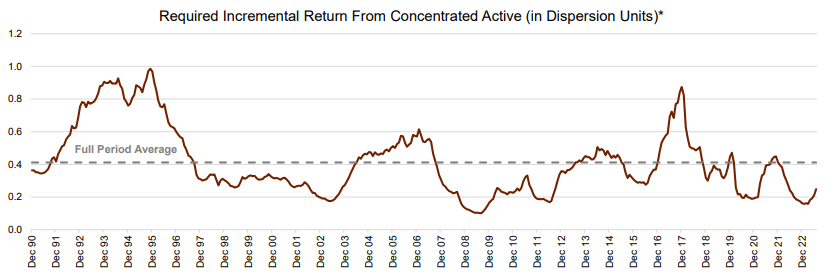
Goldman Sachs Hedge Industry VIP ETF
How should we play this stock picker’s market? We look for high conviction and high active share. Both are offered by the Goldman Sachs Hedge Industry VIP ETF . GVIP invests in fundamentally driven hedge fund managers’ “Very-Important-Positions,” which appear most frequently among their top 10 long equity holdings. GVIP offers investors “a way to follow hedge fund managers’ most important long equity ideas and gain exposure to dynamic market themes.”
GVIP has an expense ratio of 0.45% and a dividend yield of 0.74%.
How is the GVIP portfolio constructed? Among hedge funds that hold over $100 million in US listed stocks, fundamentally driven hedge fund managers (those with 10 – 200 distinct equity positions) are identified. Next, the 50 US-listed stocks that appear most frequently in the top 10 reported holdings of the fundamentally driven hedge fund manager universe are selected. Those 50 stocks are equally weighted at each quarterly rebalance. Between rebalance dates the stocks in the portfolio are allowed to float and as a result, the best performing stocks are showing up in the top 10.
Figure 12: Top 10 holdings (Goldman Sachs)
The sector allocation is a result of the bottom up stock selection. The biggest sectors are Technology, Financials and Communication Services.
Figure 13: Sector allocation (Goldman Sachs)
Technology and Communication Services are the most over-weighted in GVIP compared to the S&P 500.
Figure 14: Sector drift (ETFresearch.com)
And both sectors are in a long term uptrend.
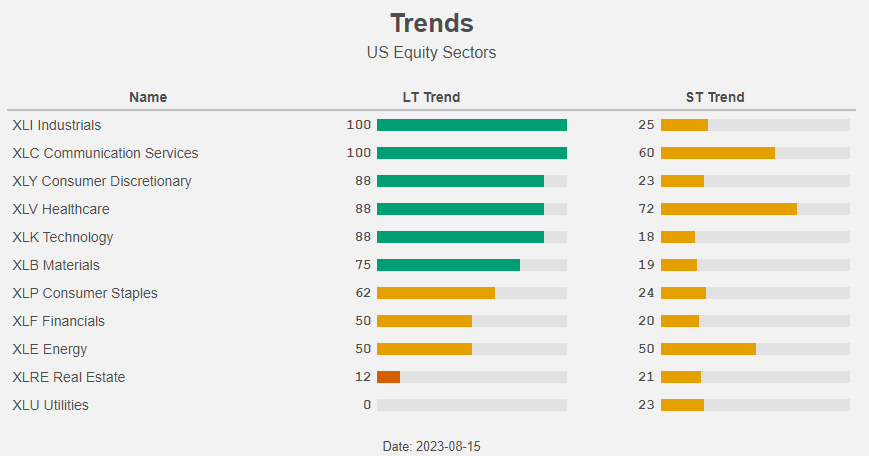
In the current stock picker’s market, GVIP is outperforming the S&P 500.
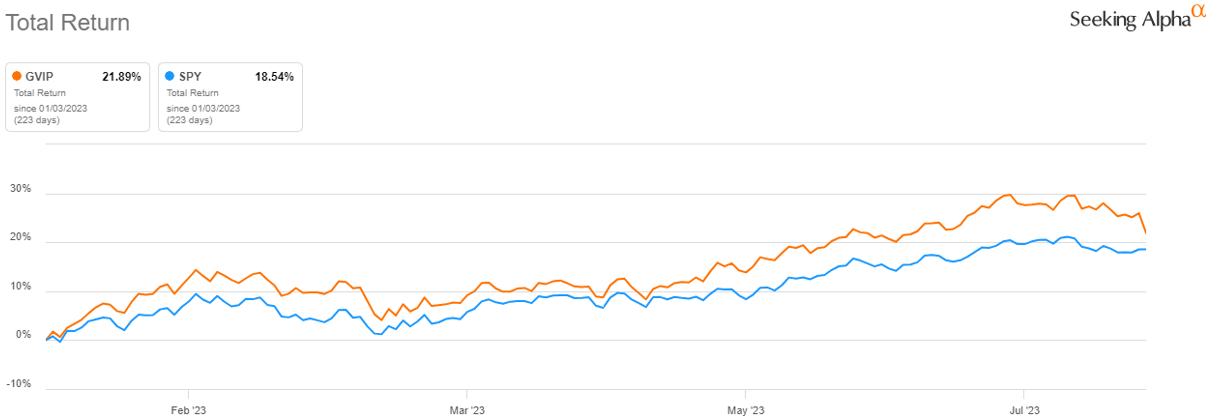
Conclusion
Given the high dispersion and the relatively high correlation, the opportunity set for active managers to outperform is big.
How should we play this stock picker’s market? We look for portfolios with high conviction and high active share. Both are offered by the Goldman Sachs Hedge Industry VIP ETF.
GVIP’s active share amounts to 77%. GVIP is a truly active fund. It invests in high conviction names (in a diversified way) in an environment that favours active management. GVIP is performing very well and we expect this nice performance to continue.
For further details see:
GVIP: A Diversified High Conviction Play For This Stock Picker's Market