HLAGF - Hapag-Lloyd: Multiple Inflection Points For Long-Term Industry
2023-08-23 09:00:00 ET
Summary
- Shipping and maritime logistics companies sold at record-high market values in 2022 due to supply chain challenges.
- Hapag-Lloyd experienced a decline in stock prices after the normalization of cargo and freight rates and paying out large dividends, but has potential for growth due to the higher rate.
- The company's financial performance in H1 FY'23 showed a reduction in revenue and transport volumes, but it still maintained profitability and generated significant cash flow.
- Net-net, the economic characteristics of the business are attractive, rate buy.
Investment summary
Covid-19, the notorious "supply chain headwinds" of 2022, plus record-high shipping and freight rates, saw shipping and maritime logistics companies sell at some of their highest market values on record last year, and into FY'23. The subsequent shareholder returns were bolstered by a combination of tremendous capital appreciation and eye-watering dividends, rewarding long-term equity holders.
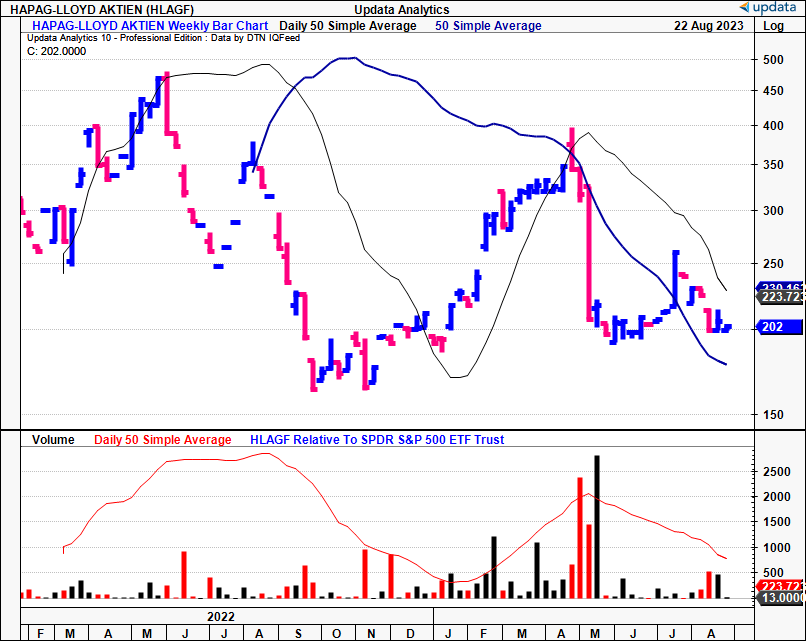
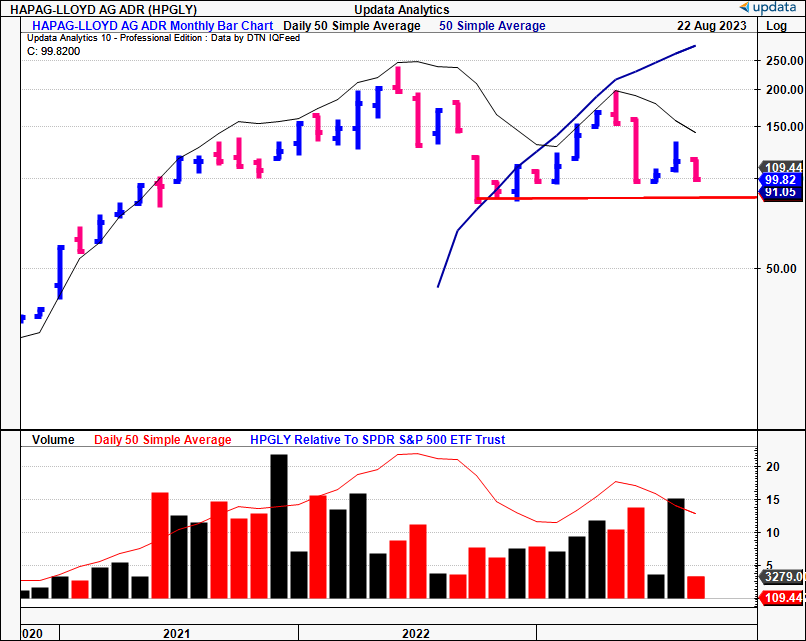
Hapag-Lloyd (HLAGF) was/is one such name. The container ship operator sold at its record highs of ~$470/share in 2022, before consolidating sharply after a mammoth $69/share dividend paid out to holders of its securities earlier this year, following a $37.50/share payout last year. Given the enormity of the payouts, it was expected to see HLAGF trade at compressed prices relative to its FY'22 and FY'23 highs. This, combined with 1) normalization of cargo + freight rates, 2) added supply of containers + vessels into the market these past 12 months, and 3) a projected increase in global container fleets, are reasons HLAGF has failed to catch a reasonable bid in the back end of H1 FY'23. HLAGF's two U.S. issues are observed below in Figure 1 and Figure 1a.
Figure 1.
Figure 1a. HLAGF Monthly Returns
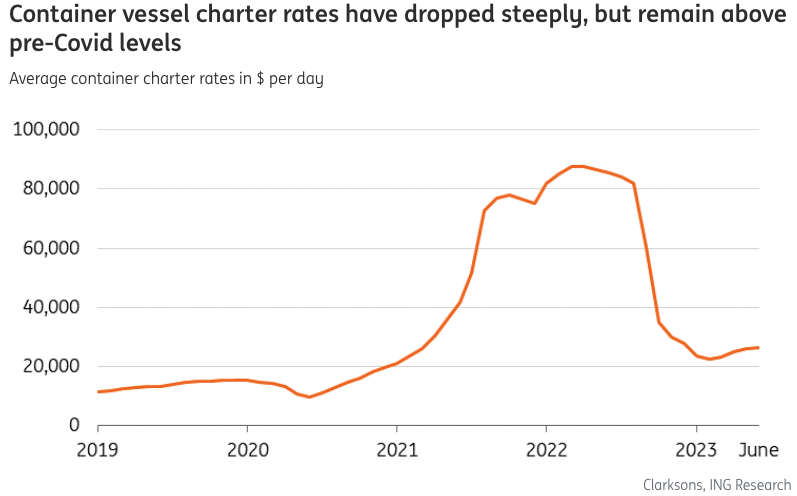
The decline in freight rates has mid-term structural implications on the shipping industry. But a number of identifiable tailwinds have the larger, well-capitalized players well-positioned within the industry to capture additional profitability and productivity growth into the coming 12 months. Capital spending is still strong-the 10 largest container operators had 440 vessels in the pipeline by the start of Q2 FY'23. These are of a larger tonnage and are set to replace smaller and older vessels in the global fleet. Moreover, vessel capacity-measured in 20-foot equivalents ("TEUs")-will increase with the larger tonnage. For example, in the last 5 years alone, more than 50 ships have been added to the global fleet with a 21,000+ TEU capacity already. Further, despite broader economic challenges, a good body of estimates suggests a return to 3% annualized growth in container trade demand by FY'24.
Capacity aside, container vessel spot rates have undoubtedly normalized below the highs seen in 2022. Critically, however, they are still elevated above pre-pandemic range. You're still looking at ~$2,000 per 40-foot equivalent ("FEU") in Europe in nominal terms, with similar pricing observed in Shanghai-U.S. spot rates as well.
Net-net, with the industry undergoing heavy consolidation over the past decade, along with exogenous factors such as fuel pricing, capacity, and container demand, in my opinion the heavy hitters such as HLAGF are attractive propositions to those seeking defensive allocations into the broad spectrum of industrials. I rate HLAGF a buy based on the reasons posted in this report.
Figure 2.
H1 FY'23 numbers the best colour for full-year expectations
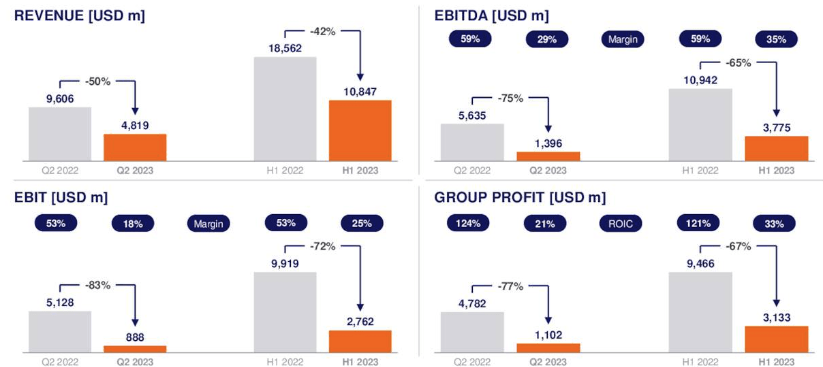
The company's latest numbers are integral to extrapolating the investment case, given the normalization of earnings and rates in 2023. HLAGF booked H1 revenue of $10.8Bn, a considerable 42% reduction [note: all figures will be quoted in $ USD unless otherwise stated] . Whilst this was on a difficult comps period in 2022, the decline predominantly stemmed from lower freight rates as depicted in Figure 2. But transport volumes were also down 3.4% YoY as well at 5.8Bn TEU. The most pronounced volume drops were observed in the Far East and Middle East routes. Intra-Asia trades saw upsides thanks to capacity redeployment as supply chains picked up speed once more.
Consequently, EBITDA and EBIT settled in at $3.8Bn and $2.8Bn, respectively. Analyzing all sources of income, the company clipped operating profits of $3.1Bn, although these were from non-core sources, instead attributed to interest income generated on its cash balances and marketable securities.
Figure 3.
As to the economics of rates and their impact to HLAGF in H1 FY'23, consider the following:
- The average trade rate during H1 was down 38% YoY, reaching $1,761 per TEU. Asia-linked connections faced the most substantial declines given the base effects from 2022. Simultaneously, the average bunker consumption price saw an 11% reduction, influenced by lower oil prices.
- Overall, unit costs were down 5% YoY, and pulled to $66 per TEU. Peak unit costs appeared to have been in Q4 FY'22 at $1,458 per TEU.
- One critical fact to consider is the amount of contract assets HLAGF has under multi-year agreements. This effectively cushioned the significant spot rate drops experienced over the year. The diversification of contracts also reduced the concentration risk to the top line.
- Related to points (1) and (2), the reduction in unit costs was underscored by tighter bunker pricing and lower handling and haulage costs as supply chains have once again normalized on the supply side. But inflation has still impacted costings for asset-heavy names, HLAGF included.
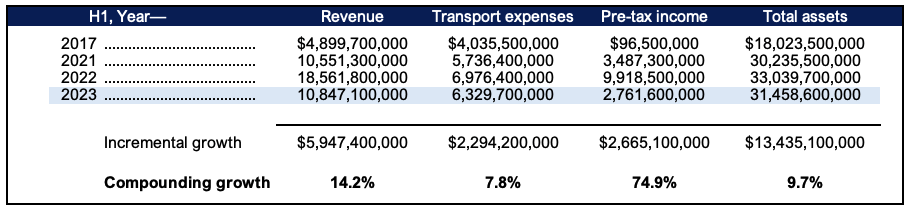
For a more level view of the company's high-level performance, comparisons to pre-pandemic times are necessary. For this, I've gone back to 2017 and noted the incremental changes across booked revenue, transport expenses, pre-tax income and total assets [Figure 4]. Comparing H1 2017-'23 removes the 2022 'anomalies'. You'll note several important points from this.
For starters, total revenues are up $5.95Bn across this time, and up ~$300mm from 2021. Moreover, incremental profit growth has outpaced transport costs, whilst it has added another $13.43Bn in total asset growth over this time. The compounding growth rates corroborate this data. Sales have grown at nearly double transport costs (14.2% vs. 7.8% respectively) whereas pre-tax income has surged ~75%, outstripping all measures. Certainly, rates are the main driver of the upsides. But what's critical is that, since 2021, overall numbers haven't leveled off by a significant amount.
Figure 4.
Returns on capital deployments/redeployments
A more thoughtful analysis beyond the market economics is required to extrapolate the investment value on offer. The company's own economic characteristics must be called into question.
Gross capital productivity
- For instance, the growth in total assets (both operating and non-operating) is driven in part by the tremendous cash surpluses obtained on its balance sheet. Cash and marketable securities jumped from a balance of $832mm in 2020 to $19.2Bn by Q1 this year. Here's where you can see HLAGF is on shareholders' side. It returned $6.5Bn in dividends to shareholders in Q2 last year, and further $12Bn to shareholders in Q2 2023.
- Capital recycling from operations to shareholders is a key factor for creating shareholder value over the long term. But the issue with such a broader asset base is the capital density employed into the business. Even stripping out the $7.4Bn in cash + marketable securities, you're still looking at $24.2Bn at risk in core assets (including goodwill) to maintain the current steady-state of operations. This is 1.36 turns on Q4 FY'20's number of $10.23Bn.
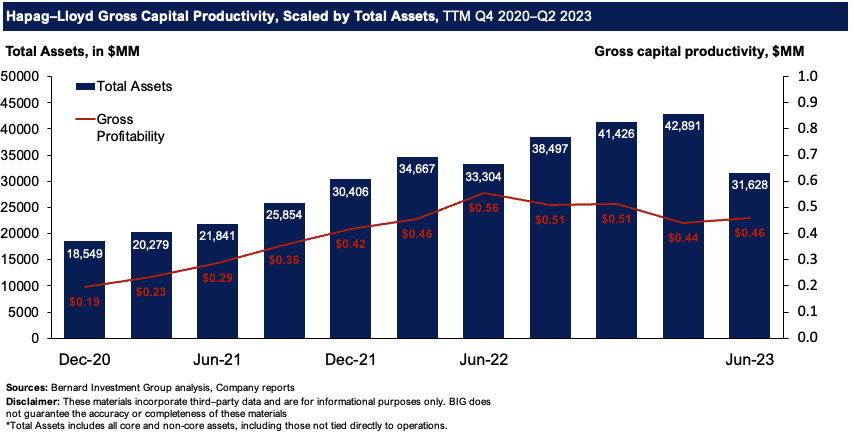
- Critically, HLAGF's gross profitability hasn't endured the same downsides seen in its underlying market rates. Figure 5 outlines the case in point. Here, gross profitability is defined as the gross capital productivity produced on all assets, taken as the TTM gross profit scaled by total assets each quarter. The firm has still returned $0.44-$0.46 on the dollar for every $1 in assets this YTD. Stripping 2022 values out, these are above average for the company. Hence, far more asset-heavy, but equally as profitable as 2.5 years ago.
Figure 5.
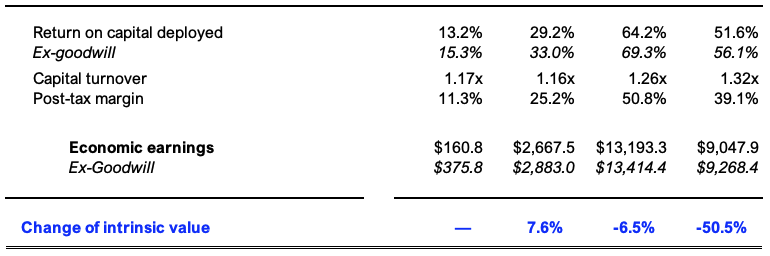
Returns on capital committed and at risk
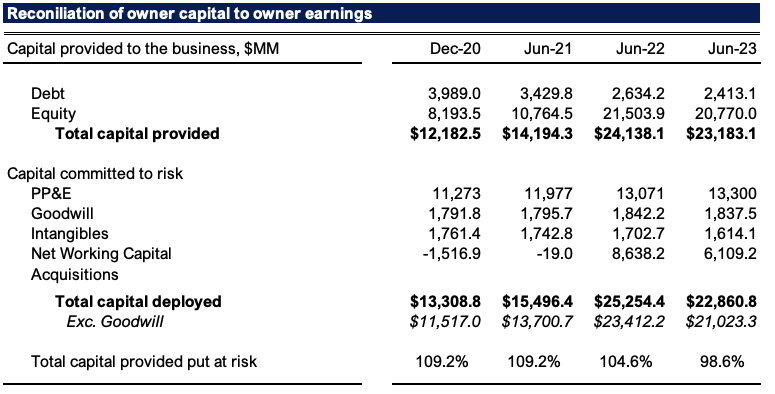
The above analysis outlines the firm's capacity to generate income, but doesn't explain the value-creation for shareholders. It still needs to redeploy capital into new investments, such as terminal participations, vessel acquisitions, expand its container fleet, and so forth. Figure 6 provides a more comprehensive view of this. Here I've disaggregated operating capital as a standalone item [forewarning-this is the most attractive feature in the buy thesis in my view].
First, investors have provided the company with $23.18Bn of capital (debt, equity), up from $12.18Bn in 2020
- You'll note, that as of Q2 FY'23, $22.8Bn of capital at risk produced $11.8Bn of post-tax earnings (TTM figures). Otherwise, $67/share post-tax on $130/share in capital deployed. This contrasts to $1.75Bn on $13.31Bn in 2020 ($10/share on $75/share invested).
- As such, it has committed ~100% of capital provided at risk, directly employed into business operations.
- It spun off $23.4Bn in cash to its shareholders last period (TTM figures), and $35.45Bn including all dividends paid up. This contrasts to $4Bn 2 years ago. The advancement is from working capital work-thru's,
One simply cannot ignore this outstanding growth in free cash attributable to HLAGF's shareholders. It supports further dividends, and allows for opportunistic reinvestment into avenues discussed earlier in this report. Including dividends paid, you've got a scenario where the firm's free cash production is just about matching the capital it has put at risk. Regardless of the headwinds in its markets-the firm is quite literally swimming in cash.
Figure 6.
The exhibit below is part of Figure 6.
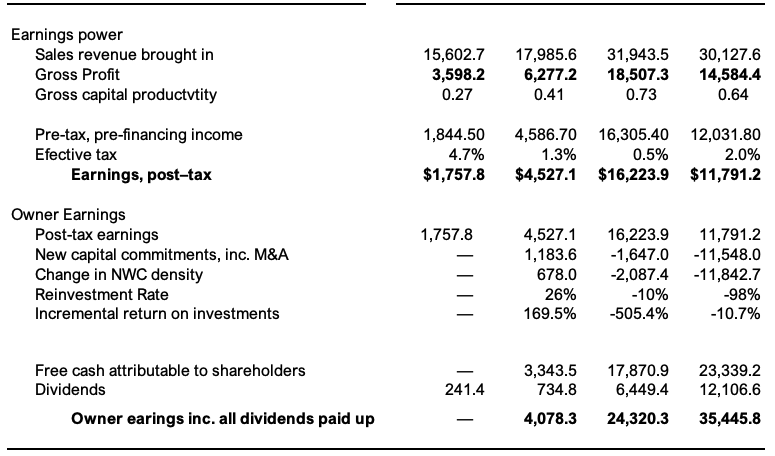
- The fact it has such vast sums of cash employed into its business operations, returning profits on these investments is absolutely paramount. As mentioned earlier, it produced $67/share TTM post-tax on $130/share in capital deployed last period, equating to a 52% return on capital. It has clipped 30-60% return on its core investments since 2021, giving the firm ample mobility to act opportunistically in redeploying the surplus capital into a higher cost and/or tighter market regime. Hence, it requires c.$22.8Bn invested to run the business, but it likely can pull back anywhere from 30-50% on this going forward in my opinion.
- Critically, the superb returns on capital employed are driven by a combination of post-tax margin growth and turns on the capital invested. Post-tax margins have leapt by ~14 percentage points these past 2 years despite the wind-back in shipping rates this year, from 25.2% to 39.1% (TTM values). Peak rates last year saw it clip ~51% after-tax margins. On these, it has maintained tremendous capital efficiency, turning over its capital investments by 1.3x last quarter, but it has been >1.15x the entire testing period.
This tells me two things. One, the firm has pricing power, and incorporates cost differentiation in its offerings-mainly products and ancillaries, including its new fuel sources-pricing at or above industry rates. This suggests it has a consumer advantage, and you see this in the long-term contract pricing it has locked in over the coming years. But at the same time, the fact it utilizes its operating capital so efficiently, it can afford to adopt a cost leadership position as well. Here it is able to price selective services-the asset-heavy ones-at below industry rates, without impacting any of its capital productivity. Hence, it also has a production advantage in my opinion, placing it at the tip of the spear relative to many of its competitors.
Consequently, the economic profitability is equally attractive on HLAGF's reported numbers. We're most interested in the economic earnings of a business as long-term investors. Ideally, seeing that we're buying the net asset value of a firm, you'd these "assets/capital" to produce returns above-market returns on capital (12% here, in line with long-term market rates).
HLAGF hits this mark for its investors, printing economic earnings of $9Bn last quarter, up from $2.6Bn in 2021, when freight rates began to kick off. Hence, the company is creating immense value for its shareholder in my opinion. The changes in intrinsic value are well explained by the return of capital to its shareholders these past 2 years, which are then reflected in the adjusted market value of the company ex-dividend.
Figure 7.
Valuation
The company sells at 2.8x trailing earnings and ~5.8x forward EBITDA. These are heavily compressed vs. the sector (85% and 47% respectively). It also sells at 1.7x book value and I'm attracted to this number as you're buying a decent portion of the firm's net assets at reasonable prices if paying this multiple.
More importantly in my view, is the market's correlation in price equilibrium to the company's implied market values, as seen in Figure 8. Implied intrinsic value is calculated as the return on invested capital multiplied by the company's reinvestment rate (ROIC x reinvestment rate). Applying the calculus to HLAGF you can see the correlation in market values to the implied valuations shown. Extending the calculus out to FY'24, I get to $38Bn in market value, another $4Bn on the market cap as I write. To me this supports a bullish view, and offers $17/share in potential upside.
Figure 8.
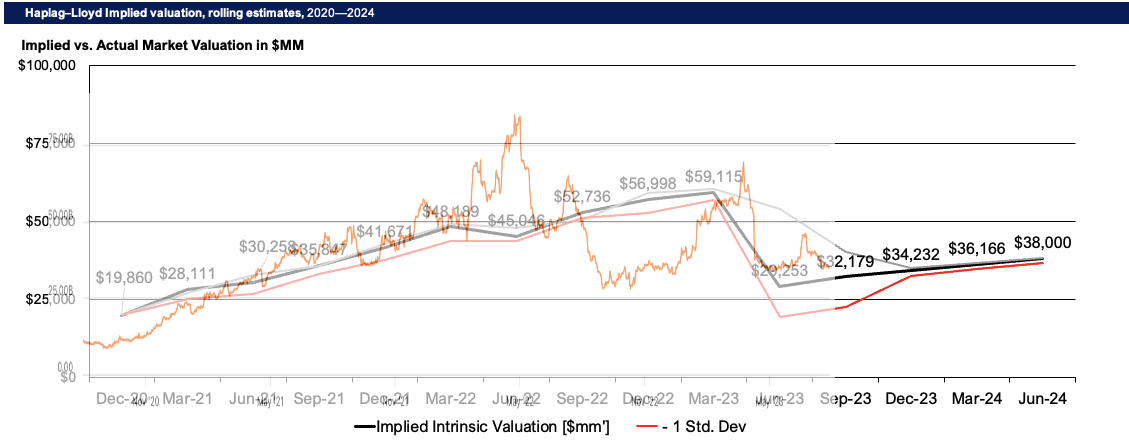
In short
Based on findings presented in this analysis, there are multiple value drivers that can see HLAGF continue rating higher over the coming 12 months. Key risks to the thesis are centered around what happens with the economics of the underlying shipping market. But consider that 1) freight rates are normalizing above pre-pandemic ranges, 2) capacity is increasing substantially, which is potentially beneficial to the shipping majors vs. those with smaller tonnage, and 3) profitability numbers haven't been hurt as much as it seems on face value. In my view, these factors have been priced in at the current market levels.
Added to this, HLAGF's economic characteristics are tremendously attractive in my view, and the company has stacks of cash to either redeploy into the business or return to shareholders. You can also pick the company up at 2.8x trailing earnings, almost unheard of in a company spinning off ~$35Bn in cash to its shareholders, dividends included. Net-net, rate buy, eyeing $38Bn as the initial price objective.
For further details see:
Hapag-Lloyd: Multiple Inflection Points For Long-Term Industry