HCA - HCA Healthcare: Best Nearby Healthcare Provider Cap-Gain Wealthbuilder Stock
2023-03-18 05:58:03 ET
Summary
- Portfolio wealth-building in today’s well-communicated, volatile, information-rich securities markets is most reliably obtained by an active investing strategy using price forecasts reaching less than a year, repeatedly.
- Competition for such information is high, carefully guarded, earned by extensive, expensive monitoring and exploration by well-informed teams of individuals able to compare prospects among wide investment alternatives.
- Defensive counter-information at the minutia and forecast levels countering useful conclusions requires evidences of conviction – best demonstrated by active commitments of capital.
- Those may be found in large-volume “block” stock transactions requiring Market-Maker negotiations between major “institutional” investors, done quickly and quietly to avoid front-running by “outsiders”.
- Trade pressure risk-exposure protections harness hedging in “derivatives” securities markets where real-money large bets defining both upper and lower price range expectations of buyers and sellers are revealed.
Our Investment Thesis
Is expressed in the above bullet-points, where the balance between sizes of near-term capital gains or loss expectations are put on a comparable basis. Then actual market subsequent prices provide histories (odds) of how well the forecasters have measured.
The effectiveness of market professionals’ expectations for HCA Healthcare, Inc. (HCA) in following the outcome of that analysis over investment-comparative alternatives makes reading the rest of this article worth your time and effort if you are interested in rates of near-term capital gains. Ones which are likely to be multiples of what market-index averages regularly offer.
Description of the Principal Investment Subject
“HCA Healthcare, Inc., through its subsidiaries, provides health care services in the United States. It operates general and acute care hospitals that offers medical and surgical services, including inpatient care, intensive care, cardiac care, diagnostic, and emergency services; and outpatient services, such as outpatient surgery, laboratory, radiology, respiratory therapy, cardiology, and physical therapy. The company also operates outpatient health care facilities consisting of freestanding ambulatory surgery centers, freestanding emergency care facilities, urgent care facilities, walk-in clinics, diagnostic and imaging centers, rehabilitation and physical therapy centers, radiation and oncology therapy centers, physician practices, and various other facilities. In addition, it operates psychiatric hospitals, which provide therapeutic programs comprising child, adolescent and adult psychiatric care, adolescent and adult alcohol, drug abuse treatment, and counseling services. The company was formerly known as HCA Holdings, Inc. HCA Healthcare, Inc. was founded in 1968 and is headquartered in Nashville, Tennessee.” - Source: Yahoo Finance
Yahoo Finance
Alternative Investment Competitor Rewards and Risks
Figure 1
blockdesk.com (used with permission)
Upside price rewards are from the behavioral analysis (of what to do right, not of errors) by Market-Makers [MMs] as they protect their at-risk capital from possible damaging future price moves. Their potential reward forecasts are measured by the green horizontal scale.
The risk dimension is of actual price drawdowns at their most extreme point while being held in previous pursuit of upside rewards similar to the ones currently being seen. They are measured on the red vertical scale.
Both scales are of percent change from zero to 25%. Any stock or ETF whose present risk exposure exceeds its reward prospect will be above the dotted diagonal line.
Best reward-to-risk tradeoffs are to be found at the frontier of alternatives down and to the right. As a market-index “norm” currently, the S&P500 Index ETF is at location [15]. The “frontier” of Risk vs. Reward continues through [[UNH]] at [12] and [[CI]] at [3] to [[QDEL]] at [2] and to [[NVCR]] at [4]. Our present primary interest is HCA at [9].
Is the added reward of NVCR worth the added risk, compared to HCA? A fuller description of investing considerations should add to investors’ decisions of the suitability and credibility of the available investment alternatives. Figure 2 presents some of those considerations, drawn from outcomes of prior MM forecasts having the same up-to-down earlier expectation proportions as those of today.
Figure 2
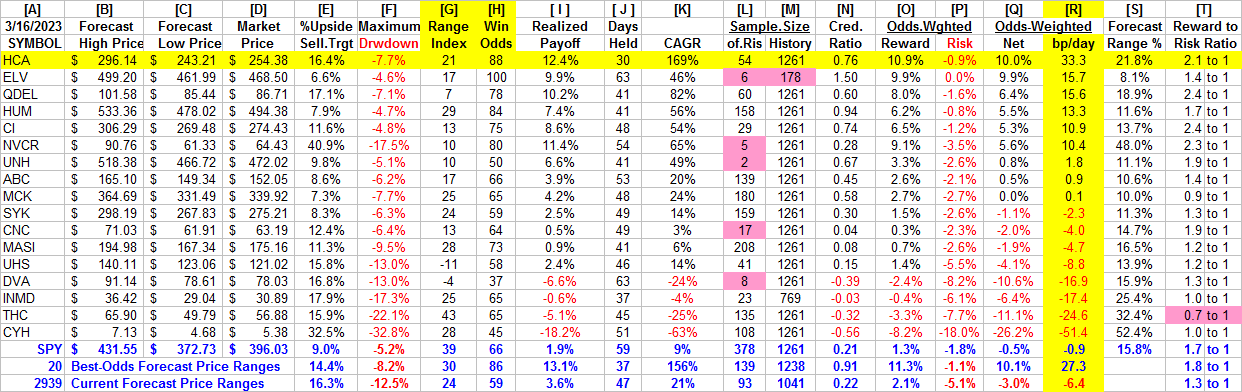
The advantage of determining Market-Maker forecasts for coming stock prices is that they offer many dimensions more than typical “street analyst” forecast of a single target-price at one point in time. Instead of only one higher (or lower) future price, the MM forecasts are drawn from market data valid across relevant (typically shorter) periods of time for both the upper [column B] and lower [C] price limits seen as likely to be encountered in such a period.
That range of coming prices for each investment candidate is clearly split into upside [E] and downside [F] prospects by it’s today market price [D]. We note what proportion of that whole forecast price range is between the today market quote and the low-end prospect, the downside exposure. We label that % of the range as the Range Index [RI] and note it in column [G] of Figure 2. It gets used to identify and average all prior RIs of similar size as a suitable sample of subsequent market outcomes in column [L], as a proportion of all price-range forecasts for the stock in the past 5 years of market days [M].
With those samples, scaled individually to each candidate’s relevant prior-sample outcomes, we now can make appropriate direct comparisons of answers to questions of:
How big a capital gain might be expected from this stock in the next few months? [ I ] Out of the sample, what are the Odds ( how likely ) that any one will be profitable? How long , on average, [J] might it take for a typical sample holding to come to a disciplined termination? In that average holding period, how bad an interim price drawdown might be experienced? How credible [N] is the current upside forecast [E] compared to what history realized [ I ]? Given [E] and [F], what is the current Reward to Risk [T] ratio?
Given that we are posed with a decision under the inevitable uncertainty of the future, no collection of answers or actual outcomes can be expected to prove perfection. But on balance they should help investors to tailor their candidate choices to best address the degree to which the data leads to the most satisfying outcomes, most of the time.
Trend of Market-Maker Price Range Forecasts
Figure 3
This is not a typical “technical analysis chart” of simple historical (only) observations. Instead it pictures the daily updated Market-Maker price range forecasts implied by live real-capital commitments in real time.
Its communicative value is present here by visual comparisons of the proportions of upside and downside price change expectations at each forecast date. Expectations of the market-making community, as influenced by the actions of interested and involved big-$ institutional investing participants.
Those forecasts are typically resolved in time horizons of less than a half year, and often in two months or shorter. This one states that in the prior 5 years 48 of the prior 58 forecasts like today’s, were profitable, completed in 33 market-days (6+ weeks) profitably at average +10.1% gains, a CAGR rate of 109%. No promises, just reassurances from history.
Here, where the objective is to find from the candidates in Figure 2 the biggest, quickest, most likely capital gain in the next 3 months with the least interim price drawdown distress, it appears that the logical choice is with HCA.
Conclusion
Comparing these investment candidates to choose the best near-term capital gain prospect, HCA Healthcare, Inc. appears to be far better suited at this point in time than all the others.
For further details see:
HCA Healthcare: Best Nearby Healthcare Provider Cap-Gain Wealthbuilder Stock