HDEF - HDEF: High-Yield Dividend ETF With FX Risks In The Mix
Summary
- HDEF favors developed world dividend stocks outside the U.S. and Canada (the EAFE group) demonstrating value (another way of saying, offering higher yields) and quality characteristics.
- In the current iteration, it pays special attention to financials and materials; the UK, Japan, and Switzerland form the top trio amongst the variety of developed markets represented.
- I am constructive on the CHF and JPY; the outlook for the GBP is more uncertain, with downside risks.
- HDEF deserves a Hold rating.
The Xtrackers MSCI EAFE High Dividend Yield Equity ETF ( HDEF ) offers exposure to the developed world (ex-North America) high-quality dividend-paying stocks with value characteristics manifested in above-average yields.
This is a concept I like, yet there are a few disadvantages as there is something to dislike about the fund's performance in the past, while there are FX risks in the mix that are not supportive of a bullish thesis.
Investment strategy
HDEF is managed passively, with the biannually-rebalanced market-cap-weighted MSCI EAFE High Dividend Yield Equity Index being the foundation of its strategy.
The MSCI EAFE Index, where the EAFE stands for Europe, Australasia, and the Far East, is the selection universe. To qualify for inclusion in the high-yield index, a stock must demonstrate dividend consistency coupled with an above-average yield. The index provider pays due attention to quality assessing Return on Equity, earnings variability, and the Debt/Equity ratio, as well as the recent twelve-month price performance. A maximum security weight cannot exceed 5%.
In many cases, the combination of a robust quality and above-average yield implies a company is mature, with steady cash flows and adequate financial position, yet with somewhat bleak growth as a higher yield correlates with cheaper valuation overall, which, in turn, reflects softer revenue and earnings growth prospects.
HDEF has an expectedly lower Price/Earnings ratio than the iShares MSCI EAFE ETF ( EFA ), yet there are still cheaper alternatives in the international dividend ETFs universe. Their performance will be discussed shortly.
Created by the author using data from Portfolio Visualizer
A pertinent remark worth making here is that before 13 February 2018, HDEF had an akin underlying index, with a critical difference being the currency hedge. Currency movements, in many cases mainly driven by the differences in monetary policies, are essential contributors to or detractors from returns, thus I believe it makes sense to ignore the performance data prior to March 2018.
In the current iteration, HDEF's portfolio includes 110 equities, with the major ten accounting for over 39%, which is a bit too high, yet the Risk profile overall is still relatively attractive owing to moderate standard deviation and tracking errors.
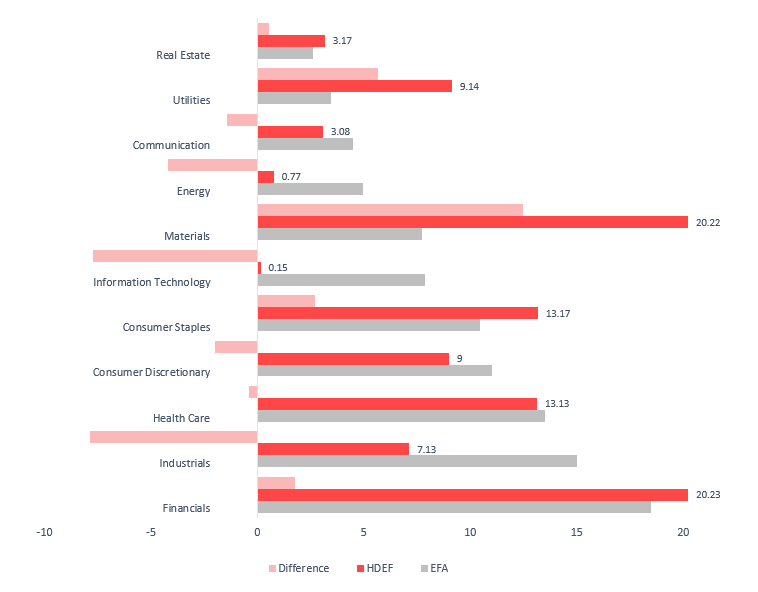
Compared to EFA, HDEF is much heavier in materials, mostly owing to its investments in the Sydney-quoted BHP Group ( BHP ) and London-quoted Rio Tinto ( RIO ), bellwether diversified miners with weights of about 5% and 3.4%, respectively. Both have been defying the bearish pressures this year, with BHP delivering over 15% price return and RIO gaining around 5.8% in New York, thus there is no coincidence they occupy 3th and 6th places in this market-cap-weighted portfolio.
The fund is also implicitly more bullish on utilities, consumer staples, and financials, while industrials and information technology are the two sectors HDEF is seemingly skeptical about; in the case of IT, the possible reason is inherently more expensive valuation and subsequently slimmer dividend yields that hindered more tech players from qualifying for inclusion in the underlying index.
Created by the author using data from the funds
For investors wondering why a high-yield ETF has just a trace amount of energy stocks, namely only two players Norwegian Aker BP ( DETNF ) and Austrian OMV ( OMVJF ), with a total weight of 77 bps, almost 4.2% lower than EFA has allocated to the sector at this point, I would offer an explanation that this is more likely the consequence of 1) the fund ignoring the U.S. and Canada, countries where petroleum players are aplenty, thus the chances of them qualifying are somewhat higher, 2) the oil price rollercoaster of the 2010s and early 2020s taking its toll on many dividend stories in the petroleum industry, while the fund favors dividend consistency.
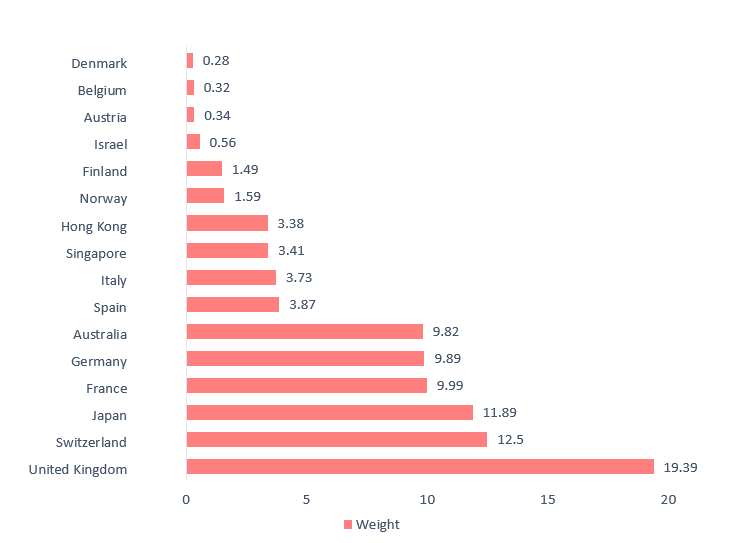
Turning to geographic footprint, the fifteen major countries in the mix are as follows:
Created by the author using data from the fund
As can be seen, the fund is enamored of the UK, Swiss, and Japanese equities, with the footprint in the euro-denominated assets being also fairly substantial. Obviously, a few remarks on the FX exposures are necessary.
First, the embattled pound sterling. On December 15, the Bank of England upped the interest rate by 50 bps to 3.5%, notching the ninth increase in a year. For better context, the annual inflation was reported at 10.7% in November vs. 11.1% in October. I believe the rate could peak at 4.5% in 2023, which in my view is not enough for a GBP bull thesis.
Now, the Swiss franc question. Also on December 15, the Swiss National Bank raised the interest rate by 50 bps to 1% to offset the inflationary pressures. Additionally, the central bank has been battling imported inflation by intervening in the FX market to support the CHF appreciation. With 3% inflation remaining a concern, justifying more tightening from the SNB, I am optimistic about this safe haven currency's performance vs. the dollar next year, so exposure to the franc is also a positive for the fund rather than a negative.
Next, the yen. Perhaps, the sluggish period for the Japanese currency is over, as inflation in the country has become a bit unnerving, especially when it comes to food and electricity prices. For context, the Bank of Japan has recently amended its bond yield control program, which some investors considered a prelude to further tightening of credit conditions, potentially allowing the ailing yen to continue recovering from the record lows touched earlier this year. In this regard, about 11.9% allocated to Japan is also more of a positive for HDEF.
Peer comparison. Remarks on performance
During the March 2018 - November 2022 period, assuming 2022 has been nothing short of challenging, HDEF delivered a comparatively strong performance, with a compound annual growth rate being 1.68% above the one clocked by the SPDR S&P International Dividend ETF ( DWX ). Unlike HDEF, DWX does not ignore Canada and a few emerging markets. HDEF has also grossly outperformed the Global X SuperDividend ETF ( SDIV ), which has delivered the worst total return coupled with the highest standard deviation in the group selected. SDIV has lost more than a quarter since the beginning of 2022.
| Portfolio |
| HDEF |
| SDIV |
| FGD |
| IDV |
| EFA |
| DWX |
| IVV |
| Initial Balance |
| $10,000 |
| $10,000 |
| $10,000 |
| $10,000 |
| $10,000 |
| $10,000 |
| $10,000 |
| Final Balance |
| $10,829 |
| $6,246 |
| $11,281 |
| $10,932 |
| $11,009 |
| $10,007 |
| $16,323 |
| CAGR |
| 1.69% |
| -9.43% |
| 2.57% |
| 1.89% |
| 2.04% |
| 0.01% |
| 10.87% |
| Stdev |
| 17.93% |
| 26.33% |
| 21.95% |
| 20.68% |
| 17.88% |
| 15.51% |
| 18.63% |
| Best Year |
| 25.00% |
| 13.01% |
| 20.77% |
| 23.56% |
| 22.03% |
| 19.59% |
| 31.25% |
| Worst Year |
| -12.71% |
| -23.66% |
| -11.33% |
| -9.26% |
| -13.76% |
| -12.27% |
| -13.18% |
| Max. Drawdown |
| -24.71% |
| -49.33% |
| -34.37% |
| -30.19% |
| -27.58% |
| -24.12% |
| -23.93% |
| Sharpe Ratio |
| 0.11 |
| -0.27 |
| 0.17 |
| 0.14 |
| 0.13 |
| 0 |
| 0.58 |
| Sortino Ratio |
| 0.17 |
| -0.32 |
| 0.24 |
| 0.19 |
| 0.19 |
| 0 |
| 0.87 |
| Market Correlation |
| 0.81 |
| 0.8 |
| 0.81 |
| 0.82 |
| 0.89 |
| 0.82 |
| 1 |
Created by the author using data from Portfolio Visualizer
At the same time, both the First Trust Dow Jones Global Select Dividend ETF ( FGD ) and iShares International Select Dividend ETF ( IDV ) outperformed HDEF marginally; the key strategy difference worth highlighting is that, unlike the Xtrackers fund, both FGD and IDV hold Canadian and South Korean stocks.
Another disappointment is that the iShares MSCI EAFE ETF, which tracks the index that is essentially a selection universe for HDEF, with numerous holdings having soft quality and not even dividend-paying, also had a bit stronger total return coupled with lower standard deviation and higher risk-adjusted return (the Sharpe and Sortino ratios in the table above). Finally, despite dismal 2022, the iShares Core S&P 500 ETF ( IVV ) is anyway unrivaled, with the highest CAGR, moderate standard deviation, and the most attractive risk-adjusted returns; 2019 (a 31.25% return) was the most significant contributor to that CAGR.
Final thoughts
HDEF favors developed world dividend stocks outside the U.S. and Canada (the EAFE group) demonstrating value (another way of saying, offering higher yields) and quality characteristics, paying special attention to the financial and materials sectors. Its interpretation of the value factor has produced relatively strong returns this year (by the bear market standards) despite the persistent FX pressure stemming from the inflation and interest rates issues. Its 5.4% dividend yield is comparatively solid; the expense ratio of 20 bps is modest. The principal risk I see at this point is exposure to the pound. Anyway, HDEF is a solid ETF, so it is a Hold.
For further details see:
HDEF: High-Yield Dividend ETF With FX Risks In The Mix