HDEF - HDEF Vs. 4 International Dividend ETFs
2023-03-14 08:45:22 ET
Summary
- HDEF is a global dividend ETF with a 5% yield.
- The U.K. is the heaviest country in the portfolio.
- The top sectors are financials and materials.
- I compare it to 4 non-hedged international dividend ETFs.
- Total return is average, but the dividend growth rate has outpaced inflation for 5 years.
This article series aims at evaluating ETFs regarding the relative past performance of their strategies and quality of their current portfolios. As holdings and their weights change over time, updated reviews are posted when necessary.
HDEF strategy and portfolio
The MSCI EAFE High Dividend Yield Equity ETF ( HDEF ) has been tracking the MSCI EAFE High Dividend Yield Index since 8/12/2015. It has a portfolio of 112 stocks, a 12-month yield of 5.27% and a total expense ratio of 0.20%. It pays quarterly distributions.
As described in the prospectus,
The Index is designed to reflect the performance of equities (excluding REITs) in its parent index, the MSCI EAFE Index, with higher dividend income and quality characteristics than average dividend yields of equities in the parent index, where such higher dividend income and quality characteristics are both sustainable and persistent .
HDEF is mostly invested in large and mega-cap companies (90% of asset value). Europe represents about 70% of assets. The heaviest country in the portfolio is the U.K. with 19%, followed by Switzerland and Japan, tie at 12%. Germany, France and Australia are between 9% and 11%. Other countries are below 4%. The next chart plots the top 10 countries, representing 88% of assets in aggregate. Hong Kong weighs about 3%, so direct exposure to geopolitical and regulatory risks related to China are low.
Country allocation (chart: author; data: DWS)
The top two sectors are financials and materials, almost in equal weight at about 20%. Consumer staples, healthcare and consumer discretionary are between 10% and 13%. Other sectors are below 9%.
Sector breakdown (chart: author; data: DWS)
The top 10 holdings, listed below, represent 37.3% of asset value. None of them weighs more than 5%, so risks related to individual stocks are moderate.
| Ticker |
| Name |
| Weight% |
| Country |
| Sector |
| ULVR LN |
| Unilever PLC |
| 4.72 |
| GB |
| Consumer Staples |
| BHP AT |
| BHP Billiton Ltd |
| 4.71 |
| AU |
| Materials |
| SAN FP |
| Sanofi-Aventis |
| 4.66 |
| FR |
| Health Care |
| NOVN VX |
| Novartis AG-Reg |
| 4.39 |
| CH |
| Health Care |
| ALV GY |
| Allianz SE-Reg |
| 4.05 |
| DE |
| Financials |
| RIO LN |
| Rio Tinto PLC |
| 3.27 |
| GB |
| Materials |
| ZURN VX |
| Zurich Insurance Group AG |
| 3.02 |
| CH |
| Financials |
| IBE SQ |
| Iberdrola SA |
| 3.00 |
| ES |
| Utilities |
| GSK |
| GSK Plc |
| 2.94 |
| US |
| Health Care |
| CS FP |
| AXA SA |
| 2.52 |
| FR |
| Financials |
HDEF vs. competitors
I will compare the fund’s valuation and performance metrics with four competitors:
- SPDR S&P Global Dividend ETF ( WDIV ), reviewed here,
- WisdomTree Global ex-U.S. Quality Dividend Growth Fund ( DNL ), reviewed here,
- First Trust Dow Jones Global Select Dividend ETF ( FGD ), reviewed here,
- iShares International Select Dividend ETF ( IDV ).
I consider them close competitors because they share these characteristics:
- international equity exposure,
- yield above 4.5%,
- no currency hedge*.
* I have explained in a recent article why currency-hedged funds should not be compared with non-hedged funds.
The next table reports valuations ratios for the five funds. A note of caution though: these ratios are heavily biased by sector breakdowns, and to a lesser extent by country allocations. For example, the two heaviest sectors in DNL are technology and consumer discretionary. Valuation ratios are usually expensive in these sectors for various reasons. In particular, they are intensive in intangible assets, which are not correctly accounted for in the usual value metrics. Financials are the heaviest sector in the other funds, with 20% to 45% of asset value. Valuation ratios of financial companies are often very cheap, but much less reliable than in other sectors.
| HDEF |
| WDIV |
| DNL |
| FGD |
| IDV |
| Price / Earnings TTM |
| 9.84 |
| 11.13 |
| 20.65 |
| 7.19 |
| 5.56 |
| Price / Book |
| 1.5 |
| 1.04 |
| 4.43 |
| 0.87 |
| 0.98 |
| Price / Sales |
| 0.91 |
| 0.8 |
| 2.37 |
| 0.69 |
| 0.82 |
| Price / Cash Flow |
| 6.47 |
| 8.53 |
| 15.13 |
| 4.93 |
| 4.65 |
S ource: Fidelity
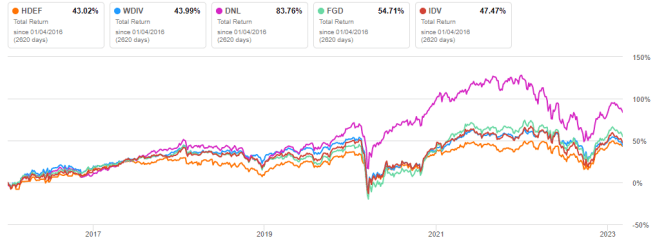
HDEF is on par with WDIV in total return since 1/1/2016, close behind FGD and IDV (see next chart). DNL is the best performer.
HDEF vs. Competitors, total return since 2016 (Seeking Alpha)
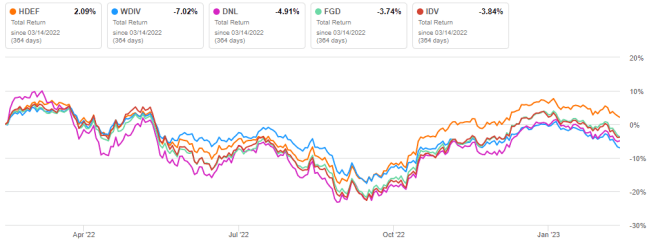
However, HDEF has been the best performer in the last 12 months, and the only one in positive territory:
HDEF vs. Competitors, total return in the last 12 months (Seeking Alpha)
The next table reports the annual sum of distributions per share in 2017 and 2022. DNL has been excluded because of an exceptional distribution in 2022. Otherwise, DNL distribution has been flattish: despite its name, it is not a dividend-growth fund. Also, 2016 has been excluded because of another exceptional distribution by HDEF.
| Dist./share $ |
| HDEF |
| WDIV |
| FGD |
| IDV |
| 2017 |
| 0.83 |
| 2.56 |
| 1.06 |
| 1.53 |
| 2022 |
| 1.18 |
| 3.00 |
| 1.26 |
| 1.99 |
| Growth |
| 42.17% |
| 17.19% |
| 18.87% |
| 30.07% |
HDEF has the best 5-year distribution growth rate with 42% (it is 7.3% annualized). From 2017 to 2022, the cumulative inflation has been about 20% (based on CPI). Only HDEF and IDV have outpaced it.
Takeaway
HDEF holds 112 international dividend stocks, mostly large companies. The top three countries are the U.K., Switzerland and Japan. Financials and materials are the heaviest sectors in the portfolio, with about 20% of asset value for each. Compared to four competitors, HDEF shows an average total return, but it has been the best at increasing distributions.
For further details see:
HDEF Vs. 4 International Dividend ETFs