WE - Head And Shoulders Everywhere As Technology And Real Estate Breakdown
2023-09-24 08:32:59 ET
Summary
- Weekly highlights of our ongoing market observations, MDA stock breakout picks, zombie stocks, ETF trading, Dow picks, and long-term value selections throughout the year.
- Technology and Real Estate sectors are showing breakdown patterns, indicating potential support level tests.
- The rising US dollar and the performance of "zombie" firms are contributing to market weakness.
- As interest rates are rising to the highest levels in 22 years, "zombie" stocks with higher than average credit risk levels may be an important focus.
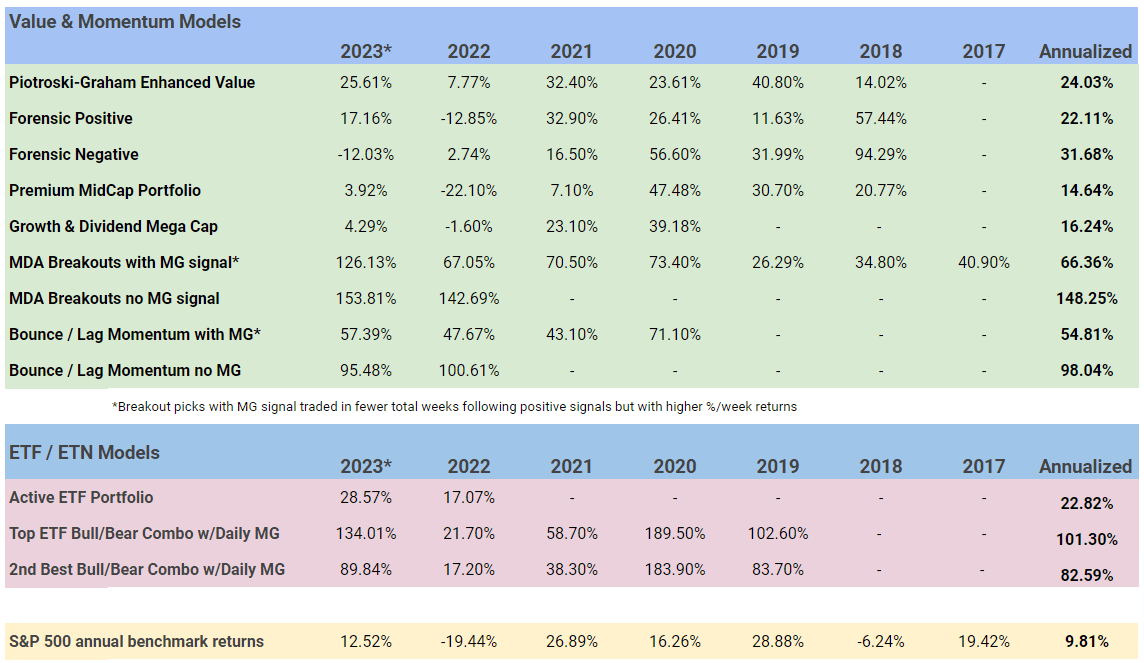
- Long Term January portfolios: Piotroski +25.6%, Positive Forensic +17.2%, Mid-year Growth & Dividend +4.29% and Active ETF up +28.5% YTD.
September Market Report Week 39 - 2023
The weekly summary article highlights some of our ongoing market observations, MDA stock breakout picks, zombie stocks, ETF trading, Dow picks, and long-term value selections throughout the year.
Introduction
My regular articles now follow this schedule while my IG articles will continue unchanged with the higher frequency.
| Weekly MDA Breakout picks (from JD) |
| Once a month |
| Weekly Dow 30 stock picks |
| Once a month |
| Weekly ETF / ETN picks from MDA model |
| IG only |
| Weekly Bounce/Lag Momentum picks (bonus from Grant) |
| IG only |
| Daily Market and Momentum Gauge Signals |
| IG only |
| Monthly Growth & Dividend mega cap picks |
| IG only |
| Long-Term Value Portfolios |
| Semi-Annually |
Head / Shoulders Topping Signals
Prominent head and shoulders topping patterns were key warning signals back in August and we are seeing more strong confirmations into September, the worst month of the year on average since 1927. It all started to unravel when the US credit rating was downgraded for the first time in more than decade ending the longest positive Momentum Gauge signal for the year back in July. That negative signal at peak levels set the "Head" for many of these technical topping patterns over the next several months as I detailed back in early August:
- US Debt Downgrade And Apple Breakdown, Major Catalysts For A Cyclical Pullback
- Forecasting The S&P 500 For 2023: Year Of The Fed-Pivot And More Record Volatility
Twitter.com
As Investopedia describes it,
Head and Shoulders Patterns are rarely perfect, which means there may be some noise between the respective shoulders and head.
However, these are some of the most textbook patterns I have ever seen in over 30 years of trading stocks. Each of the funds highlighted below is in different stages of the breakdown pattern toward prior support levels. These price patterns are caused by the underlying stocks within each fund that are also in different stages of validating the breakdown patterns and should be evaluated individually.
I. Technology Sector charts
( BULZ ) MicroSectors Solactive FANG Innovation 3X Leveraged ETNs has inverse fund ( BERZ ) that is doing very well into September for our active ETF portfolio. This ETN fund tracks the prices of the 15 largest US technology stocks
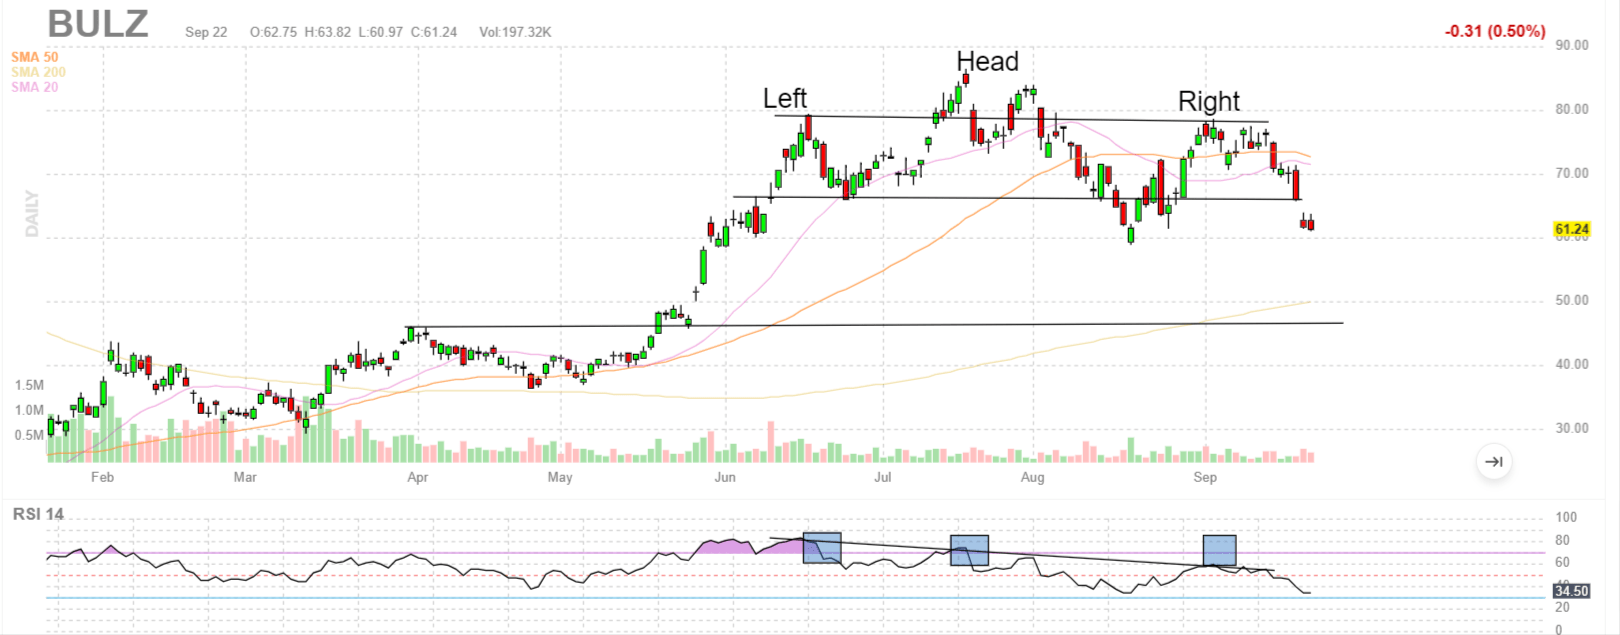
This fund is an equal weighted index of ( AAPL ), ( ADBE ), ( AMD ), ( AMZN ), ( AVGO ), ( CRM ), ( GOOGL ), ( INTC ), ( META ), ( MSFT ), ( MU ), ( NFLX ), ( NVDA ), ( QCOM ), ( TSLA ).
Related to the mega cap technology stocks we see the same pattern in the ( ARKK ) ARK Innovation ETF but moving closer and faster to May support levels.
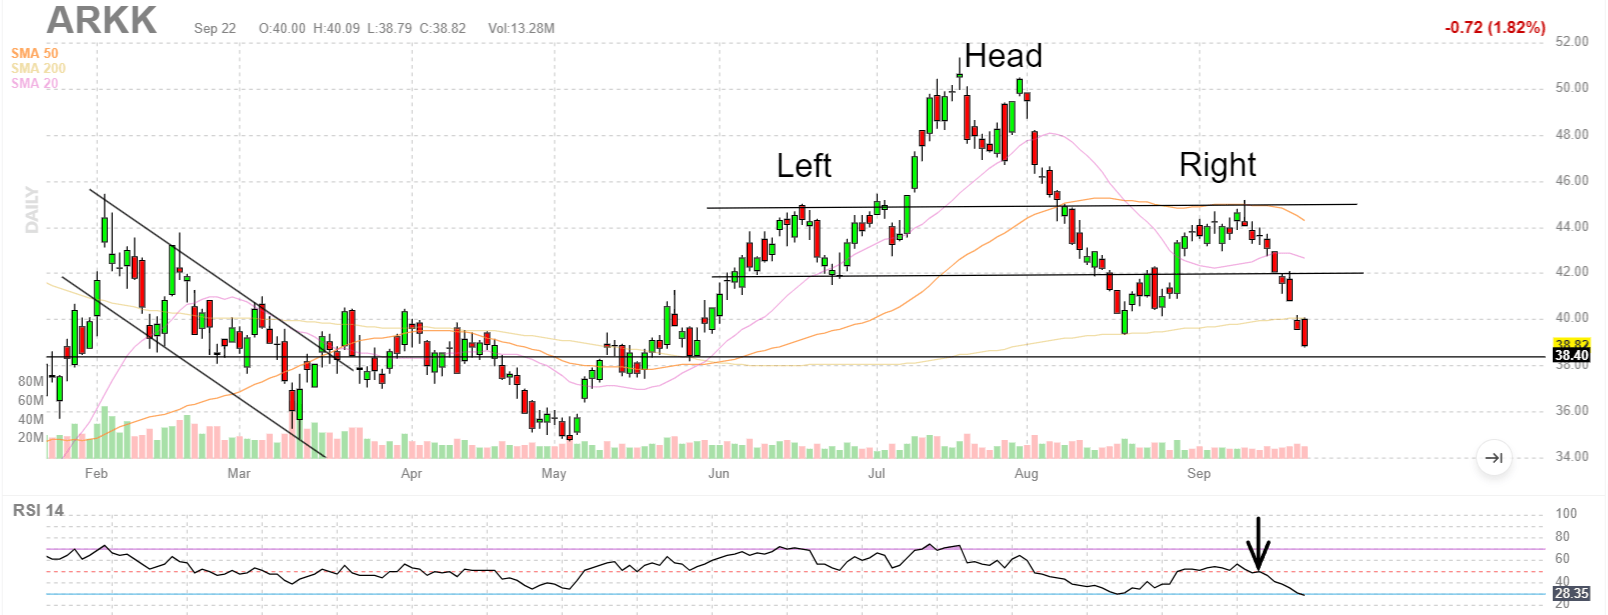
The broader technology fund ( TECL ) Direxion Daily Technology Bull 3X Shares also show a mix in performance between the ARKK and mega cap BULZ fund.
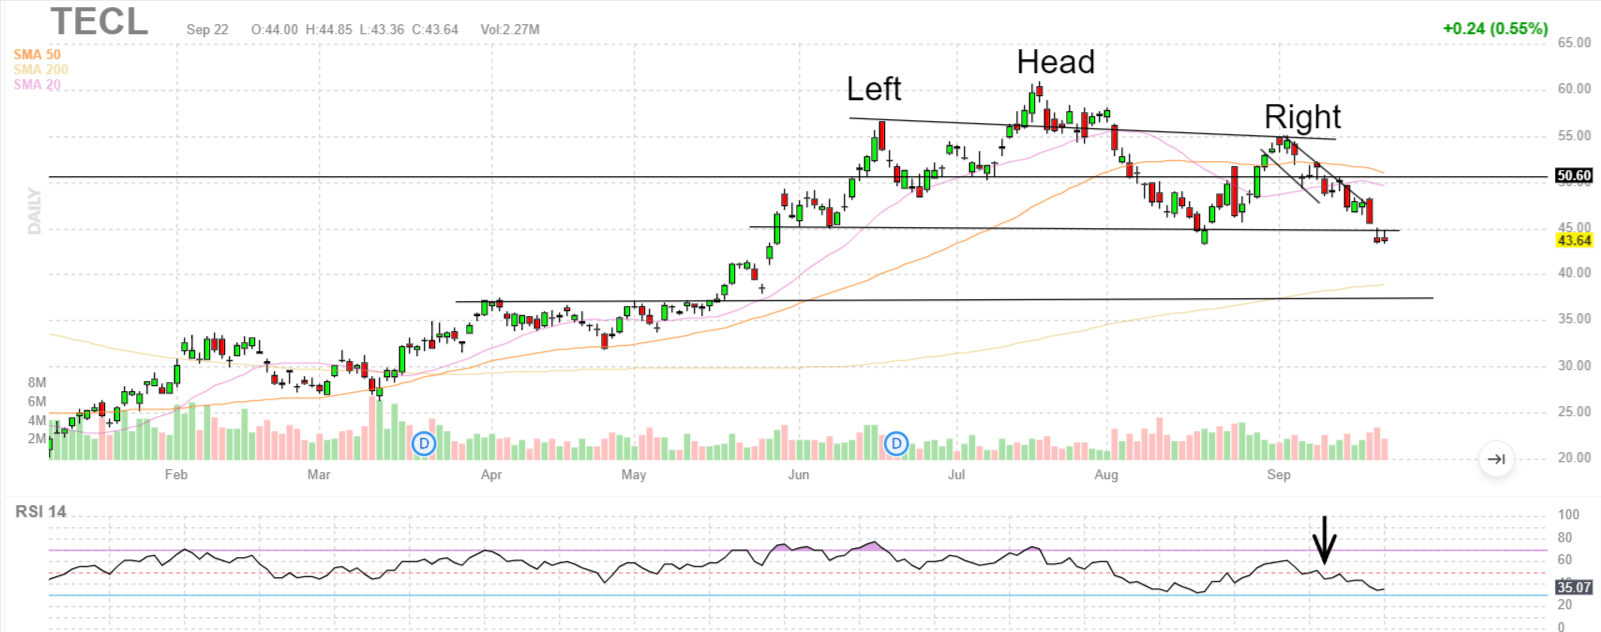
II. The Real Estate / Homebuilding sector
In the real estate sector and related funds we are seeing many of the same breakdown patterns continuing from the July peaks.
( NAIL ) Direxion Daily Homebuilders & Supplies Bull 3X Shares shows an advanced head/shoulder topping pattern already testing May highs for initial support.
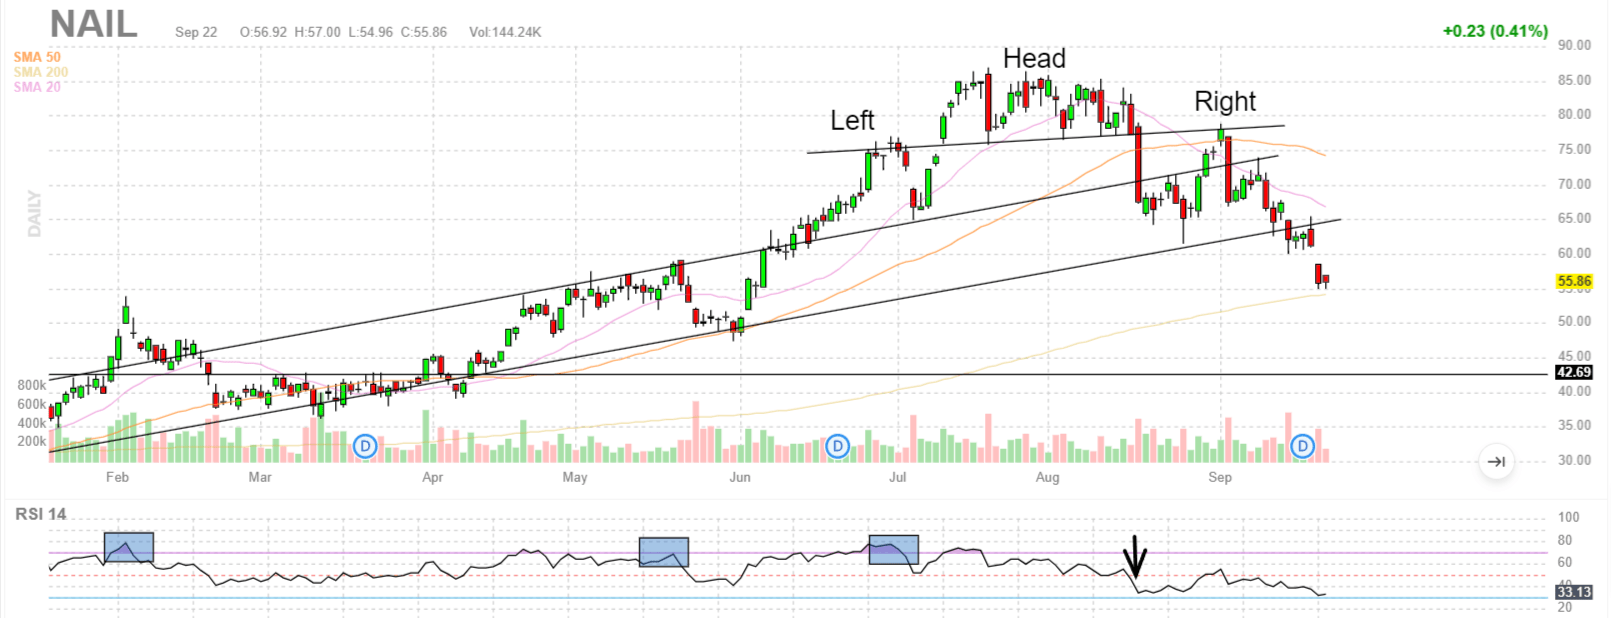
( REIT ) ALPS Active REIT ETF shows a sharp breakdown just starting this last Thursday to confirm the right shoulder of the breakdown pattern.
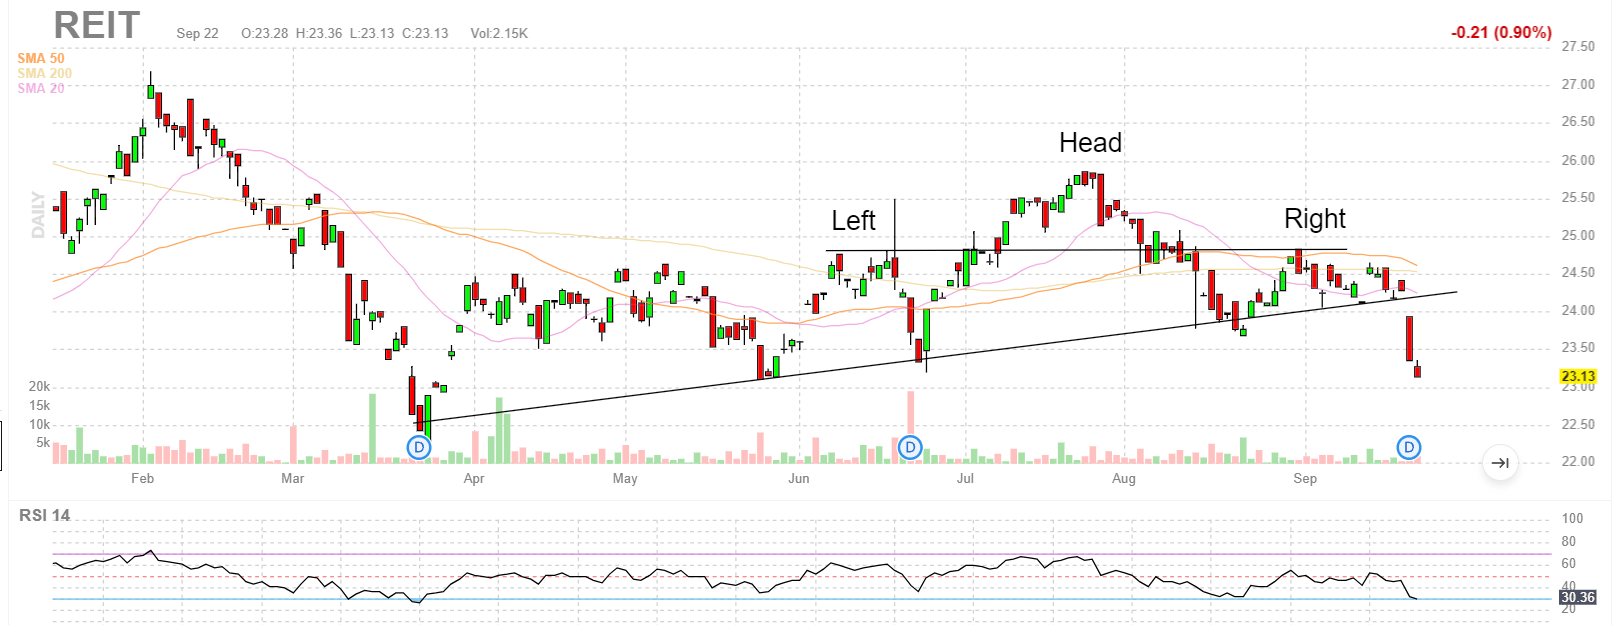
III. Other Sectors Impacted
These classic head/should breakdown patterns are not limited to Technology and Real Estate as we near the end of September. Other sectors and industries are showing some related conditions and others have not yet confirmed a right shoulder.
The ( BETZ ) Roundhill Sports Betting & iGaming ETF broke sharply below key support on Thursday and could accelerate lower to next support levels in the coming days.
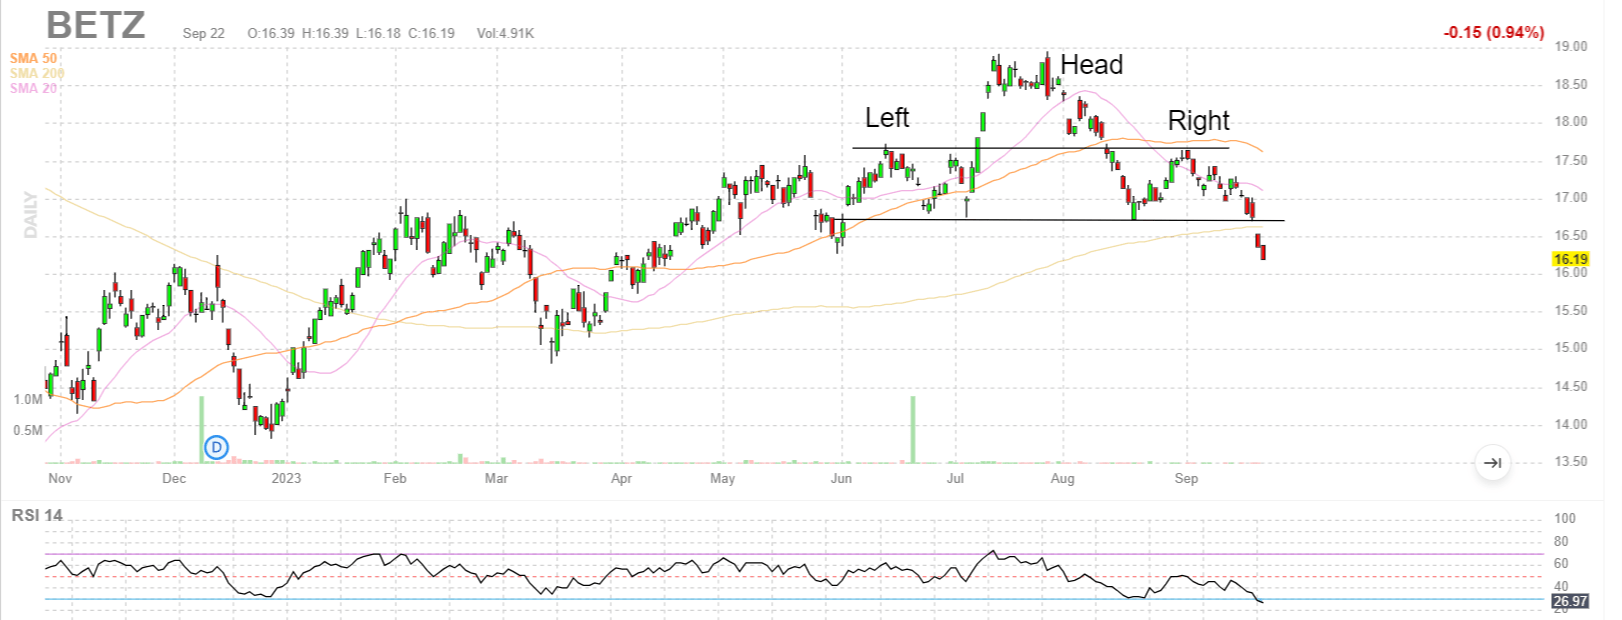
Among the largest holdings in the Roundhill Sports Betting fund are ( DKNG ), ( PENN ), ( FLTR ), ( ENT ), ( CZR ), ( CHDN ) with 39 holdings as September 22nd. A strong inverse fund to BETZ is ( HDGE ) AdvisorShares Ranger Equity Bear ETF
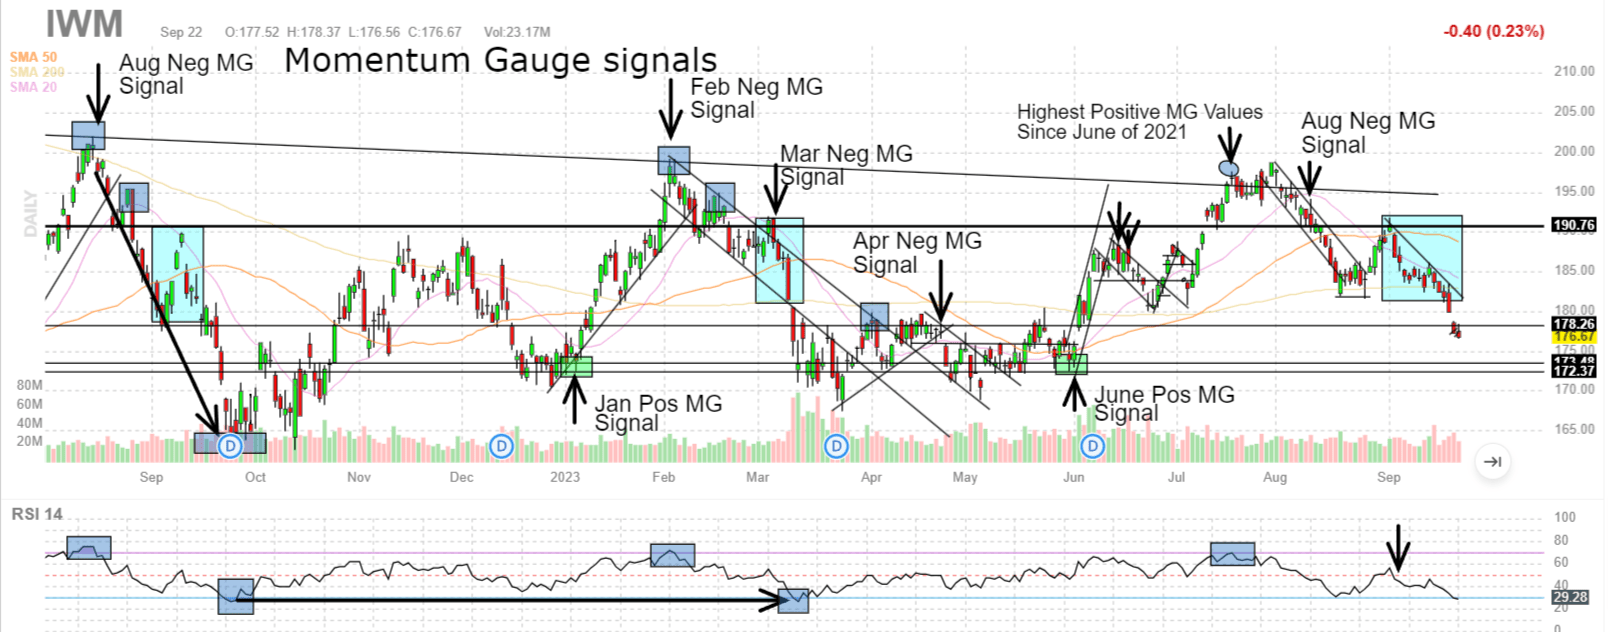
As I reported last time, we are tracking the daily and weekly Momentum Gauge signals that continue to confirm nearly identical prior market tops from both February and last September.
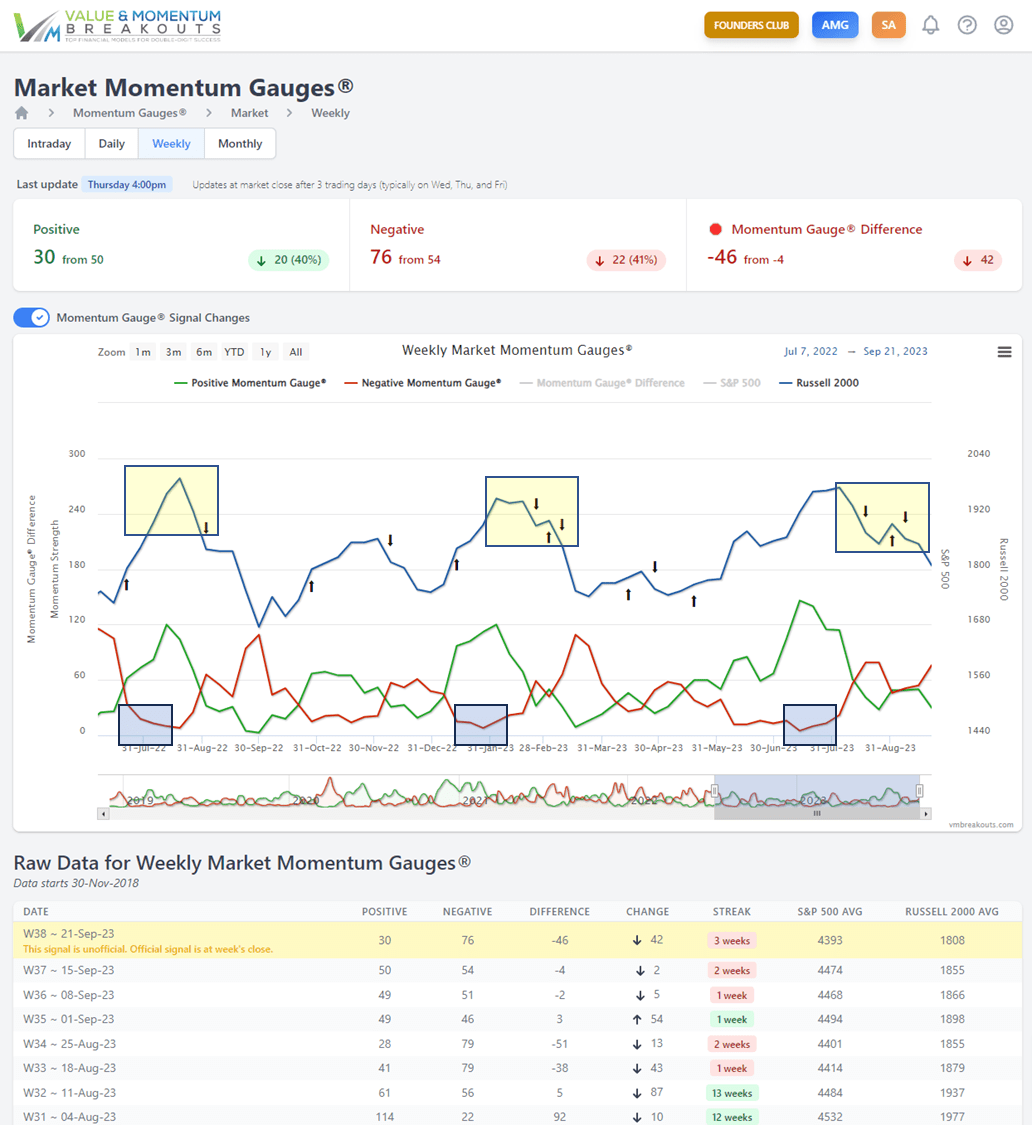
Related to these uniquely symmetrical head and shoulder topping patterns we have been positioning in strong bear funds since July and following the signal changes.
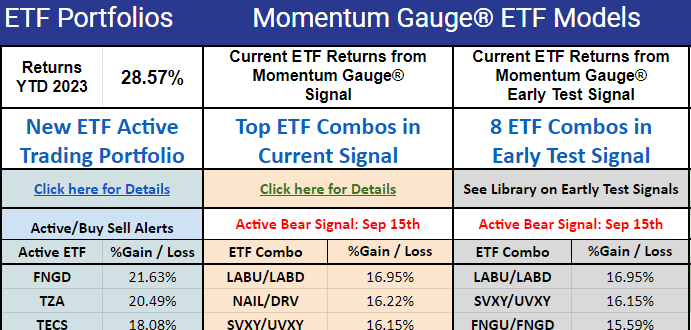
Bear Bounces
You can also see on the Russell 2000 index fund ( IWM ) yet another head and shoulder topping pattern with the shoulders spanning from June to September. You can see the prior patterns from market tops in September and February how a series of bear bounces created lower highs and lower lows in the negative channels. The highlighted blue boxes show how strong the 190/share resistance level has been as the index hits new lows back to June.
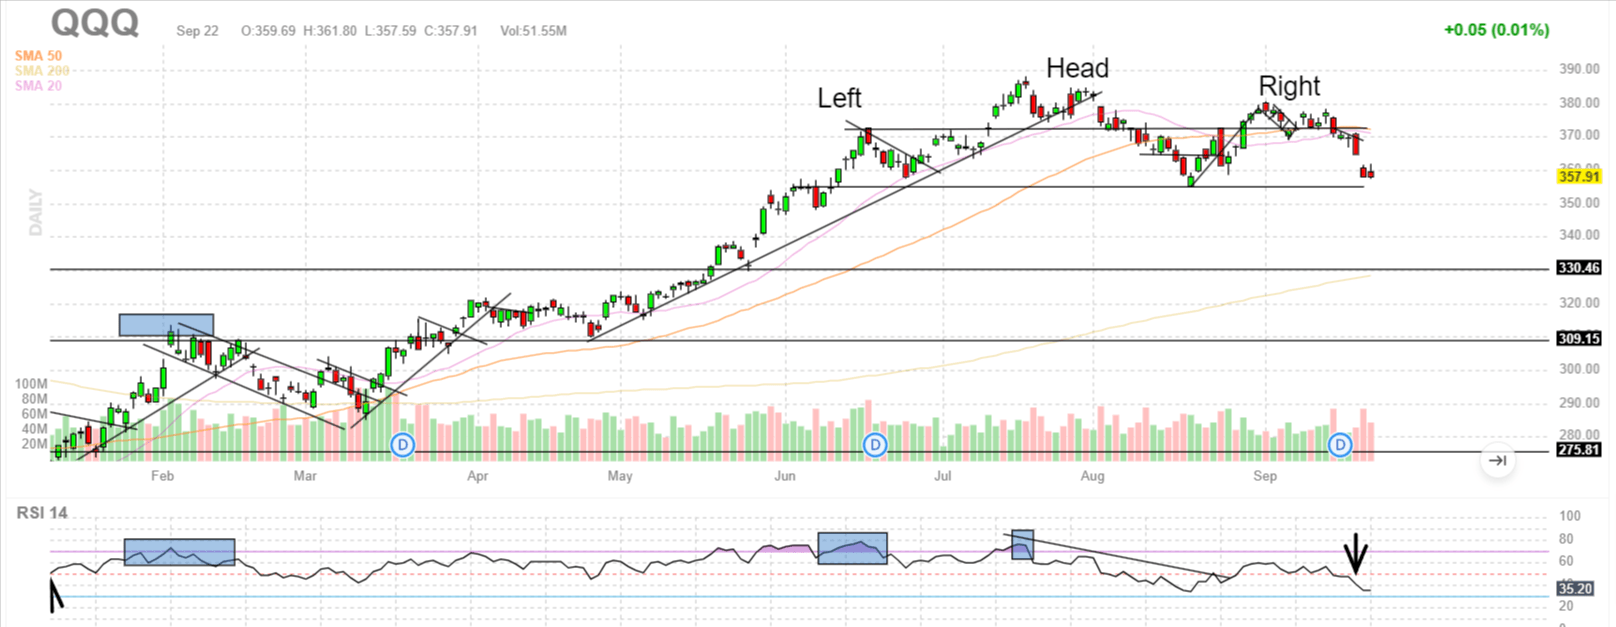
The Nasdaq 100 ( QQQ ) index fund is also showing bearish stair steps or bear bounces in the negative channel from August highs. You can see the pattern of lower highs and lower lows as institutional traders are reducing their market exposure, but allowing intraday rallies to generate more favorable exit price levels as we talked about in early September:
Twitter.com
Nasdaq 100 Invesco ( QQQ ) Trust also shows the ongoing pattern with a peak in July as investors take profits into the third quarter.
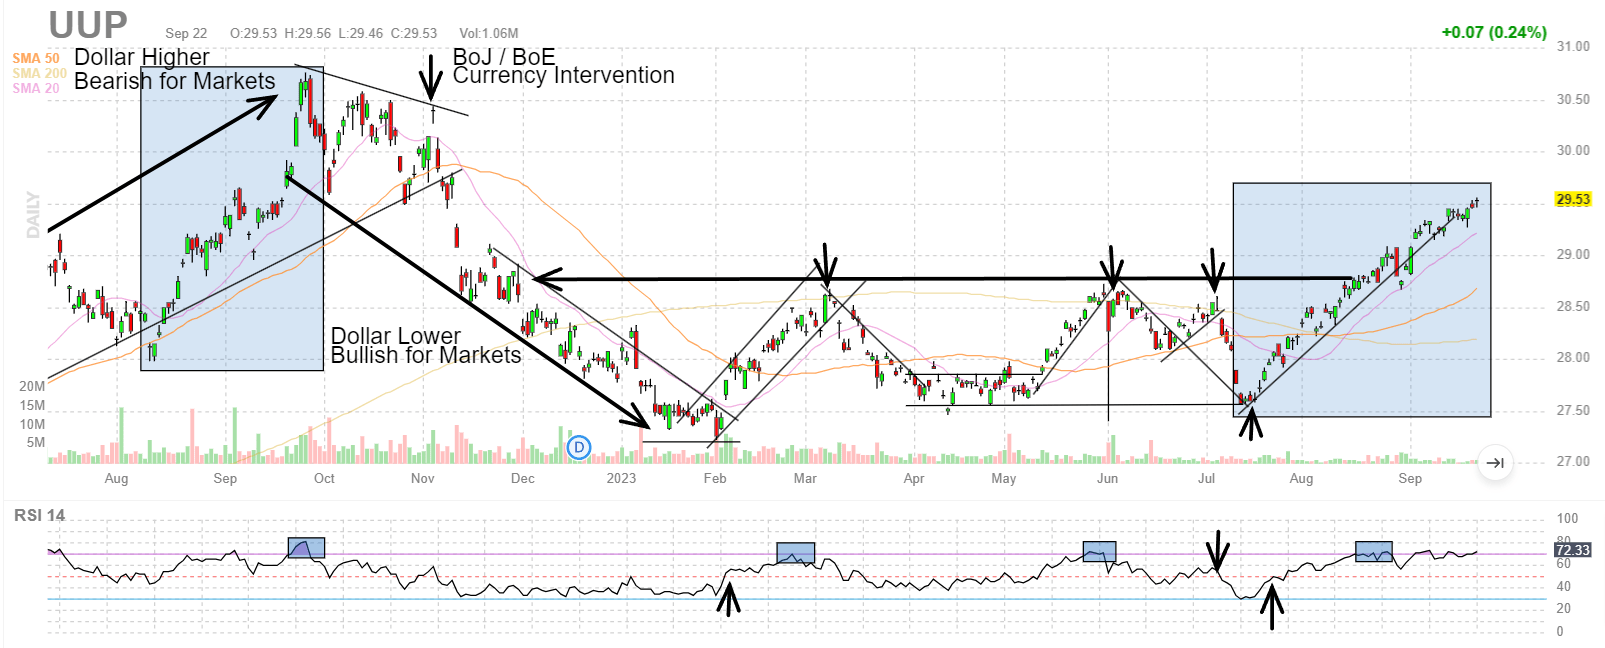
Record Dollar Highs
One of the contributing factors is the rising dollar as investors move to safety of cash. Since 2017, September has had the most frequent gains for the US dollar and that pattern is repeating again this year with similarities to last year. Invesco DB US Dollar Index Bullish Fund ( UUP ) is continuing to reach new highs into 2023 in a bearish direction for markets. Last year the peak in the dollar was forced as central banks of England and Japan intervened to stop the decay of their currency and weaken the dollar.
Until we see a strong drop in the dollar these patterns and the weakness of equity markets are likely to continue.
Zombies
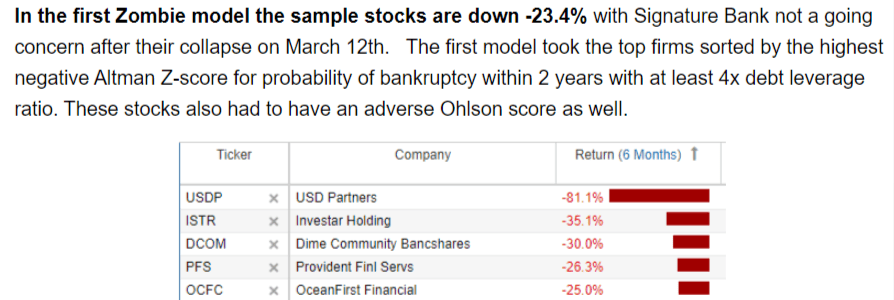
Also for September, I published a six-month follow-up study of the performance of the top "zombie" firm portfolio selections released in March . As a reminder, this zombie label was used by the Federal Reserve researchers to assess market risks during the Covid-19 pandemic to determine the level of high risk "firms that haven't produced enough profit to service their debts." As interest rates rise to the highest levels in 22 years and even the U.S. sovereign credit rating has been downgraded for the first time in more than a decade, there may be strong value in continuing to identify the most at-risk stocks for your trading decisions.
Regional banks like ( ISTR ) ( DCOM ) ( PFS ) ( OCFC ) continue to show above average risk levels. Using a combination of the Federal Reserve parameters and the forensic algorithms for bankruptcy risk, the current zombie selections include some well-known names like WeWork ( WE ) and Beyond Meat ( BYND ).
Conclusion
I hope these articles continue to give you valuable insight and different perspectives on the market for the best results possible. All of our long term portfolios are enhanced by following the momentum gauge signals throughout the year.
I believe these timing indicators and signals can enhance your trading in every market condition. I hope this serves you well in all your trading decisions!
JD Henning, PhD, MBA, CFE, CAMS.
For further details see:
Head And Shoulders Everywhere As Technology And Real Estate Breakdown