ABCZF - Headwaters Capital Q2 2023 Investor Letter
2023-07-28 09:00:00 ET
Summary
- Headwaters Capital Management is an actively managed, concentrated investment strategy focused on small and mid-capitalization stocks.
- The portfolio gained +17.4% (17.2% net) for the second quarter of 2023 compared to a +4.8% return for the Russell Mid Cap Index.
- The portfolio's outperformance was driven by positive stock selection across multiple sectors.
- We remain optimistic about the prospects for the companies in the portfolio.
Dear Investors,
The Headwaters Capital Management, LLC (“Headwaters Capital,” “Headwaters,” or the “Firm”) portfolio gained +17.4% (17.2% net) for the second quarter of 2023 compared to a +4.8% return for the Russell Mid Cap Index. A brief discussion of the performance and trading activity during the quarter is presented below.
Headwaters Capital Returns:
| Q1 '23 | Q2 '23 | YTD '23 | LTM(6/30/23) | 2021 | 2022 | Since Inception(1/4/2021) | |
|---|---|---|---|---|---|---|---|
| Headwaters Capital (Gross) | |||||||
| 5.2% | |||||||
| 17.4% | |||||||
| 23.5% | |||||||
| 34.8% | |||||||
| 17.9% | |||||||
| -22.7% | |||||||
| 12.5% | |||||||
| Headwaters Capital (net) | |||||||
| 5.0% | |||||||
| 17.2% | |||||||
| 23.1% | |||||||
| 33.9% | |||||||
| 17.1% | |||||||
| -23.4% | |||||||
| 10.4% | |||||||
| Russell Mid Cap Index | |||||||
| 4.1% | |||||||
| 4.8% | |||||||
| 9.0% | |||||||
| 14.9% | |||||||
| 22.6% | |||||||
| -17.3% | |||||||
| 10.5% |
| *Performance for the Headwaters Capital portfolio has been calculated by Liccar Fund Services for the period presented above. **Individual SMA performance may differ from the results presented above. [1] [1] The composite performance (“portfolio” or “strategy”) is calculated using the return of a representative portfolio invested in accordance with Headwaters Capital’s fully discretionary accounts under management opened and funded prior to January 1, 2021. The performance data was calculated on a total return basis, including reinvestments of dividends and interest, accrued income, and realized and unrealized gains or losses. The returns also reflect a deduction of advisory fees, commissions charged on transactions, and fees for related services. For further information about the total portfolio’s performance, please contact Headwaters at the email address listed. |
Q2 2023 Performance Discussion
Q2 ‘23 was an exceptionally strong period for the HCM portfolio. The strength was broad based as 13 names contributed more than 50bps of relative outperformance and, of those names, 8 contributed more than 100bps of relative outperformance. Importantly, these contributions came from multiple sectors (Financials, Real Estate, Consumer, Healthcare, Industrials and Technology) which highlights that this period of outperformance was driven by positive stock selection as opposed to any single investment theme or factor. Given extensive discussion of the growth v. value performance in previous letters, it is worth noting that the portfolio benefitted from growth (Russel Mid cap Growth + 6.2%) outperforming value (Russell Mid Cap Value +3.8%), but this was only a minor tailwind and still represents a significant headwind to performance since inception (Mid Cap Growth -4.6%, Mid Cap Value +18.1%).
Despite the recent outperformance of the HCM portfolio, I remain optimistic about the prospects for the companies in the portfolio. Valuations for companies in the portfolio are attractive and fundamentals remain strong. In terms of the overall small cap universe, the broad and diverse opportunity set is as compelling as it has been in years. The breadth of opportunities in the small cap space is best highlighted by the two companies added to the HCM portfolio during Q2, which have very different investment characteristics. One is a hyper-growth company with a market-leading product and limited competition. It trades at a lofty revenue multiple and is likely 1-2 years away from generating meaningful free cash flow. The other business operates in a large and highly fragmented industry where its scale and breadth of services act as a competitive advantage. Market growth and market share gains for this company are more modest, but when combined with margin expansion and inorganic growth, should lead to a mid-teens earnings CAGR. One business will grow into its multiple while the other only needs to sustain its multiple to generate above market returns (multiple expansion would add to returns). While optically very different on the surface, both companies share the same underlying investment characteristics of significantly higher earnings power in 5 years and an attractive valuation when evaluating this future earnings power.
For a more detailed overview of the outlook for small caps, I would point readers to the HCM website where an interview I filmed with SumZero discusses the current opportunity. I also discuss TMDX and NSIT , the 2 newest additions to the portfolio.
Q2 ’23 Portfolio Review
Top Contributor: Abcam, PLC ( ABCM +82%): During the quarter, ABCM’s founder and largest shareholder embarked on an activist campaign seeking to improve the profitability of ABCM. Starboard Value, an activist firm, also began accumulating a stake in ABCM and supported Mr. Milner’s campaign. As part of the proxy contest, ABCM disclosed that it had been approached by multiple interested parties regarding a potential sale of the company. I have mixed feelings about a potential sale. I would prefer ABCM to remain independent, especially given that shareholders have endured a longer than expected investment phase over the last 2 years. The company is clearly at an inflection point in profitability, as it guided margins to improve 13% in 2024 versus 2022. Given the top line growth profile of the company, I continue to believe ABCM could compound investor capital at a +15% CAGR for many years (and likely higher through the deployment of capital for M&A and/or share repurchases). However, if ABCM were able to pull forward this value by selling at a price significantly higher than today’s price, there are numerous attractive opportunities in the SMID cap space where proceeds could be deployed.
Top Detractor: CryoPort Systems ( CYRX -28%): CryoPort, the leader in cryogenic logistics for cell and gene therapies, saw share price weakness in the quarter following narrower approval of a key customer’s gene therapy, which will result in fewer shipments for CYRX in the near term. Due to small position size, the CYRX position was sold following the end of Q2.
Trading Activity
Buys (TMDX, NSIT): TransMedics and Insight Enterprises
Sells: NONE
TransMedics: “Heart in a Box” Technology Revolutionizing the Organ Transplant Industry
Summary Thesis
- Organ Care System drives market share gains through displacement of existing cold storage standard of care; market share gains supplemented by overall market growth as technology enables increased utilization of existing donor pool combined with expansion of donor pool.
- National OCS Program removes barriers to adoption and drives transplant center efficiency, serving as the catalyst for transplant center acceptance.
- Recent manufacturing capacity expansions combined with upcoming investments in a dedicated logistics network represent an inflection point for adoption.
- Broad support from all stakeholders as OCS technology improves patient outcomes, lowers cost of care for hospitals/insurers and drives increased volumes at transplant centers.
Company Overview
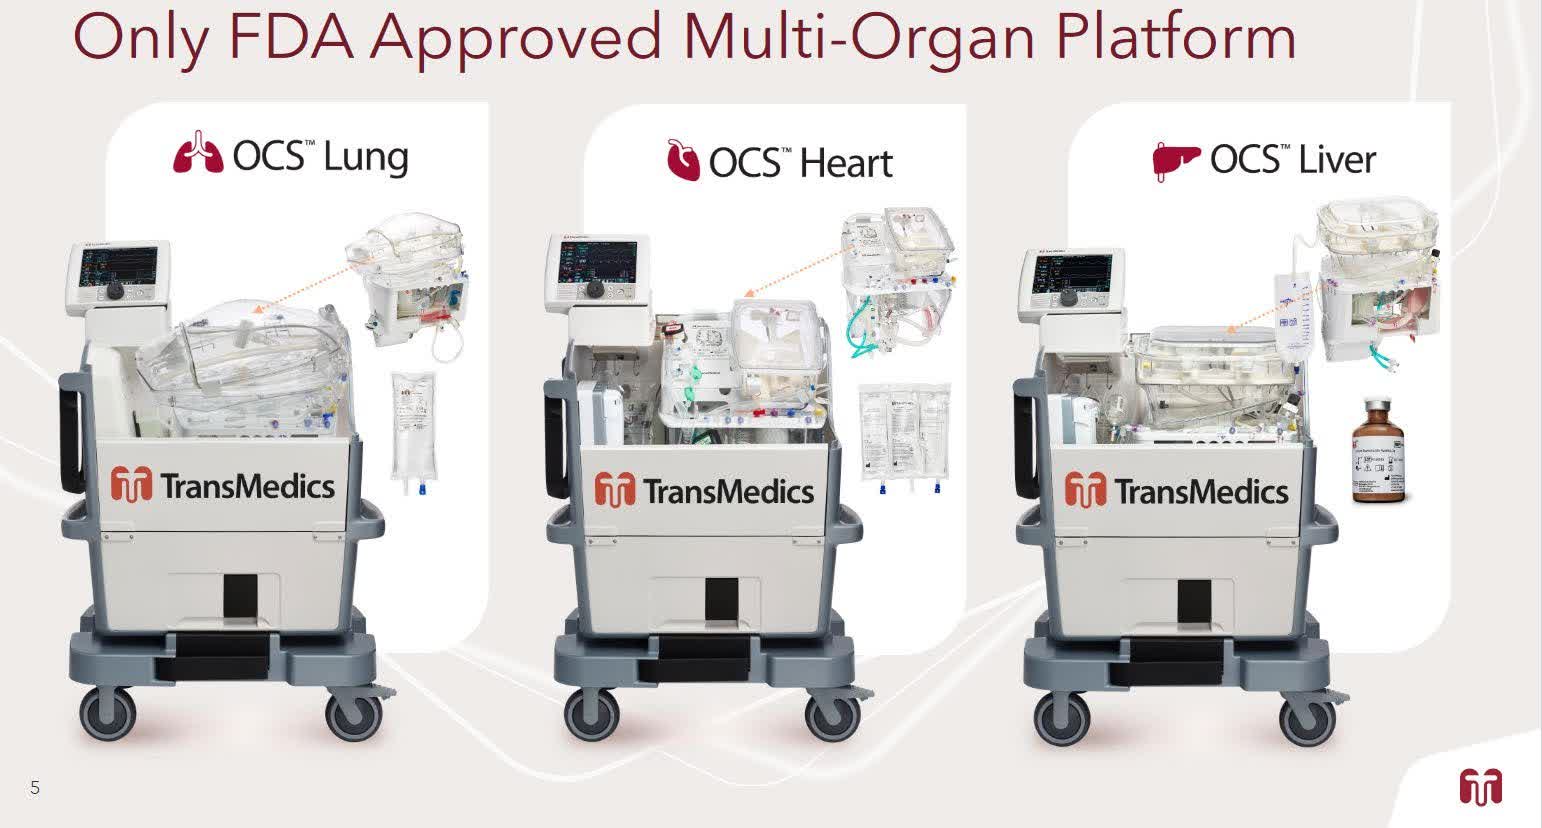
TransMedics (“TMDX”), headquartered in Andover, MA, is a leader in normothermic machine perfusion technology utilized for organ preservation during the organ transplant process. TransMedics’ Organ Care System (“OCS”) is an FDA approved portable organ perfusion system that is designed to replicate near-physiologic conditions for donor organs outside of the human body. The OCS pumps (perfuses) warm (normothermic), oxygenated blood through organs attached to the system, which enables extended organ retrieval distances along with assessment and optimization of donor organs during transport. By replicating the physiologic conditions of the body, the OCS systems improves post-transplant outcomes and facilitates increased utilization of donor organs. The OCS device is approved for use with lungs, hearts and livers and is the only FDA approved device for multiple organs.
Source: TransMedics Investor Presentation (May 2023)
To support broader adoption of the OCS technology, TMDX has designed a National OCS Program (“NOP”), which consists of on-staff surgeons and perfusionists located in 16 cities across the country who can procure and deliver donor organs to recipient hospitals. The NOP effectively serves as an outsourced procurement and logistics network for transplant hospitals, which increases surgeon capacity. In addition to the efficiency gains, the NOP network also lowers barriers to adoption of the OCS technology as hospitals are no longer required to purchase the machine nor train staff to use the console.
Organ Care System: Improving Organ Donor Utilization
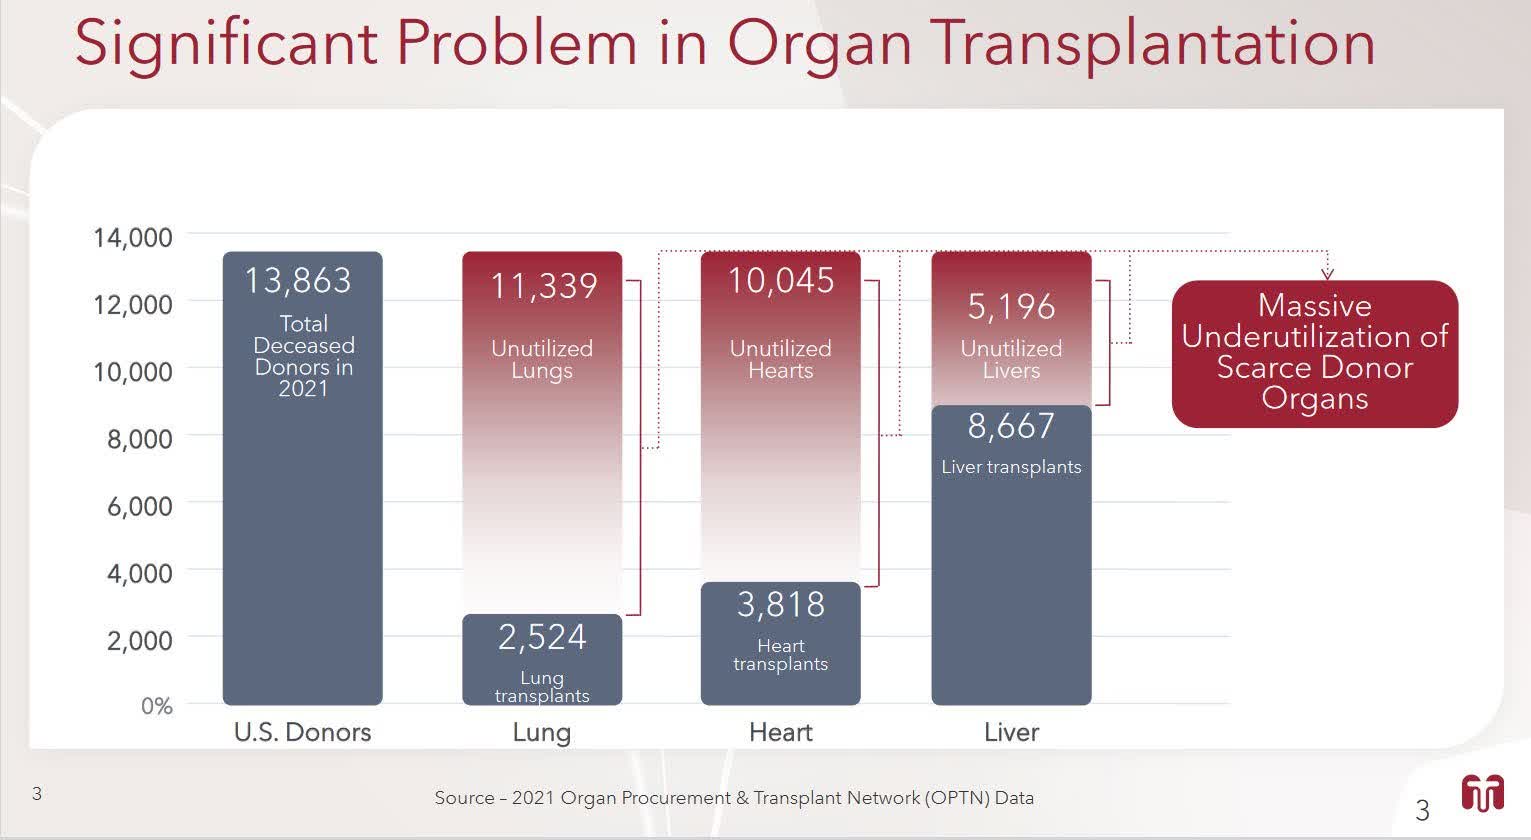
Due to limitations on geographic transplant distance and reluctance to use extended criteria organs, organ donor utilization rates have remained stubbornly low. This has led to poor outcomes for patients on transplant waitlists and excessive costs for the healthcare system while patients remain on the waitlist. Prior to FDA approval of the TMDX OCS console, static cold storage was the industry standard for donor organ transportation. After donor organs were procured by the recipient transplant center, they were placed on ice in an Igloo cooler for transport back to the recipient hospital. This static cold storage approach deprived the organs of oxygenated blood and subjected the organ to ischemia, or time-dependent injury due to a lack of oxygenated blood. Ischemia risk from cold storage limited the time a donor organ could be maintained outside the body to 4-6 hours, thus restricting the geographic distance between donors and recipients. Additionally, diagnostic tests and therapeutic treatments could not be performed on the organ since the organ was not metabolically active during cold storage. As a result of these limitations, marginal organs were unutilized because transplant centers could not ensure optimal post- transplant outcomes. The cold storage standard of care has been a key factor that has resulted in surprisingly low organ donor utilization rates: 18% for lungs, 27% for hearts, 62% for livers.
Source: TransMedics Investor Presentation (May 2023)
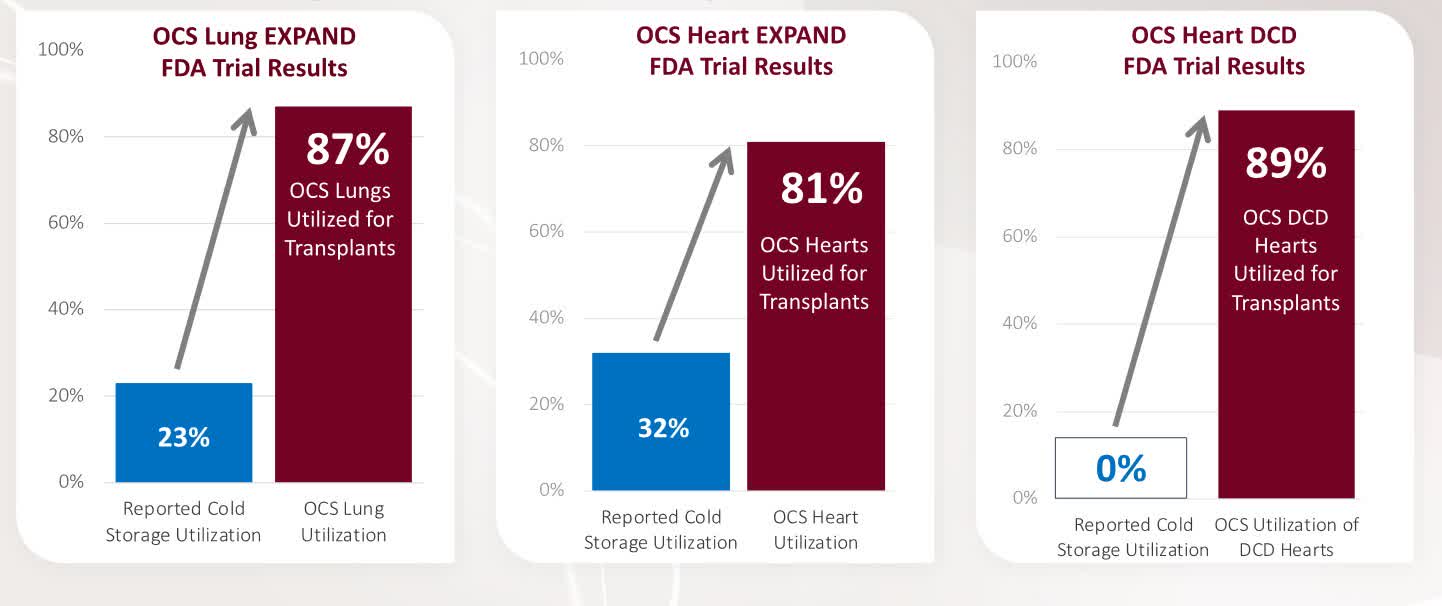
TDMX’s OCS system eliminates many of the variables that cause low utilization of donor organs. The perfusion of warm, oxygenated blood minimizes the ischemia risk and extends the amount of time an organ can be held outside of the body prior to transplant. This enables broader geographic matching of donors, a significant limitation for organ utilization prior to the OCS technology. Additionally, by placing the donated organ on the OCS system, transplant centers can assess the viability of the organ through diagnostic tests and can even perform therapeutic work to improve post-transplant outcomes. This has served to increase the use of marginal organs, or extended criteria organs, which has improved overall donor utilization rates. Data from TMDX’s clinical trials exhibits how the OCS technology significantly increased donor organ utilization.
Source: TransMedics Investor Presentation (May 2023)
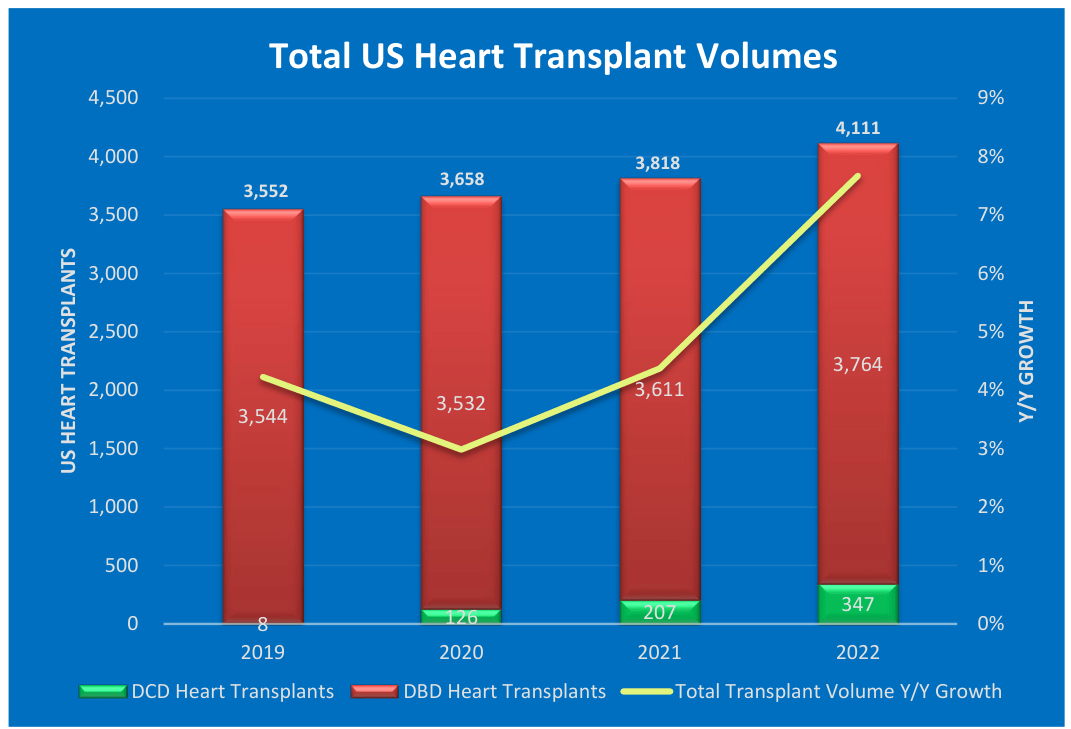
The most profound impact of OCS technology on extended criteria organs has been through the expansion of the donor market through utilization of donation after circulatory death (“DCD”) organs. Prior to the availability of OCS technology, donor hearts were only available from donation after brain death (“DBD”) donors given that hearts that stopped beating (DCD) were considered too risky for use in transplantation. With the approval of the OCS technology, DCD hearts can effectively be brought back to life with the TMDX system. Use of DCD hearts has expanded the pool of available donor organs and has contributed to the growth in total heart transplants.
Source: United Network for Organ Sharing, OPTN Dashboard
NOP Supporting OCS Adoption, Surgeon Capacity Expansion
The OCS technology is clearly an improvement upon the cold storage standard of care for organ preservation, however adoption of the technology was slow prior to TMDX’s launch of the National OCS Program. Hospitals were hesitant to spend CAPEX on the OCS system given high costs and uncertain utilization of the machine.
Additionally, usage of the console required training of staff, which further increased the cost of ownership and negatively impacted transplant center efficiency. By introducing the NOP, TMDX removed these barriers to adoption: hospitals avoid the CAPEX required to purchase the console and training of staff is no longer necessary. Removing barriers to adoption was important, but the efficiencies gained by transplant programs through utilization of the NOP have served to further increase market acceptance of the OCS technology. Transplant centers that utilize the NOP no longer dispatch transplant teams to procure organs, which effectively doubles the capacity of their transplant teams. Importantly, all NOP costs are reimbursable, which means that the profitability of the transplant center is not impacted by utilization of this service. Utilization of the NOP has increased from 47% of all TMDX transplants in Q4 2021 to 89% of all cases in Q1 of 2023. Going forward, the NOP will likely account for the majority of TMDX’s volume.
The significant growth of the NOP in 2022 has led to logistics constraints for the company. Currently, TMDX utilizes private jet brokers to arrange planes for organ recovery and delivery, which adds significant costs to the process.
More importantly, TMDX has outgrown this brokerage network as the capacity of available jets is running low. Given projected growth of OCS adoption over the next few years, TMDX believes demand will exceed brokered jet capacity and has made the decision to build its own air transportation fleet. Through the issuance of convertible notes in May 2023, TMDX raised $400mm which will be utilized to either buy or lease a dedicated fleet of private jets. Control of the logistics network will not only enable more efficient transport of organs, it will also lower the logistics costs for transplant centers as brokerage fees and rental fees to plane owners will be eliminated. The efficiencies and cost savings that the NOP will enable for transplant programs should drive even faster adoption of OCS technology. While the OCS is the core technology improving transplant outcomes, the NOP will enable adoption of the technology and serve as a barrier to entry for future competitors. The cost to build a competing network combined with uncertain utilization is likely to deter competitors from replicating the TMDX NOP, which is poised to have a significant first mover advantage compared to peers.
Competition
The competitive environment for TMDX is fragmented and consists of both direct competition from companies with NMP devices as well as indirect competition from other technologies. TMDX is the only company with FDA approval for a NMP device for multiple organs and is the only company with a complete procurement and logistics network (following acquisition/lease of jets). As such, TMDX is the clear industry leader and I believe the combination of superior technology with a robust service component will enable the company to maintain its lead over potential competitors. A summary of the competitive landscape is outlined below.
- XVIVO : FDA approved NMP device for the lungs and recently received FDA approval for a clinical trial in hearts that will utilize hypothermic machine perfusion. Similar to TMDX, XVIVO has a competing organ recovery service, Star Teams, that they acquired in 2021. STAR has 8 thoracic surgeons on staff and only offers lung and heart retrieval. During Q1 ’23, XVIVO retrieved 146 organs, or 1/3 the volume that TMDX’s NOP platform procured during the same time period. STAR’s reception in the market demonstrates viability of the outsourced organ retrieval business model. Interestingly, XVIVO announced a private jet partnership in early July 2023 (5 planes), also noting that logistics capacity would be critical to future growth. XVIVO currently has $18mm of cash on hand and likely needs to raise significant capital in order to compete with TMDX. The commercial viability in 3 organs along with a scaled service offering provides TMDX a significant first mover advantage relative to XVIVO.
- OrganOX : FDA approved NMP device for livers. Limited funding prevents commercial viability today.
- Hypothermic machine perfusion (“HMP”) : Paragonix has an FDA approved HMP device for hearts and there are multiple companies with clinical trials in the organs that TMDX targets. HMP technology supplies oxygen to the transplant organs, which can extend ischemic times. From a commercialization perspective, the key question is whether the organ performs better post-transplant when preserved at lower temperatures than experienced in the body. Current research suggests that normothermic conditions are better for extended criteria organs, at a minimum. Per Paragonix’ website, their HMP device is only approved for 4 hours, which is the same time allowed for transplant using existing static cold storage, which does not solve the geographic limitation on donor/patient matching.
- Normothermic regional perfusion (“NRP”) : A process that involves restarting the heart inside the body to naturally perfuse organs. This technique bears watching as a potential competitive threat to TMDX. However, there are ethical questions surrounding this process and NRP does not solve the geographic limitations that TMDX’s OCS system solves.
Industry Adoption
It is early in the lifecycle of OCS technology and similar medical devices that provide a good roadmap for ultimate industry adoption do not exist. However, leading transplant centers that have already adopted the TMDX OCS suggest that this technology can expand the organ donor pool by at least 30%. Additionally, early adopters of the OCS/NOP have seen OCS penetration rates approaching 30% of total transplant volumes. Keep in mind that this early success is being achieved despite relatively recent FDA approval of the OCS device in heart and liver, manufacturing constraints on TMDX side, and an incomplete NOP offering. As more facilities grow increasingly comfortable with the technology and NOP network, industry adoption should continue to grow. Important data points about utilization by early industry adopters are presented in the appendix.
Financials
TMDX earns revenue by selling the perfusion set and associated solutions that are utilized while an organ is on the OCS console. This perfusion set is a one-time use item (consumable) that costs $65,000 per transplant (all reimbursed by insurance).
Source: TransMedics Investor Presentation (May 2023)
TMDX charges ~$20,000 for the NOP service that procures and delivers the organ to the transplant center (also reimbursed by insurance). Actual logistics costs will vary based on the length of transport, but range anywhere from $10,000-$30,000.
I assume the heart and liver markets can each expand by 50% by 2027. This TAM expansion is a combination of DCD organ utilization, extended criteria organ utilization and expanded geographic organ matching. I also assume that TMDX penetration of these 2 markets reaches 30% in 2027. Both assumptions seem plausible given comments from early adopters and management’s forecast that both markets can double in size. Locally procured, healthy organs are unlikely to be served by TMDX, so a portion of the market will likely remain inaccessible for the company. Industry adoption rates could exceed 30% if improvements in therapeutics while organs are on the OCS device prove viable or additional clinical evidence demonstrating improved patient outcomes for standard criteria organs is presented. It’s worth noting that TMDX had a 15% penetration in hearts and an 11% penetration in livers during Q1 ’23 when capacity was unable to meet industry demand (implies industry demand is well above these levels already).
I do not forecast strong industry adoption rates for lungs. While management believes that lower industry adoption rates for OCS Lung are due to the COVID impacts on lung transplants, it seems that adoption rates should be increasing now that the pandemic has passed, and overall industry volumes have recovered. This has not occurred and, as such, it appears that there could be structural reasons for lower OCS lung adoption rates.
| TMDX Market Share Projections |
| 2019((A)) |
| 2020((A)) |
| Y/Y Growth |
| 2021((A)) |
| Y/Y Growth |
| 2022((A)) |
| Y/Y Growth |
| 2023((E)) |
| Y/Y Growth |
| 2024((E)) |
| Y/Y Growth |
| 2025((E)) |
| Y/Y Growth |
| 2026((E)) |
| Y/Y Growth |
| 2027((E)) |
| Y/Y Growth |
| Total US Liver Transplants* |
| 8,896 |
| 8,906 |
| 0% |
| 9,236 |
| 4% |
| 9,528 |
| 3% |
| 10,625 |
| 12% |
| 11,687 |
| 10% |
| 12,622 |
| 8% |
| 13,632 |
| 8% |
| 14,314 |
| 5% |
| TMDX Liver Transplants** |
| 54 |
| 81 |
| 50% |
| 24 |
| -70% |
| 548 |
| 2141% |
| 1,218 |
| 122% |
| 1,871 |
| 54% |
| 2,265 |
| 21% |
| 3,205 |
| 41% |
| 4,147 |
| 29% |
| Penetration Rate |
| 1% |
| 1% |
| 0% |
| 6% |
| 11% |
| 16% |
| 18% |
| 24% |
| 29% |
| Total US Heart Transplants* |
| 3,552 |
| 3,658 |
| 3% |
| 3,818 |
|
4% |
| 4,111 |
| 8% |
|
4,556 |
| 11% |
|
5,012 |
| 10% |
|
5,513 |
| 10% |
|
5,954 |
| 8% |
|
6,430 |
| 8% |
| TMDX Liver Transplants** |
| 176 |
| 218 |
| 24% |
| 236 |
| 8% |
| 368 |
| 56% |
| 806 |
| 119% |
| 1,210 |
| 50% |
| 1,465 |
| 21% |
| 1,721 |
| 17% |
| 1,961 |
| 14% |
| Penetration Rate |
| 5% |
| 6% |
| 6% |
| 9% |
| 18% |
| 24% |
| 27% |
| 29% |
| 30% |
| Total US Lung Transplants* |
| 2,714 |
| 2,539 |
| -6% |
| 2,524 |
|
-1% |
| 2,692 |
| 7% |
|
3,001 |
| 11% |
|
3,151 |
| 5% |
|
3,308 |
| 5% |
|
3,474 |
| 5% |
|
3,647 |
| 5% |
| TMDX Liver Transplants** |
| 133 |
| 95 |
| -29% |
| 157 |
| 64% |
| 99 |
| -37% |
| 99 |
| 0% |
| 122 |
| 24% |
| 147 |
| 20% |
| 176 |
| 20% |
| 211 |
| 20% |
| Penetration Rate |
| 5% |
| 4% |
| 6% |
| 4% |
| 3% |
| 4% |
| 4% |
| 5% |
| 6% |
| Total TMDX Transplants |
| 363 |
| 394 |
| 9% |
| 417 |
| 6% |
| 1,014 |
| 143% |
| 2,122 |
| 109% |
| 3,204 |
| 51% |
| 3,877 |
| 21% |
| 5,101 |
| 32% |
| 6,319 |
| 24% |
| * Source: OPTN National Database and HCM Estimates **Company Disclosures and HCM Estimates |
By 2027, I forecast TMDX’s OCS system will be utilized for ~6,500 transplants. Management has a target of 7,000- 10,000 transplants by 2027. Successful adoption in the lung transplant community and broader adoption of OCS would bridge the gap between my forecast and the company’s. There could be additional upside from international expansion, although this is low on management’s priority list given current US demand.
In addition to the OCS volumes assumed above, I also assume that NOP will be utilized for 95% of all procedures and the TMDX logistics network can support 60% of these cases. Product gross margins will expand to 85% versus 80% currently as scale and manufacturing efficiencies are realized. Management believes they can achieve service and logistics gross margins of 30%, although I’m more conservative at 25% given my lower volume forecast.
EBITDA margins should normalize in the high 20% range, slightly below management’s forecast of low to mid 30’s (again due to my more conservative volume forecasts). I believe TMDX can support a 30x EBITDA multiple at maturity given the growth outlook and the unique nature of the technology and network that supports it. A 30x EBITDA multiple on 2027 EBITDA yields a price target of $150, or a 15% annualized return from today’s price.
Summary Thesis
The combination of TMDX’s OCS technology with its NOP network will lead to market share gains and broader market growth over the next 5+ years. Broad support from all stakeholders due to improved health and financial outcomes provides the backdrop for rapid adoption of OCS technology. The full service NOP offering enables industry adoption and, given the significant financial and human capital requirements, serves as a barrier to entry for future competitors. Recent manufacturing capacity expansion will prove to be an inflection point for growth and TMDX has ample financial capacity to support both near and medium-term growth ambitions. Assuming a 30x EBITDA multiple on 2027 EBITDA yields a price target of $150, or a 15% annualized return from today’s price.
TMDX Appendix
- Vanderbilt (Top Ranked Heart Transplant Program): Currently utilizes TMDX for DCD heart transplants. Vandy's chair of Cardiac surgery believes that TMDX's technology could expand the donor pool of hearts by 30-40%. In 2022, 34% of Vandy's heart transplants were DCD. 1 2
- Carolina's Medical Center (14 th ranked Heart Transplant Program): “We face a nationwide shortage of donated organs. I expect this technology to transform the transplant industry, increasing the national donor supply and helping us transplant more patients in need.” 3
- Mayo Clinic of Florida (19 th ranked Heart Transplant Program): Foresees perfusion used in 20-25% of cases. It’s worth noting that these comments were made before NOP was introduced and this article also notes that one of the biggest hurdles to adoption is cost. The NOP should alleviate the cost concern. 4
- Medical University of South Carolina (20 th ranked Heart Transplant Program): expects OCS to expand their transplant volume by 20%
- Tampa General (22 nd ranked Heart Transplant Program): 20% of heart transplants used TMDX in 2022. 5
- Northwestern (40 th ranked Heart Transplant Program): “In my 20 years as a transplant surgeon, this is the biggest leap forward our field has taken and the best opportunity we’ve had to expand the number of available hearts,” says Dr. Pham. “At Northwestern, we believe this approach will help us to treat and serve more patients with end-stage heart failure. 6
- Hartford Hospital (79 th ranked transplant program): Performed 6 heart transplants using OCS in March 2023. This hospital only performed 20 transplants in all of 2022. 7
Insight Enterprises: Architect and General Contractor Enabling Digital Transformation
Summary Thesis
- Ongoing IT innovation and increasing IT complexity serve as secular tailwinds for NSIT’s solutions integrator business model.
- Market share gains driven by scale of product distribution, breadth of vendor relationships and depth of IT expertise.
- Margin and ROIC improvement from portfolio mix shift to a greater proportion of software and services revenue, augmented by specific margin improvement efforts in each product line.
- Multiple expansion potential as revenue contribution from higher margin and less cyclical software and services revenue grows.
Company Overview
Insight Enterprises ( NSIT ) is a technology solutions integrator serving Fortune 500 companies globally. NSIT defines solutions integrator as a partner that can leverage technical expertise to deliver products, software and services that solve a client’s needs. I think it is easier to think of the company as an end-to-end enabler of digital transformation for large corporations. NSIT’s team of 4,500 IT experts can provide upfront consulting services to design a project roadmap to solve a client’s IT needs. NSIT then leverages the company’s roots as an IT reseller, where it’s relationships with over 6,000 OEMs and expertise with supply chain procurement and customization is a key differentiator versus traditional consulting firms. NSIT’s IT experts can then implement the project for the client and provide ongoing maintenance services following completion. This full life cycle management differs from pure IT resellers who don’t have the technical expertise for complex projects and from pure consulting firms who don’t have the supply chain procurement expertise. Specific digital transformation focus areas for NSIT include cloud migrations, infrastructure modernization, cybersecurity, modern apps and data/AI.
Source: Insight Enterprises Investor Presentation (Q2 2023)
A representative project helps to provide a more concrete overview of the business. NSIT has used the example of a global airline that is introducing in-flight payments for food and beverage (slightly dated example, but helpful in understanding the business). While this seems like a simple project, it is far more complex than it appears on the surface. NSIT might be engaged upfront through a consulting project where the company’s IT experts can provide advice on appropriate hardware and software for the project. NSIT would then be hired to procure the hardware and customize the devices with credit card readers and customized corporate packaging. Devices must also be configured with software that ties into existing corporate systems as well as cybersecurity protection. Given the volume of devices for a project of this size, customization is performed at one of NSIT’s integration centers. Once the devices have been configured, NSIT handles the distribution of these devices globally. Finally, NSIT can manage the maintenance and replacement of these devices once they have been distributed. In this example, global scale, product breadth and supply chain management are critical to this complex IT solution.
Like the example above, NSIT’s business has historically revolved around procurement, customization, and management of client devices (laptops, desktops, etc). However, through a series of acquisitions and internal human capital development, NSIT has built a team of IT experts focused on consulting and implementation for data centers and cloud migration. Cloud migrations, specifically, are complex projects that require upfront consulting engagements and the procurement of multiple hardware, software and infrastructure products.
Following implementation, these IT projects carry more back-end maintenance and service revenue for NSIT. As discussed in detail below, this shift to more software and services will benefit margins and ROIC going forward and is a critical piece of the NSIT investment opportunity.
IT Distribution Industry & Competitive Positioning
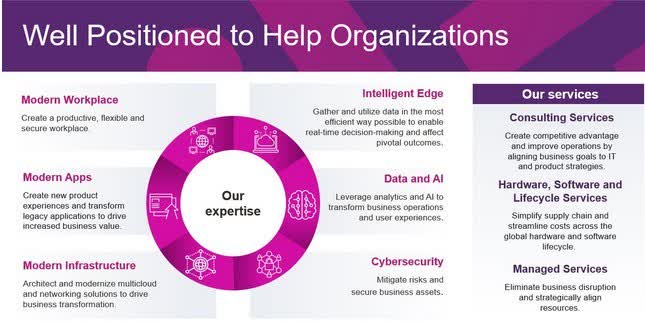
The solutions integrator business model is a bit of a gray area in the IT distribution and services landscape. NSIT has overlap with customers/competitors in the IT reseller space, IT distribution, business process outsourcing and IT consulting. NSIT’s differentiation lies in its IT reseller background combined with a deep pool of IT experts.
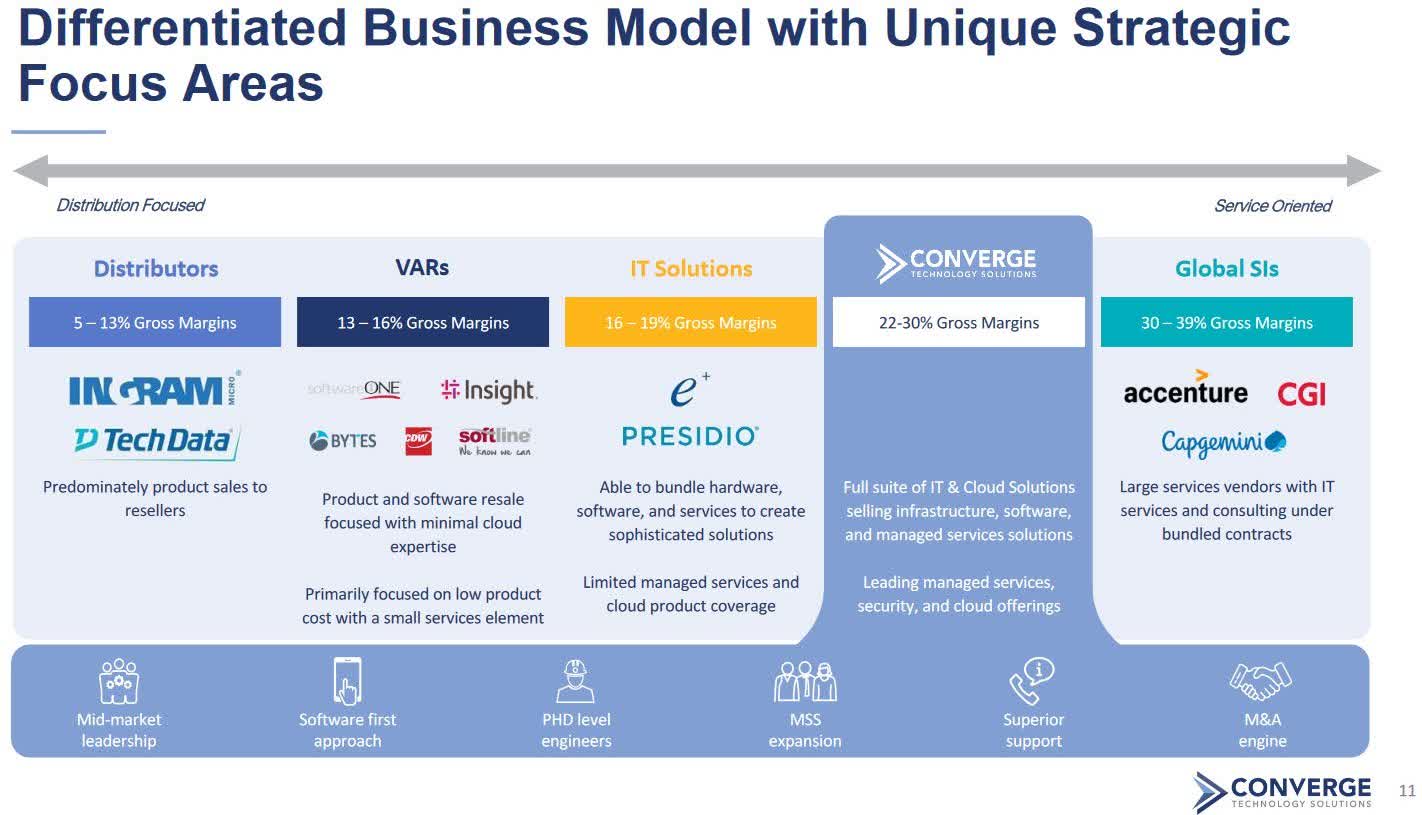
Converge Technology provides a good overview of the competitive landscape and where each company fits in the value chain.
Source: Converge Technology Solutions Investor Presentation (June 2023)
NSIT’s role in the IT value chain is important to both vendors and customers. NSIT serves as an outsourced sales and implementation provider for OEMs, who can’t profitably operate a competitively scaled sales and service infrastructure (especially smaller OEMs). From a client perspective, NSIT offers a similar outsourced service in that they provide objective consulting, procurement and implementation expertise to customers across an extensive range of products (6,000 OEM relationships). As the IT landscape becomes more dynamic and complicated, the broad expertise of NSIT’s IT specialists only grows in importance. NSIT noted that an average project has ten different partners, which highlights the value that NSIT can provide to both OEMs and customers via coordinating these complex digital transformation projects. Hence the construction analogy: NSIT serves as the architect on the project upfront and then acts as the general contractor, overseeing the implementation of the roadmap through to completion.
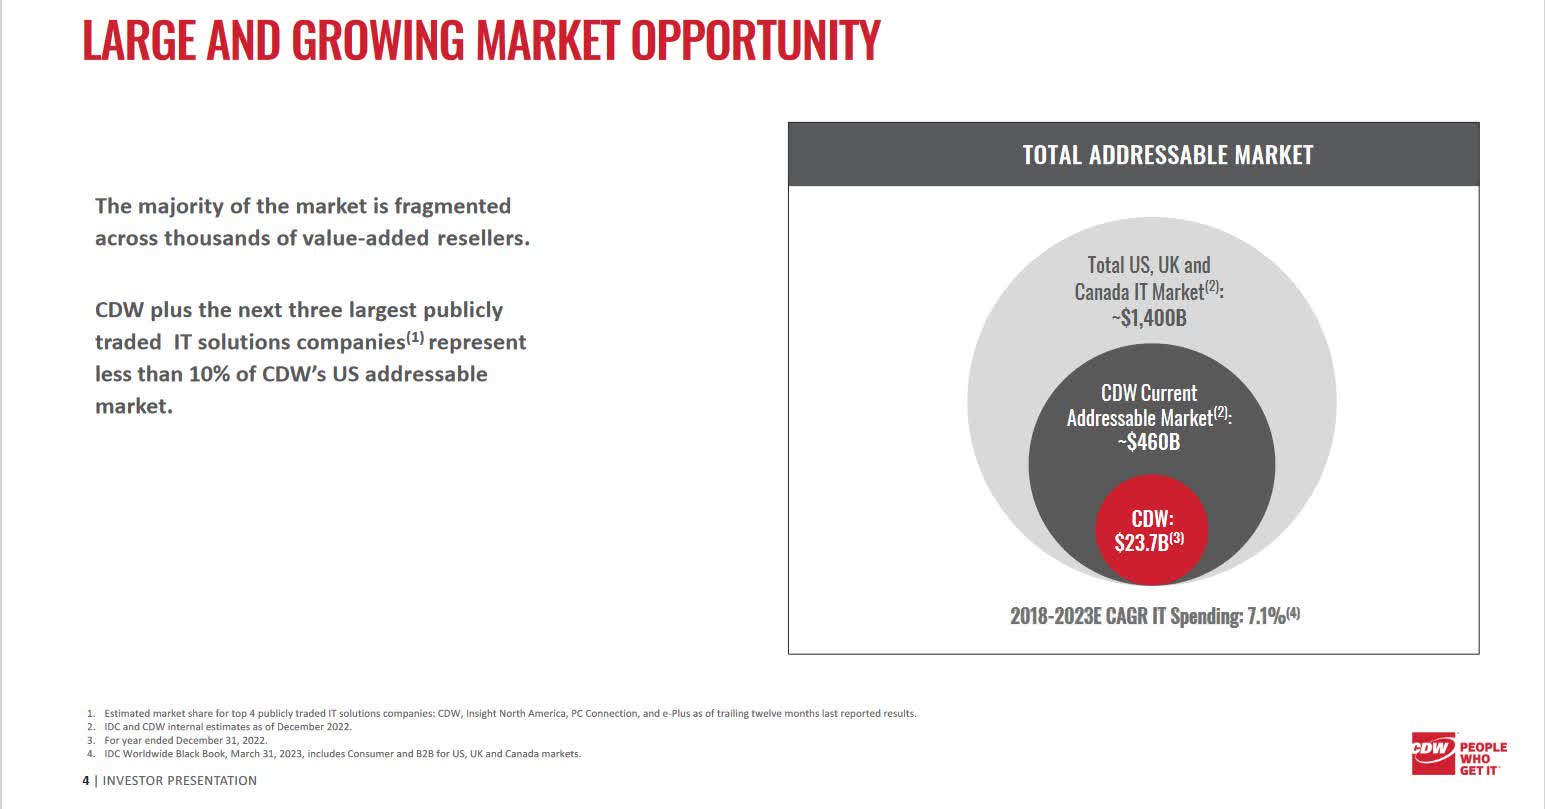
The IT solutions market is highly fragmented, with the top 4 players representing only 10% of the market.
Source: CDW Investor Presentation
NSIT has a significant scale advantage relative to the fragmented set of smaller competitors, which is even more important for large corporate customers. Smaller competitors do not possess the geographic footprint required to serve these global customers. Additionally, few companies have the breadth and depth of NSIT’s vendor relationships, again positioning NSIT well when serving the diverse needs of large corporations.
CDW is the closest competitor to NSIT, but primarily competes in the SMB space and doesn’t have significant overlap with NSIT in the large corporate market. CDW’s focus on SMB enables higher margins and lower working capital requirements as payment terms are shorter for SMB customers versus large enterprises. Smaller publicly traded peers and a fragmented landscape of private competitors that typically have a specific vendor or customer relationship present limited competition for NSIT in the large enterprise space.
Given the fragmented competitive landscape combined with the sheer size of the market, the industry has historically seen steady consolidation. Acquisitions are strategically attractive as smaller companies often fill product and/or geographic gaps, thus increasing the scale advantage of larger players. Additionally, M&A is financially accretive as there are often significant expense synergies realized through consolidation.
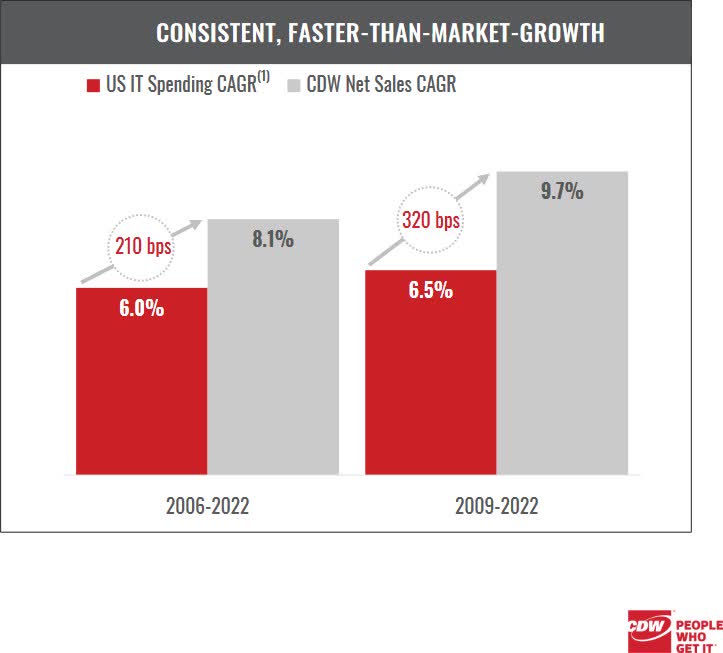
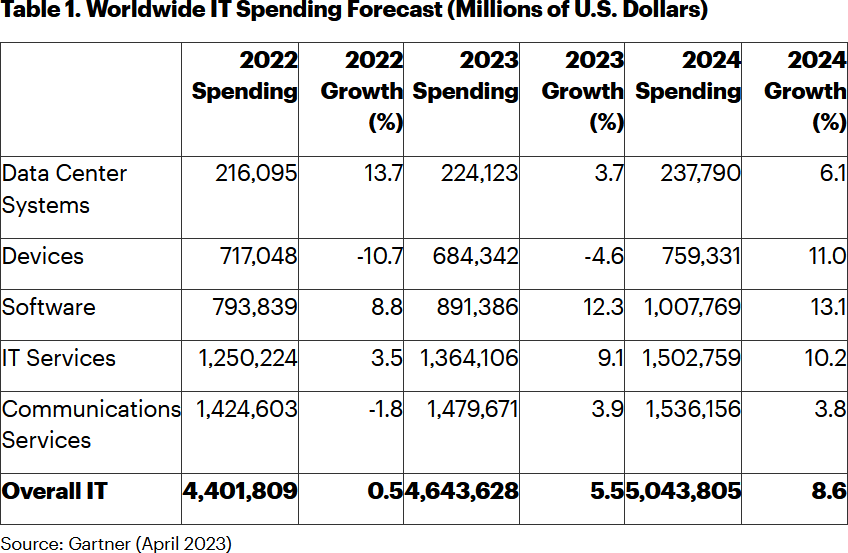
IT Industry Growth
Through a cycle, IT industry growth generally outpaces GDP by 200-300bps. Although backward looking, CDW provides good data on historical IT spend that has averaged ~6%. Given a growing focus on broad digital transformation combined with growing complexity in the IT landscape, I would expect this to be a floor growth rate for the industry going forward.
Source: CDW Investor Presentation, IDC Worldwide Black Book December 31,2002
NSIT is focused on the fastest growing areas of IT spending, which should enable the company to organically outgrow broader IT spending through a cycle. Additionally, faster growth of software and services will enable margin expansion and reduced capital intensity.
NSIT’s largest OEM partner is Microsoft, which accounts for 14% of NSIT’s total revenue. NSIT’s partnership with MSFT also supports industry outperformance as a result of Azure’s leading position in the cloud migration trend. Interestingly, legacy MSFT relationships provide a pipeline for future cloud conversions (as opposed to AWS/Google Cloud which don’t have the legacy on-prem infrastructure).
Financials
Initially, the margin profile and inherent cyclicality of the hardware business appear to be a poor fit for the Headwaters portfolio. However, NSIT’s cheap valuation combined with an improving financial profile due to broader industry trends and internal initiatives make NSIT a compelling opportunity. As described above, hardware sales previously accounted for the majority of NIST’s revenue. Hardware revenue carries lower gross margins, which depressed overall gross margins. The hardware business is also capital intensive given the significant inventory required to support this business and extended payment terms from large enterprise clients. As the software and services mix of NSIT’s business grows, margins will naturally improve due to this mix shift.
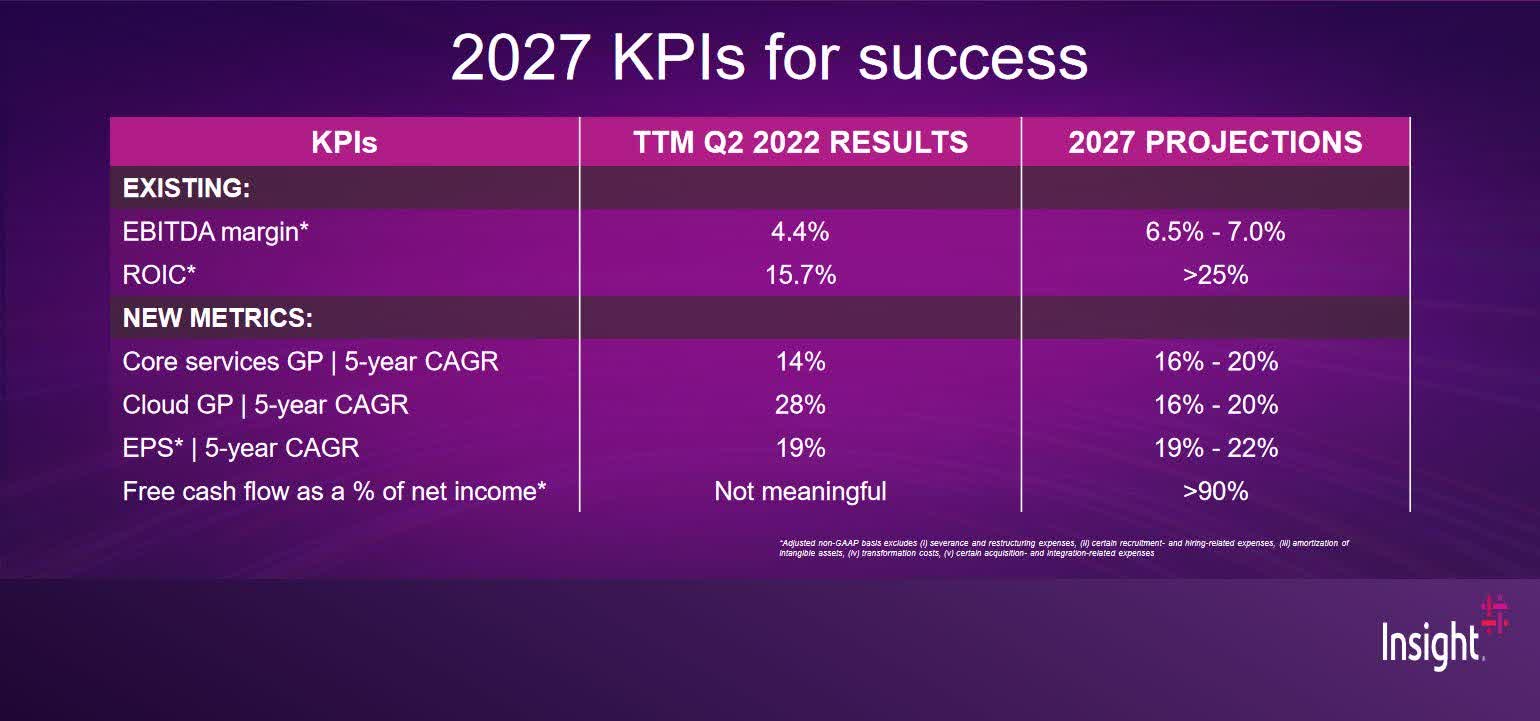
NSIT has also outlined specific steps that will improve the gross margins within hardware, software and services in addition to the positive mix shift. Furthermore, software and services sales are capital light, which will support an improved ROIC. Management laid out long-term guidance that incorporates these dynamics and is expected to lead to a significantly improved financial profile by 2027.
Source: NSIT Investor Day Presentation October 2022
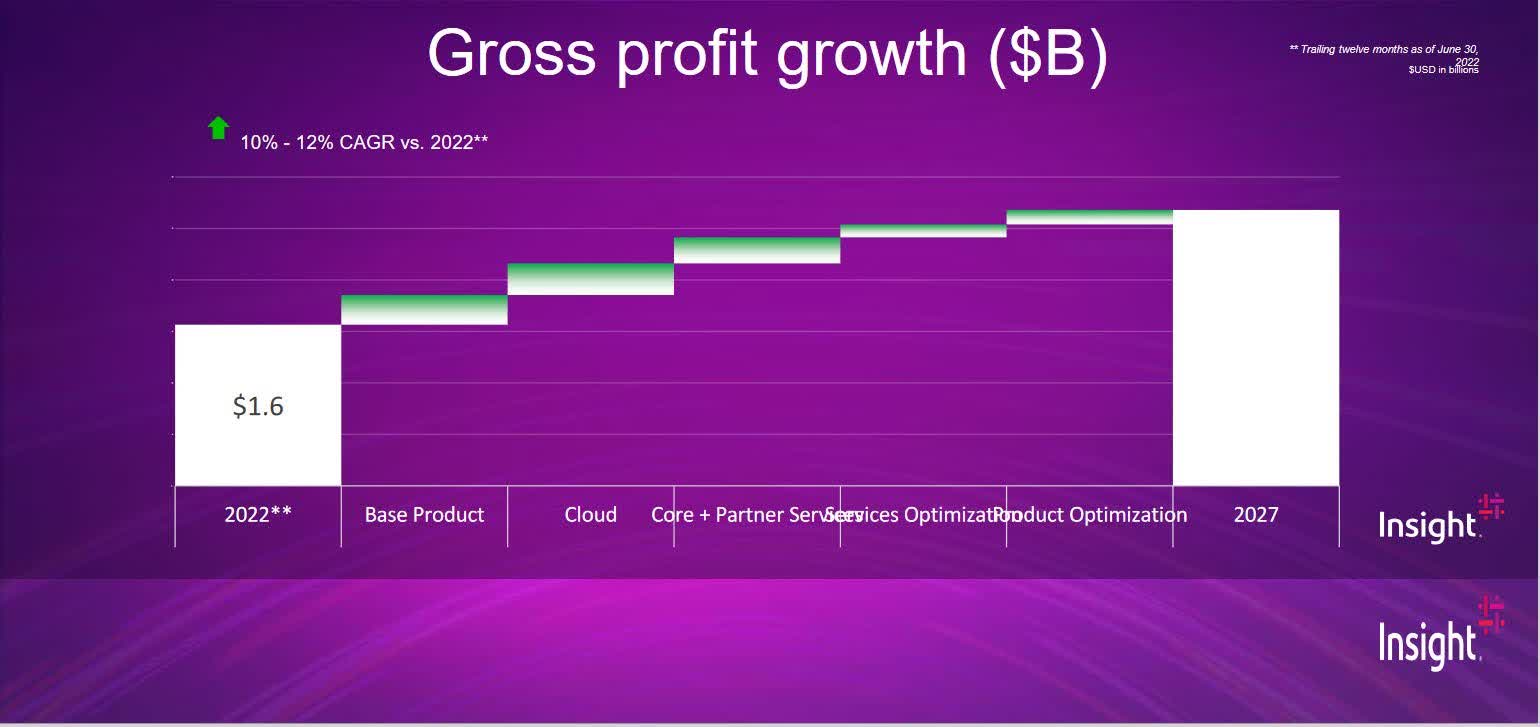
Given different revenue recognition (gross and net) for different products/services, NSIT correctly guides investors to think about gross profit dollar growth instead of revenue growth. Management is forecasting a low double digit organic gross profit CAGR through 2027.
Source: NSIT Investor Day Presentation October 2022
OPEX discipline should allow for positive operating leverage from the gross profit growth, enabling ~15% EBITDA CAGR over the next 5 years.
Free cash flow for NSIT is cyclical as the company invests heavily in working capital during periods of hardware growth. However, the counter-cyclicality of NSIT’s cash flow is attractive given that the business generates a substantial amount of cash when revenue growth slows, which can be utilized for share repurchases when the stock is cheap or M&A when targets are cheap.
NSIT’s 2027 forecast is all organic and given the strong free cash flow profile of NSIT, I expect M&A to supplement these LT targets. M&A is an attractive use of capital given that targets often command low multiples given narrow product or company relationships but can fill important gaps in a diversified portfolio such as NSIT’s. Examples of acquisitions that were important strategically include the acquisition of Datalink, which brough NSIT data center implementation expertise, and PCM, which gave NSIT a deeper presence in large corporates (below Fortune 500). Additionally, NSIT usually recognizes significant cost savings as part of any transaction, making the deals highly accretive financially. The balance sheet has ample capacity for M&A given leverage will end the year at ~0.5x net debt/EBITDA.
Management, Comp Structure, Activist Investor
Admittedly, the targets above seem aggressive, so an assessment of leadership and their incentives is important to ensure that shareholders and management are well aligned. Joyce Mullen took over as CEO at the beginning of 2022 after a long career at Dell. Her background in the hardware market is valuable in terms of managing these critical relationships, but arguably is less applicable to the LT objectives of growing cloud and services gross profit. To address this part of the growth algorithm, NSIT hired a new head of North America from Capgemini, a leading consulting organization, who has extensive global experience with software and services.
In terms of compensation, management is well aligned with shareholders. LT performance based RSU’s are tied to ROIC hurdles and relative total shareholder return. ST performance bonuses are tied to cloud and services gross profit growth. NSIT has pushed these RSU’s down to the sales force and tied incentive compensation metrics to services gross profit growth and overall gross margin improvement.
ValueAct, an activist hedge fund, owns a 13% stake in NSIT and has a seat on the board, providing additional shareholder alignment within the company. ValueAct arguably still sees a compelling investment opportunity in NSIT given that the fund was purchasing shares at all-time highs during Q1 ’23.
Valuation
As this portfolio transition materializes, I expect investors will reward the company with a higher multiple. NSIT has historically traded in a range of 8-10x EBITDA compared to CDW, which has traded in a range of 13x-18x. CDW has a structural advantage over NSIT by serving the SMB segment, which allows for better pricing, higher margins and more favorable payment terms. As such, I don’t expect the valuation gap to CDW to close entirely. However, I do believe that NSIT could easily trade in a 10x-12x EBITDA range over the next few years as the quality of the portfolio improves and returns on capital grow. Assuming a 10X EBITDA multiple on 2027 EBITDA $783mm (6.5% margin), yields a price target of $260, or a +16% annualized return from today’s price. A 12x multiple on 2027 EBITDA yields a price target of $322, or a +20% annualized return. EV/EBITDA is the appropriate valuation metric given that NSIT’s balance sheet is under-levered compared to peer CDW, which operates with leverage between 2- 3x, thus boosting EPS. Optimization of NSIT’s capital structure through a combination of M&A/share repurchases provides an opportunity for further EPS growth.
Summary Thesis
NSIT is effectively a tax on the secular growth of IT spend combined with increased complexity of IT deployments. The advent of cloud delivery, specifically, has increased IT complexity as this drives a need for decisions around on- premises v. off-premises (or hybrid) and coordination among multiple hardware and software vendors. NSIT’s role as a solutions integrator becomes more important in this dynamic technology landscape as clients increasingly rely on outside IT experts for advice and management of a complex network of vendors. While the secular growth drivers are attractive, the opportunity for NSIT’s stock lies in an improved financial profile as growth from higher margin software and services revenue outpaces hardware revenue growth, leading to structurally higher profit margins and higher returns on capital. Over time, I expect the improved financial profile of NSIT to materialize into a higher multiple for the business.
As always, if you have any questions about the portfolio or the market, please do not hesitate to contact me.
Christopher Godfrey
Important DisclosureThis report is solely for informational purposes and shall not constitute an offer to sell or the solicitation to buy securities. The opinions expressed herein represent the current views of the author(s) at the time of publication and are provided for limited purposes, are not definitive investment advice, and should not be relied on as such. The information presented in this report has been developed internally and/or obtained from sources believed to be reliable; however, Headwaters Capital Management, LLC (the “Firm”) does not guarantee the accuracy, adequacy or completeness of such information. Predictions, opinions, and other information contained in this report are subject to change continually and without notice of any kind and may no longer be true after the date indicated. Any forward-looking statements speak only as of the date they are made, and the firm assumes no duty to and does not undertake to update forward-looking statements. Forward-looking statements are subject to numerous assumptions, risks and uncertainties, which change over time. Actual results could differ materially from those anticipated in forward-looking statements. In particular, target returns are based on the firm’s historical data regarding asset class and strategy. There is no guarantee that targeted returns will be realized or achieved or that an investment strategy will be successful. Investors should keep in mind that the securities markets are volatile and unpredictable. There are no guarantees that the historical performance of an investment, portfolio, or asset class will have a direct correlation with its future performance. The composite performance (“portfolio” or “strategy”) is calculated using the return of a representative portfolio invested in accordance with Headwaters Capital’s fully discretionary accounts under management opened and funded prior to January 1, 2021. The performance data was calculated on a total return basis, including reinvestments of dividends and interest, accrued income, and realized and unrealized gains or losses. The returns also reflect a deduction of advisory fees, commissions charged on transactions, and fees for related services. For further information about the total portfolio’s performance, please contact Headwaters at www.headwaterscapmgmt.comor via phone at (404) 285 -0829 Investing in small- and mid-size companies can involve risks such as less publicly available information than larger companies, volatility, and less liquidity. Investing in a more limited number of issuers and sectors can be subject to greater market fluctuation. Portfolios that concentrate investments in a certain sector may be subject to greater risk than portfolios that invest more broadly, as companies in that sector may share common characteristics and may react similarly to market developments or other factors affecting their values. Headwaters Capital is a registered investment adviser doing business in Texas and Georgia. Registration does not imply a certain level of skill or training. For additional information about Headwaters Capital, including its services and fees, please review the firm’s disclosure statement as set forth in Form ADV and is available at no charge at IAPD - Investment Adviser Public Disclosure - Homepage . Past performance does not guarantee future results. |
Editor's Note: The summary bullets for this article were chosen by Seeking Alpha editors.
For further details see:
Headwaters Capital Q2 2023 Investor Letter