SPLV - Here's The Price I'll Buy ResMed Stock
2023-09-17 07:31:40 ET
Summary
- ResMed stock's high valuation from 4 years ago is finally being reflected in the current stock price.
- The historical earnings pattern of ResMed has been stable and consistent, making it a rare achievement.
- Using a 10-year earnings CAGR estimate, ResMed's stock is currently in the "Hold" category but could become a "Buy" if the price falls below $110 per share.
Introduction
It's hard to believe it has been 4 years since I've covered ResMed ( RMD ) stock. Back on September 23rd, 2019, ResMed was part of a series I wrote on what I termed "Sentiment Cycle" stocks. These were stocks of quality businesses that were significantly overvalued and likely to underperform the S&P 500 over the medium term of 3-5 years based purely on their valuation and historical earnings patterns. That article was titled " ResMed: A 10-Year, Full-Cycle Analysis " and I rated the stock a "Sell" based on valuation at the time. When writing bearish articles I always try to offer some alternative investments I think will perform better over the medium term. Here is what I had to say at the conclusion of the article:
My current suggestion is that owners of ResMed who would like to avoid part of the eventual correction in the stock rotate out of it and into a 50/50 mix of the Invesco S&P 500 Low Volatility ETF ( SPLV ) and the Invesco S&P 500 Equal Weight ETF ( RSP ) until ResMed's price falls to a more reasonable level that offers better forward returns. My expectation is that owners would be able to increase the number of ResMed shares they own by 20-25% using this strategy without spending any additional money.
This was all, of course, pre-pandemic. And the pandemic, as we'll see, boosted ResMed's 2020 earnings while the stimulus that followed boosted the whole stock market. I obviously didn't take those events into account in my 2019 article, but valuation (especially relative valuation) is something that acts as a sort of long-term weight on a stock, and now that the pandemic is over and stimulus money is waning, 4 years later, we can see the high valuation from 4 years ago is finally being reflected in the stock price.
I did update this strategy during the pandemic, including suggesting selling the SPLV position for RSP instead in early 2021, but let's just take the original suggestion here at face value from the original article. The 50/50 RSP/SPLV split would have produced an average total return over the past 4 years of +31.08% compared to RMD's +11.82%, which at this point in time is in-line the +20% outperformance I thought was reasonable to expect based on the valuation in 2019. Of course, due to the pandemic, RMD had a period in 2020 and 2021 of extreme outperformance.
Now that the stock price has sold off considerably, it's worth revisiting RMD to see what price it would make an attractive buy, and that's what I'll do in this article. I'll be using a similar approach to that which I used in 2019 with a few modifications due to the higher interest rate environment.
ResMed's Historical Earnings Pattern
The first thing I always check when analyzing a stock is what the historical earnings pattern has been. Earnings cyclicality is the main thing I check for, but I also look for other patterns like stagnation, unusual rises or declines, or erratic fluctuations that can't be easily explained. If I determine the historical earnings are cyclical, then I usually don't use earnings to value the stock because they can be too unpredictable and can often send the wrong signals regarding valuation. Also, if earnings are very erratic I sometimes immediately put the stock in the "too hard pile" if I don't think historical earnings are a reasonably good guide for the future.
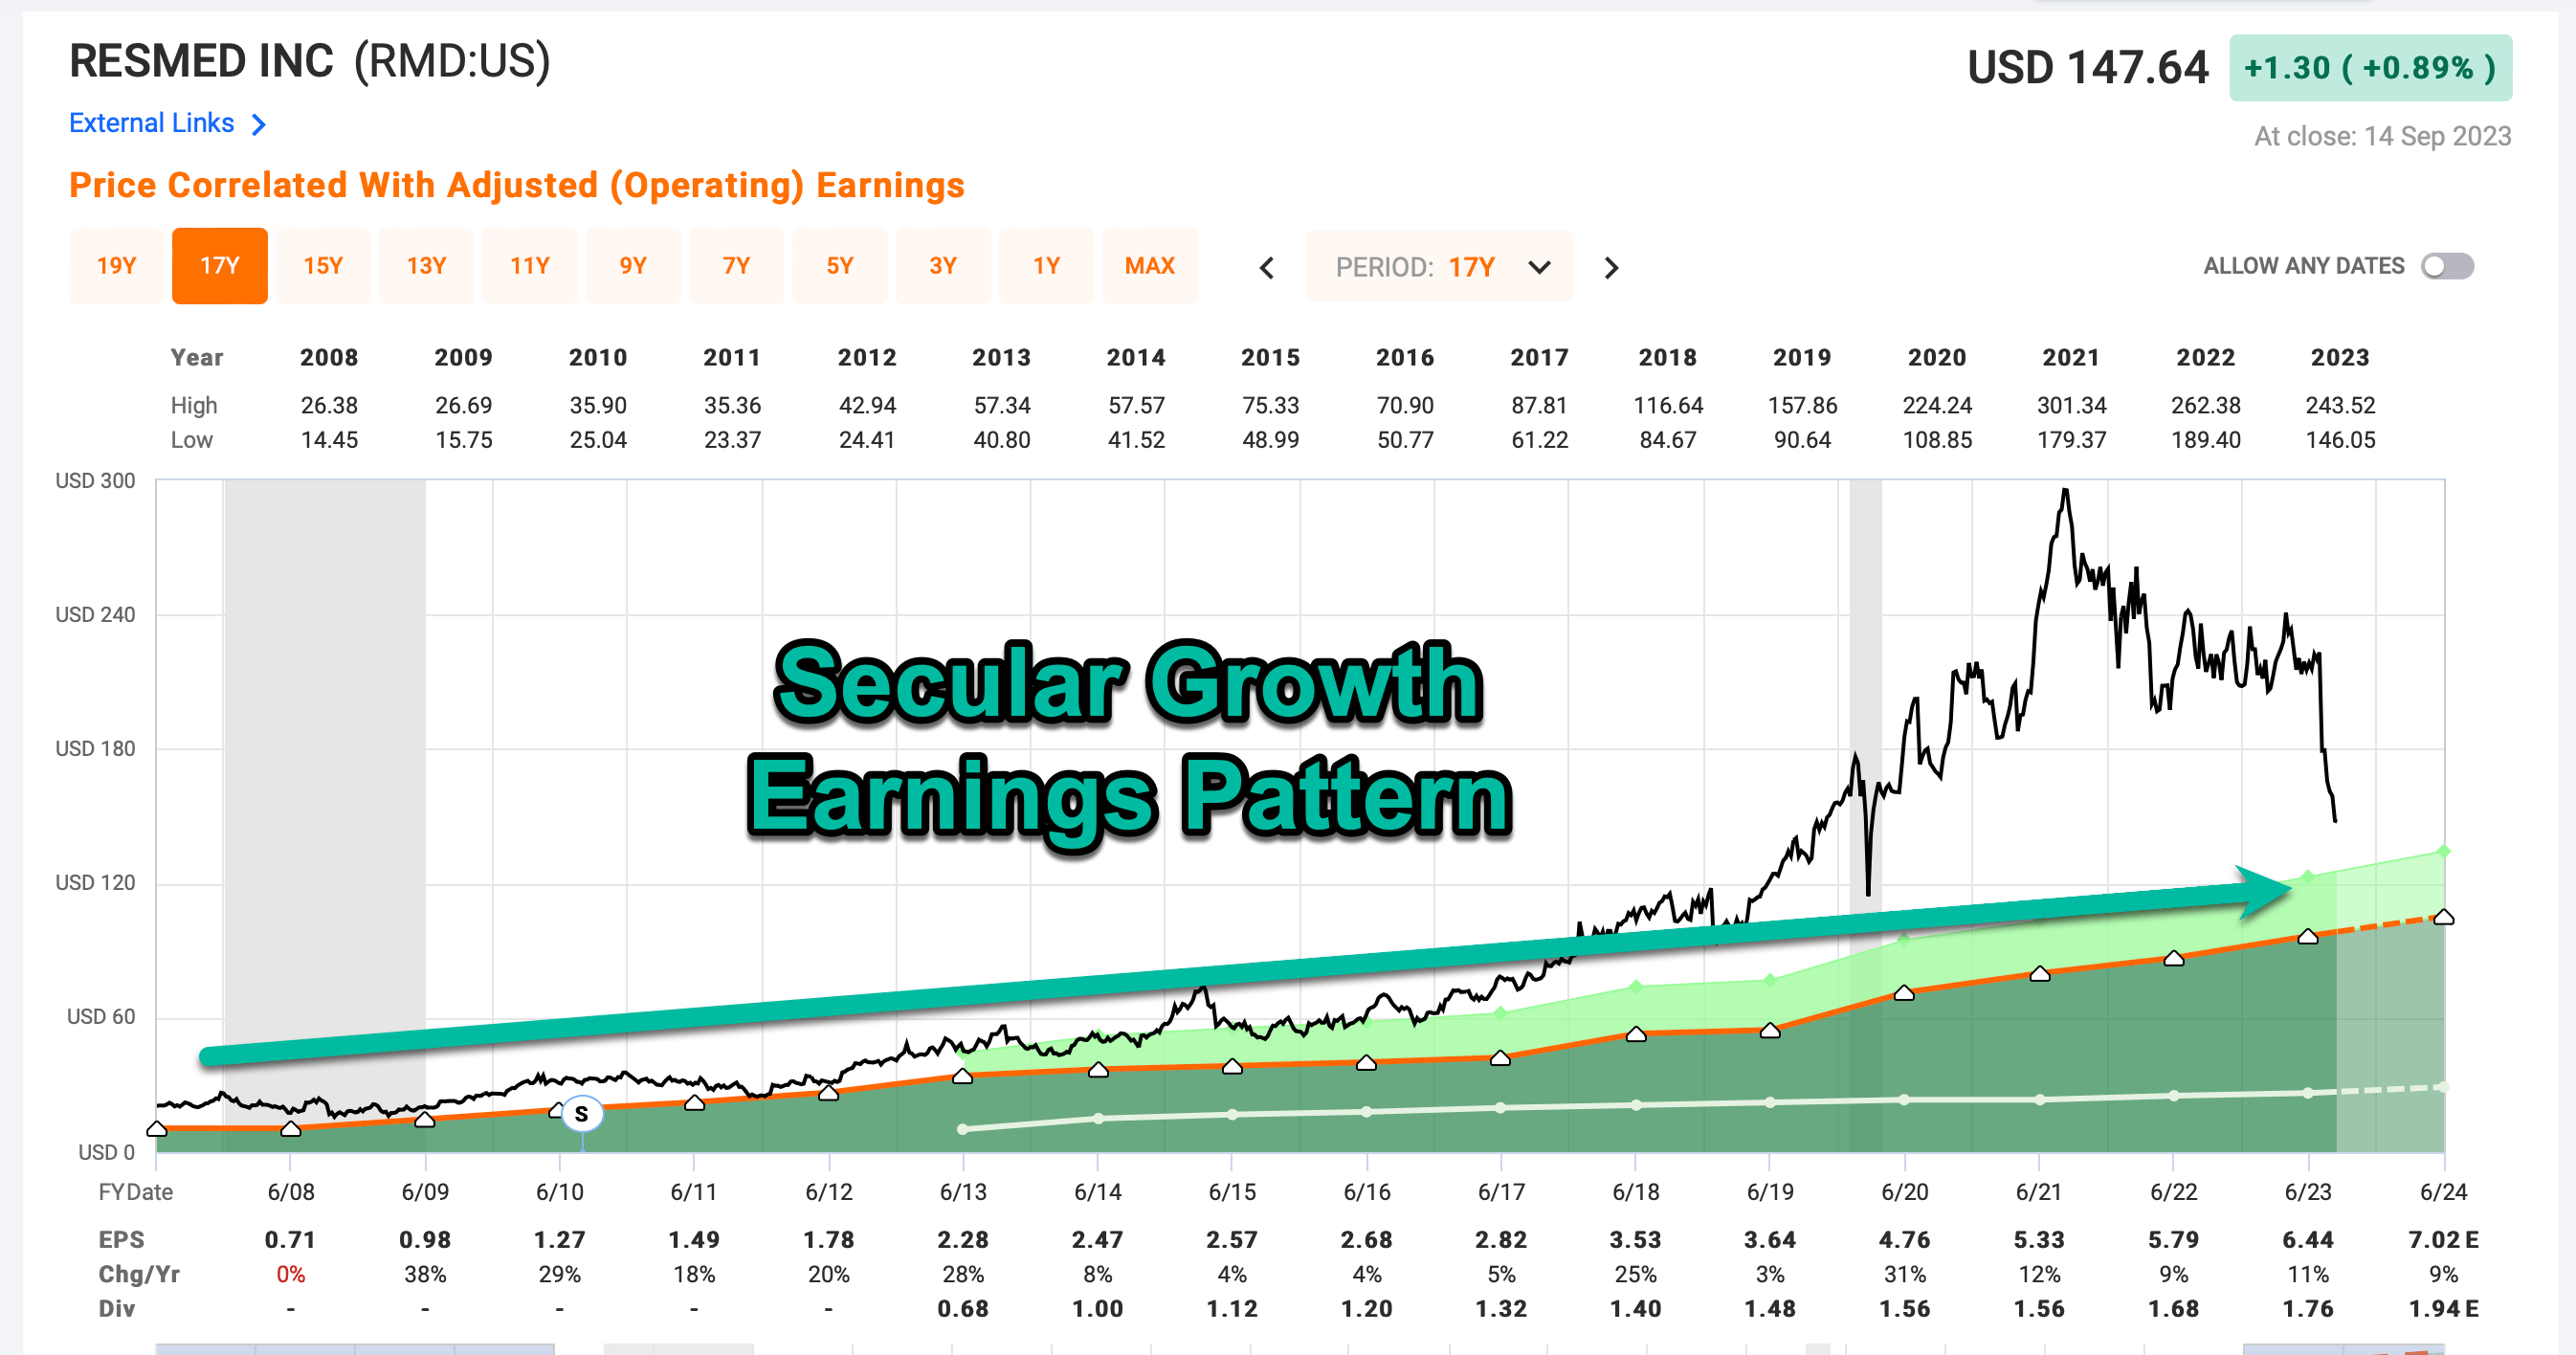
The dark green shaded area in the FAST Graph above represents ResMed's historical earnings per share. Over the past two decades they have never experienced a negative year of EPS growth. The worst year was in 2008 when EPS growth was flat. The last time I checked the stats on pure secular growth businesses a couple of years ago, there were fewer than a dozen publicly traded businesses that had been able to avoid any negative earnings growth years since 2006, and several of those (like Alphabet ( GOOG ) ( GOOGL )) had negative earnings growth last year and fell off the list. So ResMed being able to do this is a rare achievement. Because earnings growth stability is an attribute that has been highly valued by the market during the past several year, ResMed stock has consistently traded at a rich valuation since 2018. My only reason for being bearish in the stock in 2019 was due to the valuation. The valuation peaked in mid-2021 at an incredible 55 P/E ratio, which was basically totally disconnected from reality. But, sometimes the market does such things. Now the stock price is about -50% off those highs, and earnings have grown considerably since 2019, so it's a good time to reevaluate this one to determine a good price for a potential purchase.
Since earnings have remained very steady over the years, it is appropriate to carry on with an earnings-based analysis.
ResMed's Current Valuation
This summer I've been adjusting my valuation method to account for three new factors that have grown more relevant in the past couple of years. Since I started using this valuation method in 2019, I have estimated about 1/3rd of the stock valuation by assuming the P/E of a steady-earning stock like ResMed would likely revert to its mean P/E over time. I have decided to do away with that portion of the analysis because I think with higher interest rates likely not going back to zero without a major recession, it's unlikely most stocks maintain the average P/E ratios they had when interest rates were near 0%. So, I will no longer include a mean reversion portion of my analysis and instead, I will only focus on the business earnings from the perspective of an owner of the business.
The other new factor relates to interest rates as well. In the past, I typically didn't include a business's debt and other obligations as part of my valuation process because interest rates were low so the cost of capital was low and didn't appear to be likely to change during the last economic cycle. Now rates have risen, so as time goes on and businesses need to refinance their debt over time, it's likely to be a drag on future earnings. Conversely, businesses with net cash can actually earn a real rate on that cash, so they should be more valuable going forward. In order to account for this, I now adjust the price of the stock (for valuation purposes) based on the total enterprise value of the business rather than market cap.
The third adjustment I've made is that I slightly altered the way I calculate "Recession Buy Prices" for stocks in order to determine the prices I aim to pay if I think the risk of recession is high, or if we are actually in a recession. I'll explain more about this later in the article. For now, let's get into the basic analysis.
The most basic way I perform a valuation for a steady-earning stock like RMD is to calculate how much in earnings I would likely collect over a 10-year period if I owned the business and kept all the earnings for myself. I convert that amount of collected earnings into a CAGR percentage and use that percentage to decide whether or not the valuation is attractive. I do this by using a combination of earnings yield and earnings growth expectations. I typically base my earnings growth expectations on what the growth rate has been over the previous cycle. In this case, I'm using a time period that runs from 2015-2023.
I've had a few questions about my choice of limiting my assumptions to only 10 years' worth of earnings and nothing beyond that, even though in reality I would expect the business to keep earning money beyond 10 years. There are a couple of reasons I do this. One of them is simply to achieve a margin of safety, so I always know I'm making relatively conservative assumptions. Another is that I've found investors have a tendency to extrapolate earnings far into the future, sometimes more than 20 years into the future, and I don't think anyone can reasonably predict earnings that far out. Additionally, it can be easy to justify very high valuations simply by extrapolating earnings growth farther into the future. So, limiting my time-frame to 10 years is a way to protect against those tendencies which I think can get investors into trouble.
I would also emphasise that I view this method as a valuation estimation process than one of mathematical precision even though I use some math to share my buy prices, and I do think the 10-year business CAGRs I estimate can be useful to roughly compare to bond yields and other business earnings yields. But even there, I prefer to compare to something like 3-month to 2-year treasury yields than to 10-year yields. Thinking about things in this way likely isn't the way an economist would do it, but I think, in a strange way it represents the practical reality of stock investing better. The stock market usually reacts to what has happened less than 2 years in the past and projects less than 2 years into the future. In order to find values in the market, usually investors need to consider a different time-frame both from history and going into the future. So, I often use 10-years or more from the past to predict 5-10 years in the future.
ResMed is a good example, when I was bearish 4 years ago, I was correct to be bearish if looking ahead 5 years and estimating returns. I was incorrect if one only looked 1, 2, or 3 years into the future.
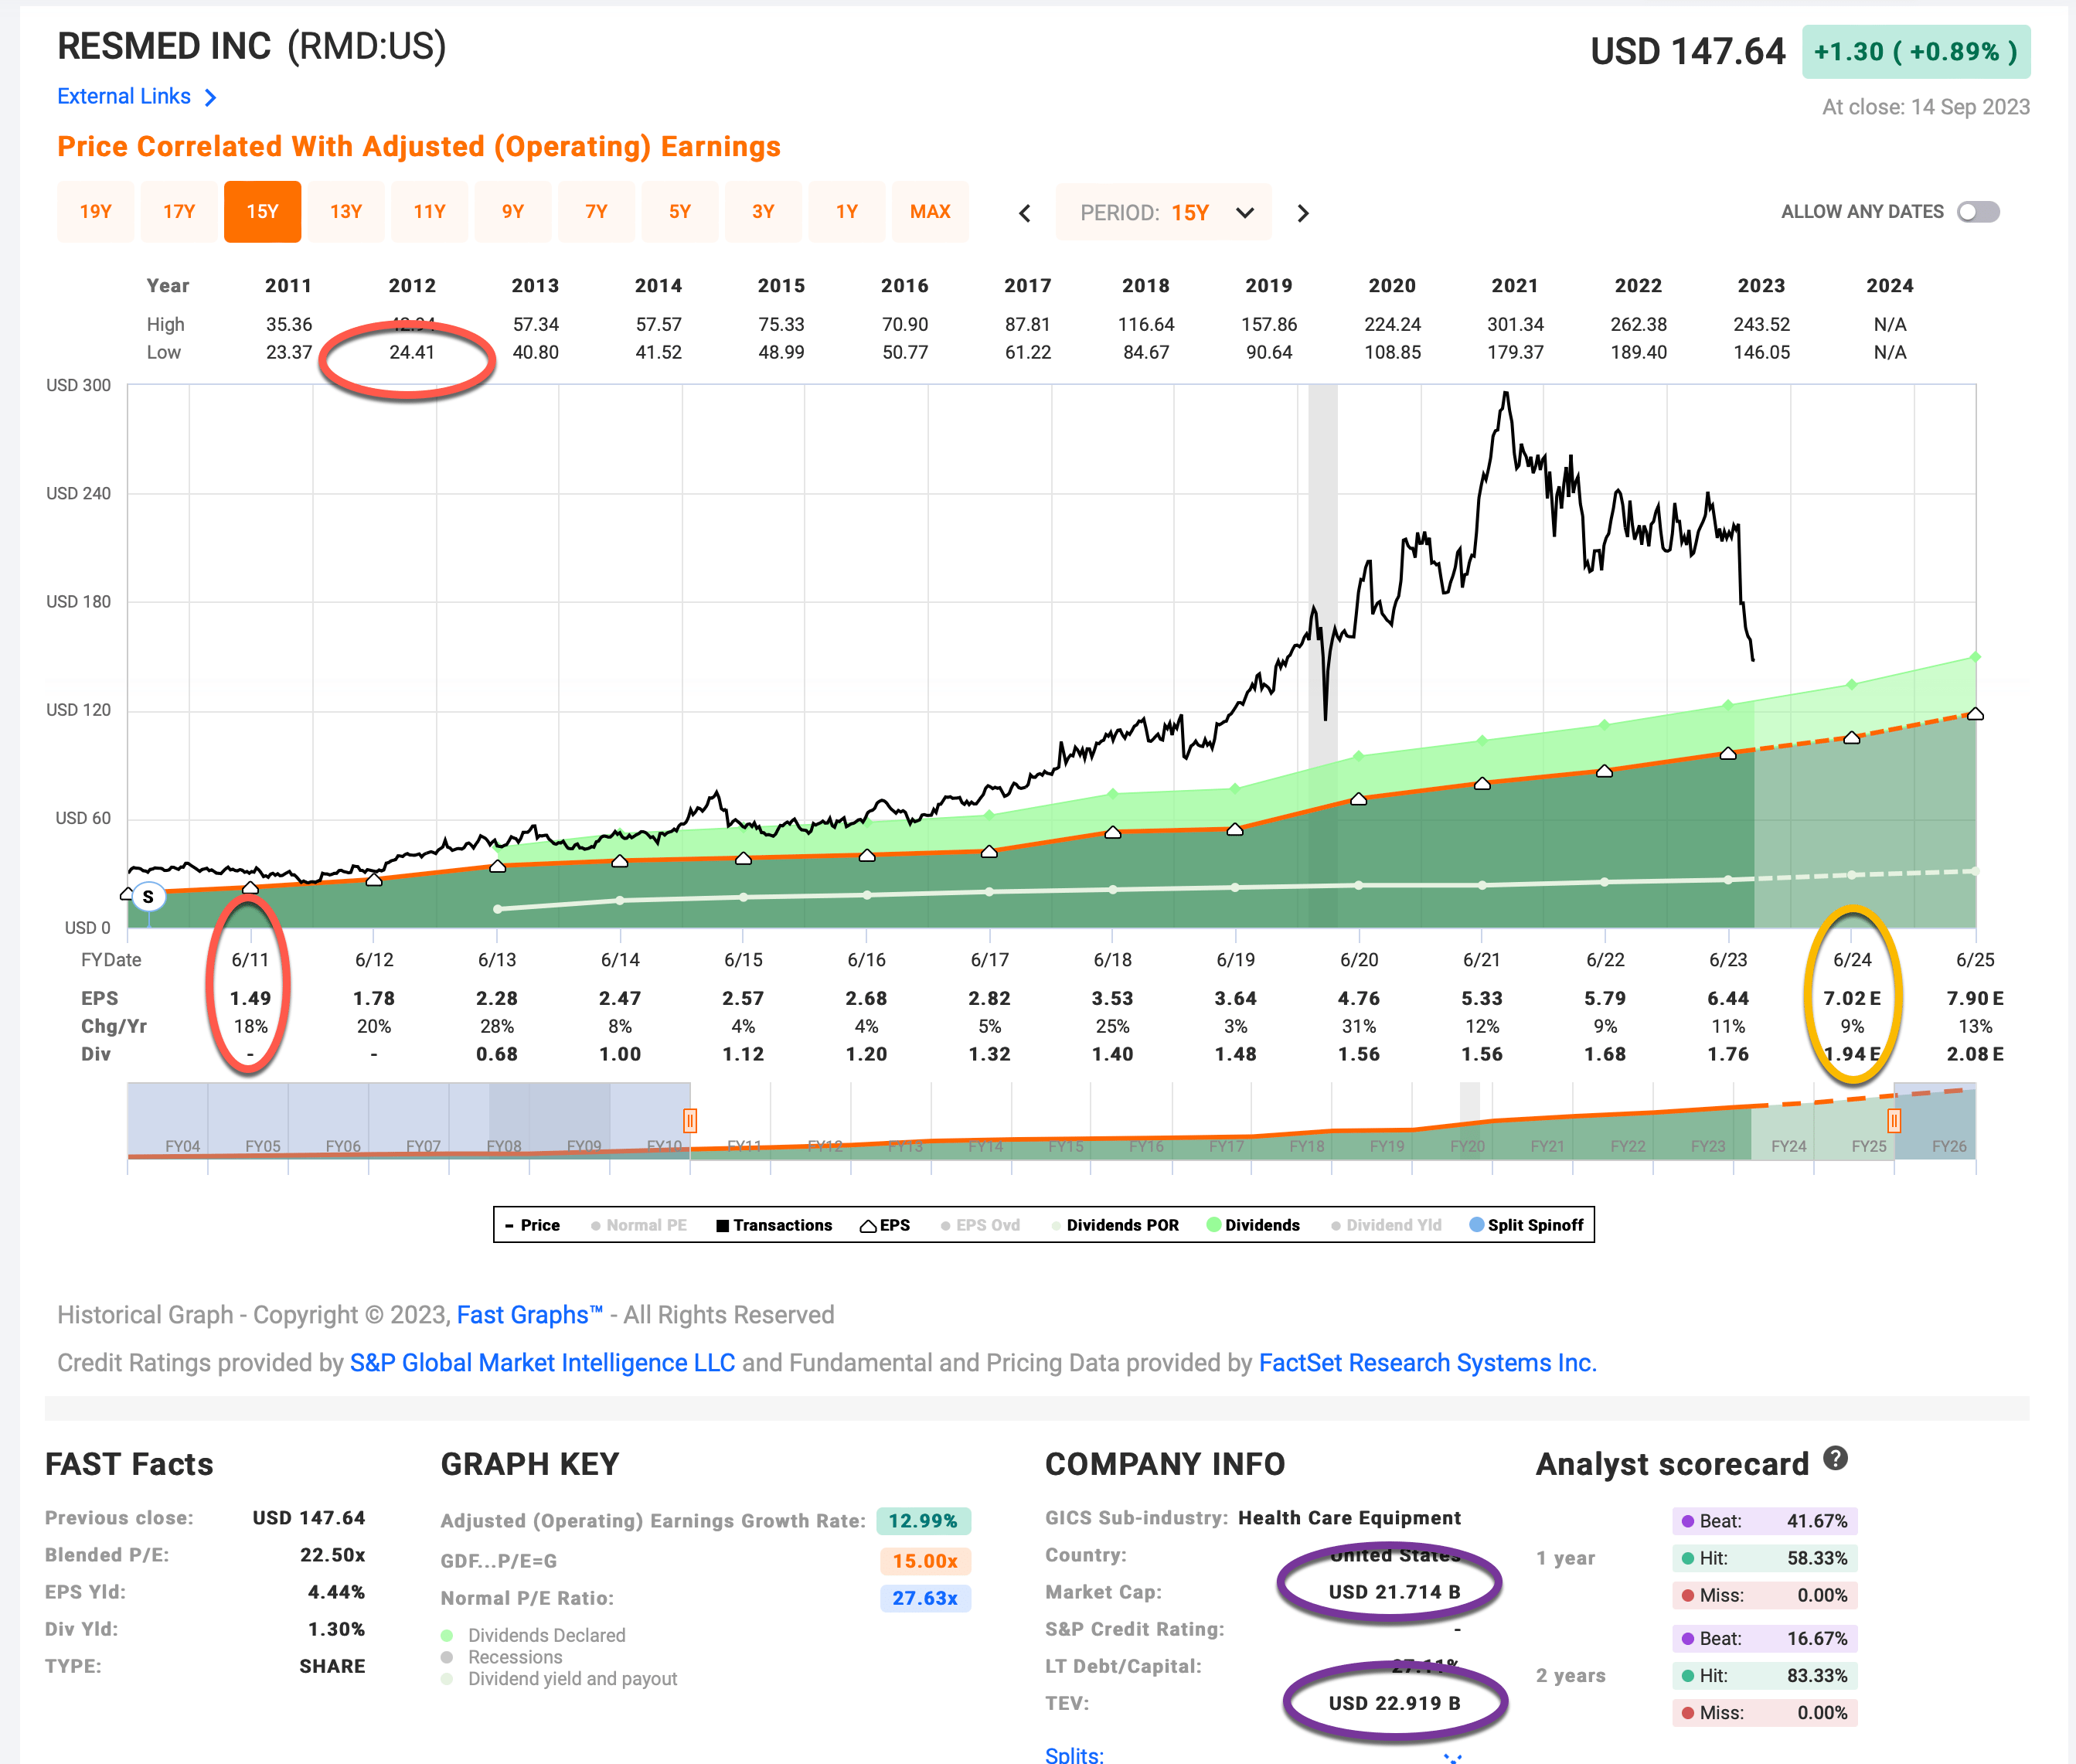
The first piece of information I need to estimate the 10-year business earnings CAGR is earnings, and typically I look at the current year's analyst estimate because the market tends to be forward-looking. Right now analysts expect $7.02 per share for fiscal year 2024 (circled in gold on the FAST Graph).
The second thing I want to take into account is debt or any other obligations the business might have, and adjust the stock price used for the valuation accordingly. The way I do this is to divide the Total Enterprise Value by the Market Cap (circled in purple) and when we do that we see the Total Enterprise Value is only about 5% higher than the Market Cap. The way I adjust for this in my valuation process is to assume that the stock price is about 5% higher than the price it is actually trading at. As I write this RMD is trading at $146.03, so I will treat it as though the price is really $155.33 per share. (This probably isn't a perfect way to go about doing this, but I track and cover a lot of stocks so I try to have practical processes that I can use quickly while still being relatively effective in arriving at a good ballpark valuation.)
When I do this, I get a debt-adjusted earnings yield of about +4.58%.
Next, I want to estimate how fast those earnings are likely to grow over time, and in order to do that I look at how fast those earnings have been growing, year-by-year since 2015 while controlling for buybacks (because buybacks will inflate earnings per share).
ResMed has actually been a net issuer of new shares over this time period so there is no need to make earnings growth adjustments because the EPS is on a per share basis and already negatively adjusted for the share increase. This makes for a pretty easy earnings growth calculation since there are no buybacks or negative earnings growth years during this time period and I get an earnings growth rate from 2015-2024 using forward earnings of +11.76%. As one would expect, this is right in line with FAST Graph's estimate, which uses blended earnings of +11.01%.
Next, I'll apply that growth rate to current earnings, looking forward 10 years in order to get a final 10-year CAGR estimate. The way I think about this is, if I bought RMD's whole business for $100, it would pay me back $4.58 plus +14.76% growth the first year, and that amount would grow at +14.76% per year for 10 years after that. I want to know how much money I would have in total at the end of 10 years on my $100 investment, which I calculate to be about $188.76 (including the original $100). When I plug that growth into a CAGR calculator, that translates to a +6.56% 10-year CAGR estimate for the expected business earnings returns after adjusting for debt and other obligations.
10-Year, Full-Cycle CAGR Estimate
Using my old valuation method, which included a mean reversion factor and did not take debt into account, I used a "Hold Range" for the 10-Year CAGR between 4% and 12%, and if it was below 4% the stock would usually be a "Sell", and above 12% a "Buy". Now that I have removed the P/E mean reversion part of the estimate I've tightened the "Hold" range from 5% to 8% because there is typically a lot less fluctuation when it comes to average business earnings than there is with the stock price. The current +6.56% 10-year business CAGR estimate would put RMD stock squarely in the middle of the "Hold" category at its current price.
Assuming the earnings metrics stay about the same as today, RMD would become a "Buy" using my basic valuation method when the price fell below about $113 per share.
Next I'll briefly examine what we might expect in the event of an economic recession.
Recession P/E
Since January of 2022, I've been adjusting my portfolio and preparing for a stimulus boom/bust and a likely recession. While most of the stimulus money bust has happened and that's why the market experienced a bear market last year, due to lots of excess savings, a delay in student loan repayments, and lagged effects of higher interest rates, thus far we haven't had an economic recession in the US. I think over the next 6-9 months recession risk in the US remains high, though, so I am using stricter standards for new stock purchases. One of the techniques I use to try to get lower prices and avoid paying too much near economic peaks is what I call the Recession P/E, a variation of which I used during the pandemic in 2020 with great success. I've made a few adjustments to the technique since then, and I'll share those here.
The thought process with the Recession P/E is to try to find the most pessimistic P/E the stock experienced in the past and to then be prepared to buy the stock when it is within a certain range of peak pessimism. For example, if the most pessimistic P/E the stock experienced during a previous downturn or recession was, say a 10 P/E, then I might be willing to buy a stock if the current Recession P/E was within 30% of a 10 P/E, or a 13 P/E. So, we aren't trying to pick an exact bottom in the price, mostly what we are trying to do is use peak earnings to current price as a more stable guide to estimating how low a stock might fall for a given stock during a recession when current and forward earnings are fluctuating a lot.
The way this works is I look at the business's history during a downturn and I take the lowest price the stock fell to and create a ratio using the peak annual earnings per share the business experienced. That is the "Recession P/E". I use my judgment regarding which historical downturn is most likely to repeat in the future. In the case of ResMed, earnings haven't fluctuated much even during recessions, and actually seemed to have the most pessimism historically around the year 2012. I circled the metrics I used in red in the FAST Graph above. This resulted in a Recession P/E of 16.38. Because that is a pretty high P/E during a recession in absolute terms, and it wasn't taken during a full-blown recession or bear market, I have decided to not add a buffer and just use the 16.38 metric as a guide.
As it turns out, that price is only slightly lower than the basic valuation buy price, and comes in at $109.51.
Conclusion
Each investor will have to make a judgment for themselves how likely long-term historical earnings trends are likely to continue into the future. I have found that about 80% of the time the historical trend will hold fairly well as long as investors pay attention to certain obvious warnings signs of a business decline (which I don't see with RMD) and buy with a margin of safety, the rate of negative returns occurring is pretty low. I typically buy 1% or 2% portfolio weighted positions and trust in the overall process since I don't know ahead of time which particular stocks will be the winners or losers.
ResMed's stock price is at least getting into range where it is interesting, and unless something really unusual happens, I will likely be a buyer if it falls below $110 per share. That might be adjusted down slightly if earnings really disappoint this year, but even if that happens I doubt that buy price would fall below $100 per share. It's worth keeping this stock on one's radar.
For further details see:
Here's The Price I'll Buy ResMed Stock