CTVA - High-Quality Dividend Growth Near 52-Week Lows: Chevron Is Shaping Up
2024-01-08 10:48:11 ET
Summary
- A list of high-quality dividend growth stocks is identified based on proximity to 52-week lows.
- Pfizer, Bristol-Myers Squibb, and ResMed appear attractively valued based on Future and Historical fair valuations.
- Chevron appears to be a good investment opportunity due to its high quality and sustainable dividend, however, there are risks to be aware of.
Introduction and Background
In my last article, I was excited about the number of investments that I had been able to make based on attractive valuations. With the rally over the last couple of months, I have been finding it harder to identify those same attractive opportunities and have mostly been sitting on the sidelines (though the rally does make me feel like a better investor than I probably am). I did add to positions in Pfizer (PFE) and Cisco (CSCO) in November, as well as Hershey (HSY) in December, but otherwise, I've been keeping the powder dry until valuations look more attractive. That doesn't mean that I'm not regularly updating the valuations of the 100 or so high-quality dividend growth stocks that I monitor in my watchlist to make sure I don't miss the opportunity.
If you've been following along, you know that one of my favorite ways to look for value in this high-quality dividend growth space is to screen for those stocks trading near 52-week lows. For this exercise, I decided to filter my watchlist by companies that are trading at less than 33% of their 52-week range (52-week low being 0% and 52-week high being 100%).
Using this first pass criteria, we will be looking at the following list of companies:
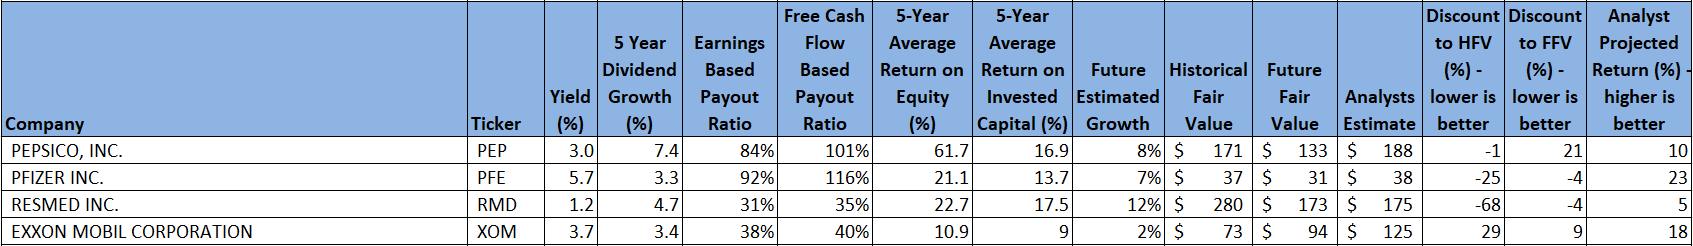
Fair Value Estimation
As I've described in previous articles, I like to calculate a fair value in two ways, using a Historical fair value estimation, and a Future fair value estimation. The Historical Fair Value is simply based on historical valuations. I compare 5-year average: dividend yield, P/E ratio, Schiller P/E ratio, P/Book, and P/FCF to the current values and calculate a composite value based on the historical averages. This gives an estimate of the value assuming the stock continues to perform as it has historically. I also want to understand how the stock is likely to perform in the future so I utilize the FinBox fair value calculated from their modeling, a Cap10 valuation model, FCF Payback Time valuation model, and a 10-year earnings rate of return valuation model to determine a composite Future Fair Value estimate.
I also gather a composite target price from multiple analysts including Reuters, Morningstar, Value Line, FinBox, Morgan Stanley, and Argus. I like to see how the current price compares to analyst estimates as another data point, and as somewhat of a sanity check to my own estimates.
Plotting three variables on one plot is tricky but using a bubble plot allows us to visualize three variables by plotting the Historical fair value versus the Future Fair Value on a standard x-y chart, and then use bubbles to represent the size of discount relative to analyst estimates.
Author calculation of Historical and Future Fair Value, analyst estimates
This chart is insightful once you understand how to interpret it. What we are looking for are stocks that are trading at a discount to both the Historical Fair Value and the Future Fair Value. So, those stocks that are farther to the left, and farther to the bottom, are potentially the stocks trading at the largest discount to fair value. This would be the bottom left quadrant of the graph. Additionally, those stocks with the biggest bubbles are the stocks that are trading at the largest discount to analyst estimates, so in theory, stocks in the lower left quadrant that also have large bubbles, should be very decent candidates for investment.
The chart suggests that Pfizer ((PFE)), Bristol-Myers Squibb ( BMY ), and ResMed ( RMD ) are attractively valued from a Historical and Future Fair Value perspective. It also suggests that Nike ( NKE ), and Chevron ( CVX ) are also below Historical Fair Value, while being close to Future Fair Value.
I currently own all five of these stocks and believe that each could be an excellent candidate for further investigation, and potential investment, especially for long-term investors.
As a matter of fact, my more recent articles cover several of these, and I refer you to them for further investigation, since I still believe they are relevant. PFE's is here , BMY's is here , and NKE's is here .
One thing you can be sure of if you are reading my articles, I buy what I write about. As I stated above, I added to my position in PFE right after I published my article on it in November. I also added to my positions in BMY and RMD in October, and NKE in September. I've been watching CVX again but haven't invested more since March. My cost basis is pretty low in CVX, and I worry about oil prices, the economy, geopolitical influences, and the future of carbon. Having said that, with a lack of other attractive ideas, I thought I'd do a deeper dive to help firm up my decision on whether to buy more CVX.
Chevron Preliminary Analysis
I like to start simple when analyzing companies. CVX has a 5-year average Return on Equity of 9% and Return on Invested Capital of 6.3%. These, frankly, are not great numbers, and are below my thresholds for investment for most companies. However, CVX, and other energy companies had some really challenging years that bring the 5-year average down. The most recent results are 16% for RoE and a little over 11% for ROIC. These are at the lower end of my limits but demonstrate improvement potential. The weighted average cost of capital for CVX is around 9.5%, which compared to the ROIC doesn't offer much margin for growth. Morningstar's Narrow Moat rating suggests what we probably all know, which is this is an attractive, but competitive industry, however the Exemplary Capital Allocation rating suggests CVX is doing well within the industry. CVX is currently 3-star rated at Morningstar, though it's close to the 4-star value, suggesting it is likely on the slightly favorable side of fair value, which aligns well with my valuation.
Now, looking at the dividend, CVX's 45% Earnings-based payout ratio and 56% Free Cash Flow-based payout ratios are good, and offer the margin I like to see for an investment that I know can be pretty cyclical. The 5-year dividend growth rate of around 6% is a little lower than I like, but the starting yield of 4% coupled with the low payout ratios is good. My estimated future growth rate for CVX is below the dividend growth rate, which is something that concerns me, though I know CVX has plans to improve the growth story moving forward (though who doesn't).
One more source I like to check is the Seeking Alpha Factor Grades. Though these tend to be more short-term in focus than my investment horizon, I consider the grades as a guide of what to look for in answering the question of whether the valuation may be due to shorter term issues, or more systemic.
Seeking Alpha
The challenge with the factor grades is that they are relative to the rest of the sector, and this is a sector with some current, and especially, past challenges. Within the sector, CVX is arguably one of the higher quality companies manifest by the Profitability factor, so perhaps accepting a poor relative valuation is part of the price of the relative quality. Growth, as mentioned, hasn't been, and unfortunately, does not look to be particularly strong, and Momentum is a challenge due to many of the unique risks CVX has right now.
Chevron Historical Valuation Analysis
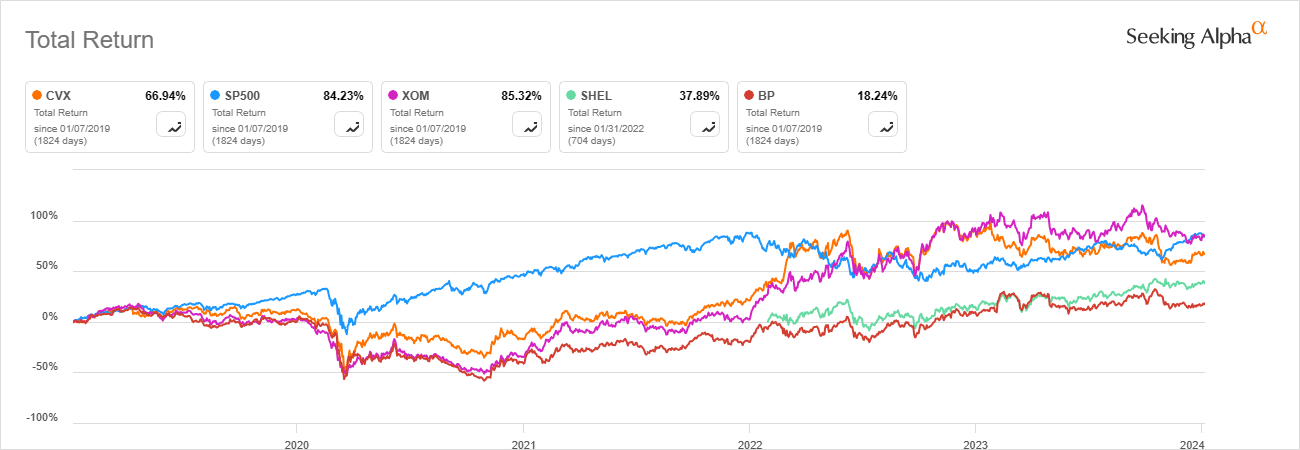
I always like to start my historical assessment of a stock with a look at performance compared to the S&P500 and relevant peers over the past. This isn't particularly useful by itself, but can provide an indication of potential, as well as sentiment. I decided to throw XOM, SHEL, and BP onto the chart for obvious comparison.
With oil prices as low as they were for several years, it is no surprise that this sector underperformed the broader market during that period, as profits and cashflows were challenged. However, also of note is the investment potential that exists when oil prices are higher, as CVX and XOM were able to catch up with the broader market. The recent divergence of CVX and XOM is interesting, given the very similar levels of performance historically. That likely comes back to some of the current risks that are unique to CVX.
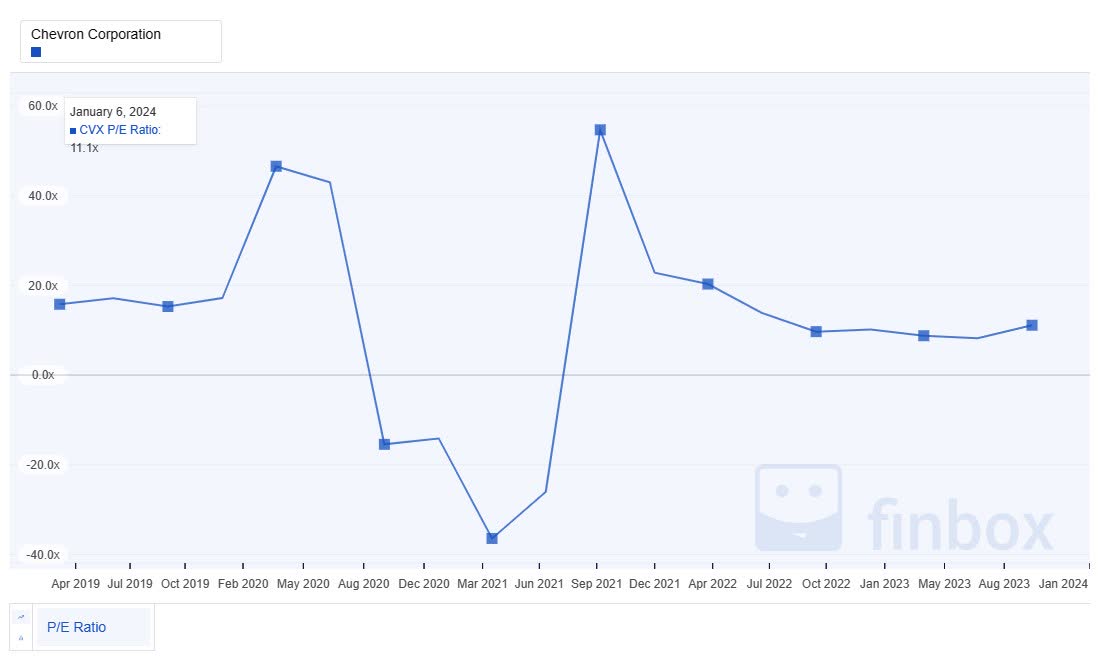
From a historical comparison perspective, two of the fundamentals I like to investigate are historic P/E and yield. Low P/Es relative to history, coupled with high yields compared to history can often indicate attractive valuation, assuming the underlying business is sound.
CVX's average P/E chart shows that it may be just under fair value relative to its 5-year average of around 11.9. The chart also shows the depth of the cycle when oil prices are too low to support the cost of capital. Hence, the need to ensure a healthy margin of safety.
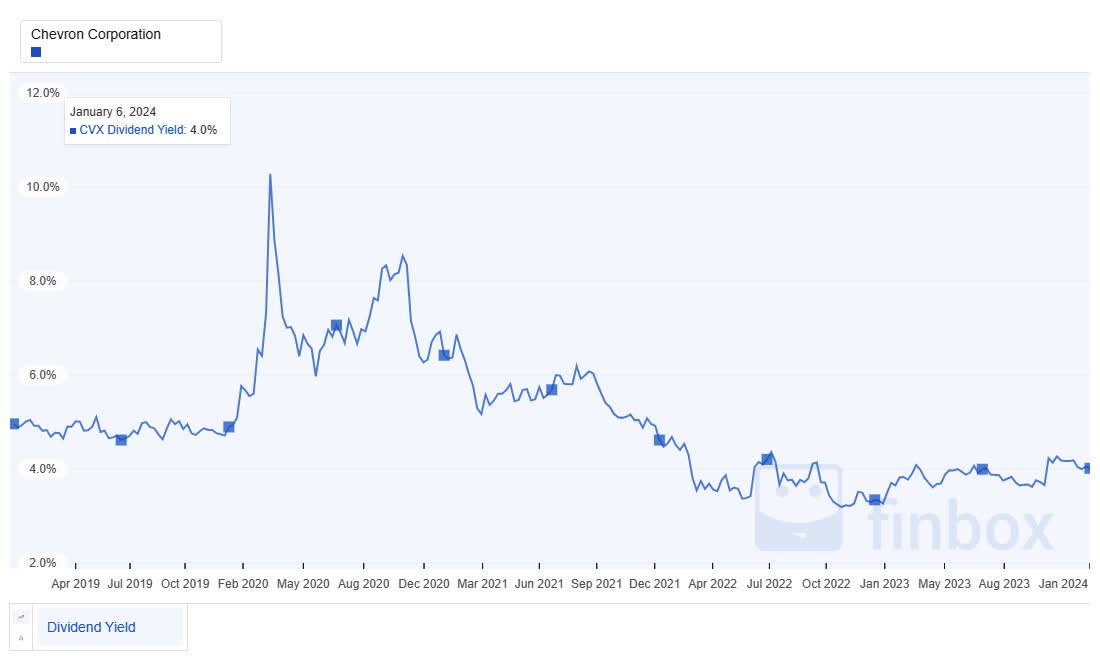
From a yield perspective, CVX is quite a bit lower than the 5-year average of 5.1%. Obviously, in retrospect, when the profitability and cash flows looked so scary, that would have been an excellent time to buy. Relative to more recent history, and relative to what is readily available for other high quality dividend investments, the 4% current yield is reasonably attractive.
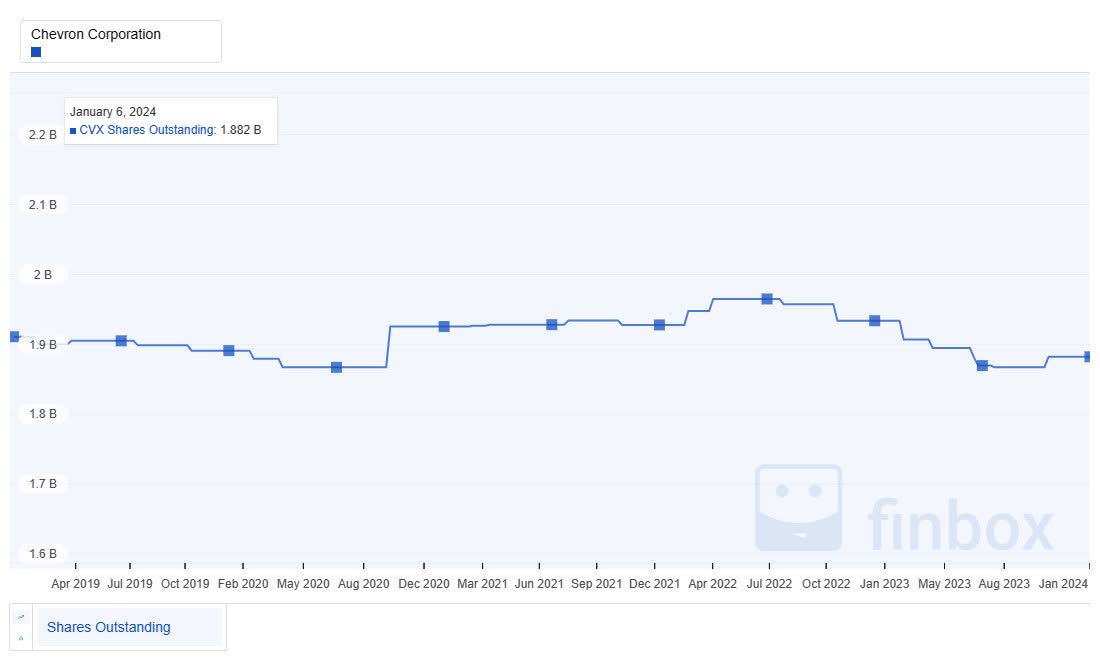
A key part of the Total Shareholder Return includes stock buybacks, which are also important to dividend growth sustainability. Over 5 years, the number of shares outstanding is down, however, it has been bumpy. On the other hand, for my dividend investments, if the company also regularly buys back shares, I view that as an extra margin of safety, since most companies will likely pull back on buy backs prior to sacrificing the dividend, as long as dilution doesn't get out of hand.
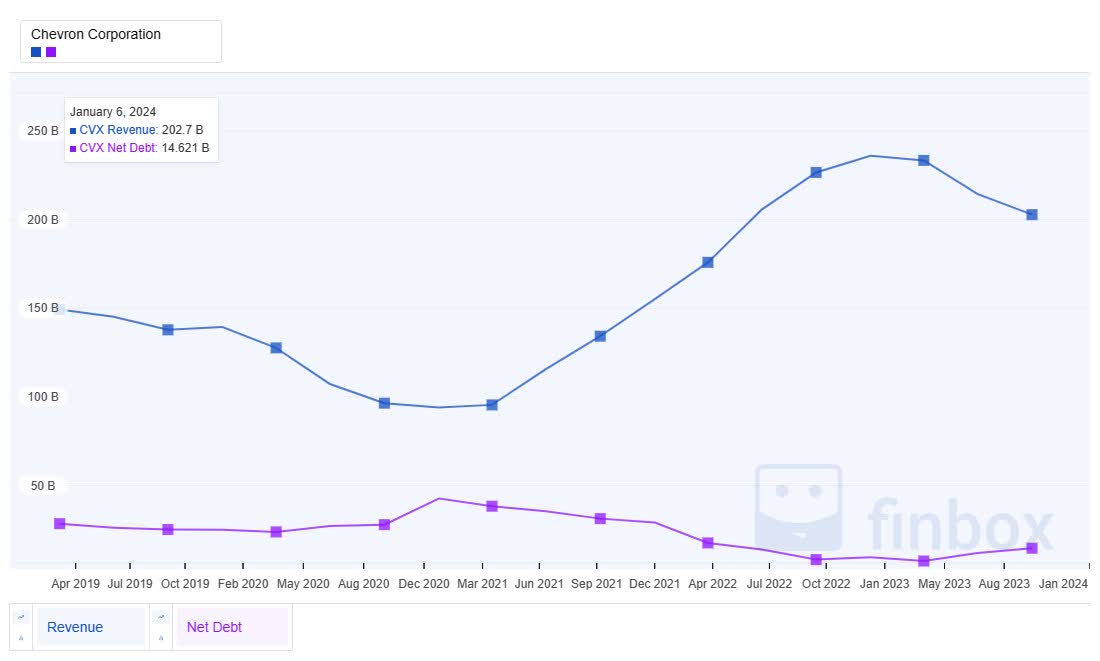
Comparing revenue to net debt, we can see why CVX has such a strong credit rating. Obviously during COVID and the times of low oil prices, debt did come up, but as soon as the revenues and profits rebounded, the debt was paid back down. The percentage of debt as a function of revenue is very manageable. Low debt is something I also love to see in my dividend payers.
CVX has been paying a growing dividend for a long time - 36 years. They have done so while enduring a lot of ups and downs. The 5-year average growth is around 6%, and obviously changes depending on how the company is doing. I do appreciate the overall stability and consistency.
Dividend growth doesn't do any good if the growth is not sustainable. The chart of the earnings and free-cash-flow-based payout ratios show the cyclicality and recent challenges as well as any. During COVID and when the oil prices were low, the payout ratios got unsustainably high, contributing to the growth in debt we saw above. However, when times are good, the payout ratios look very attractive. As we've already stated, this gives us a feel for how much safety margin this company requires to weather the downturns.
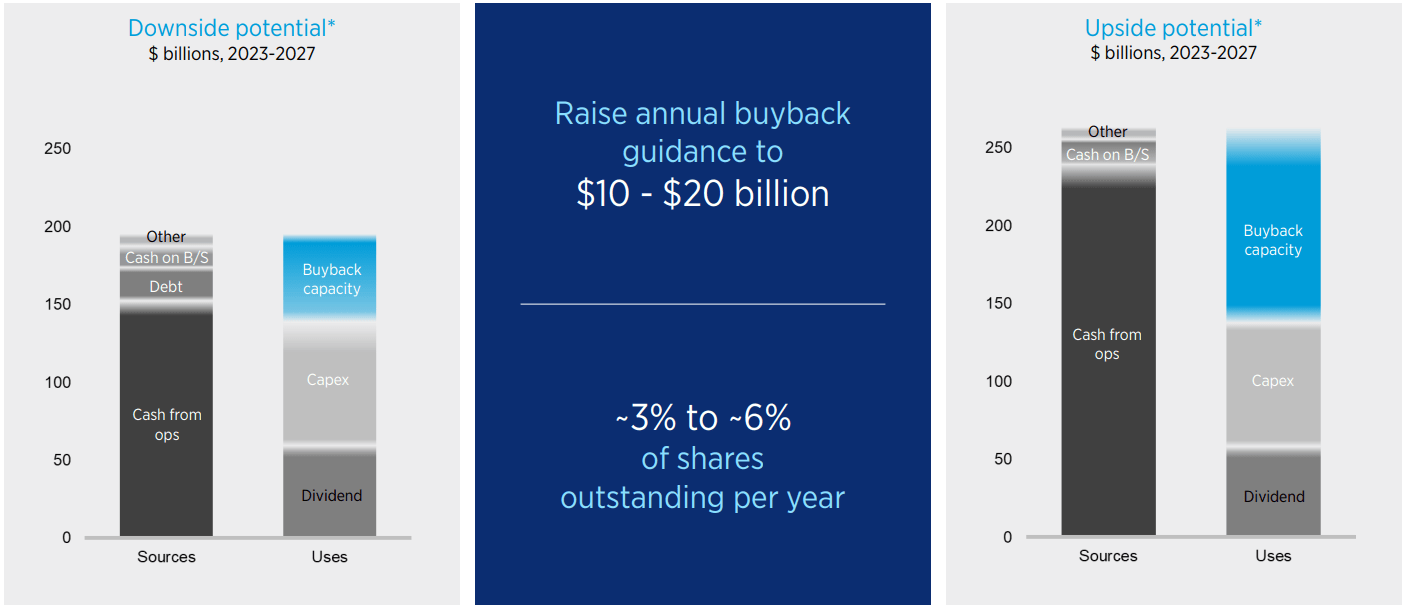
CVX understands the need for resiliency, and the importance of the dividend. As we've discussed, they've been paying a growing dividend for 36 years, through many different business challenges. It is good to see in their October 2023 Investor Presentation that they are playing through these scenarios as a course of business. We can see what will happen in downside and upside scenarios, both of which show strong dividend sustainability. No surprise, in the downside, share buybacks pull back, as well as some small decreases in Capex, but the business investment is still healthy.
Chevron Future Valuation Analysis
Because we want our dividends to grow in the future, not just the past, we need confidence that CVX is on a sustainable path that can weather the cycles inherent to the business.
Looking at future Earnings Per Share projections, CVX does have some warning signs that make me wonder if now is the best time to invest. Earnings per share are projected to fall for the next few years. Management is aware of this challenge and is putting in place investments and strategies to overcome this, however, at this point, this is clearly a warning sign.
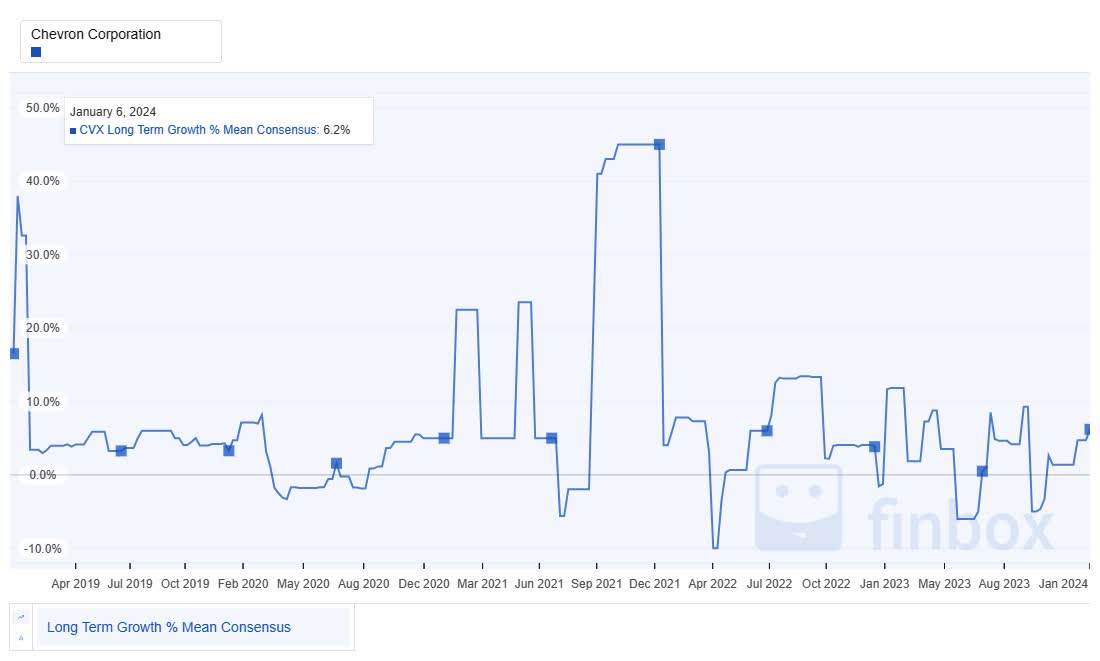
Growth is so important, yet also so hard to predict. Though we are thinking about the future in this section, I like to look at the history of growth forecasts to see how they align with the future predictions. We can see that analysts have been all over the place on the growth predictions. Drawing an average through it, we come out with something that looks like low, single-digit growth predictions.
My own estimate for CVX's forward growth is around 3%. I derive this from a combination of various growth projections and growth models. I personally feel like an average, mid-single digit growth expectation is reasonable for CVX, with some big swings along the way.
For a dividend growth investor, understanding future dividend growth potential is also important, especially in as much as it is sustainable. Here are the long-term dividend growth projections for CVX. Perhaps no big surprise, given the relative consistency in dividend growth, even during the storms, the predictions are for that same consistency to continue.
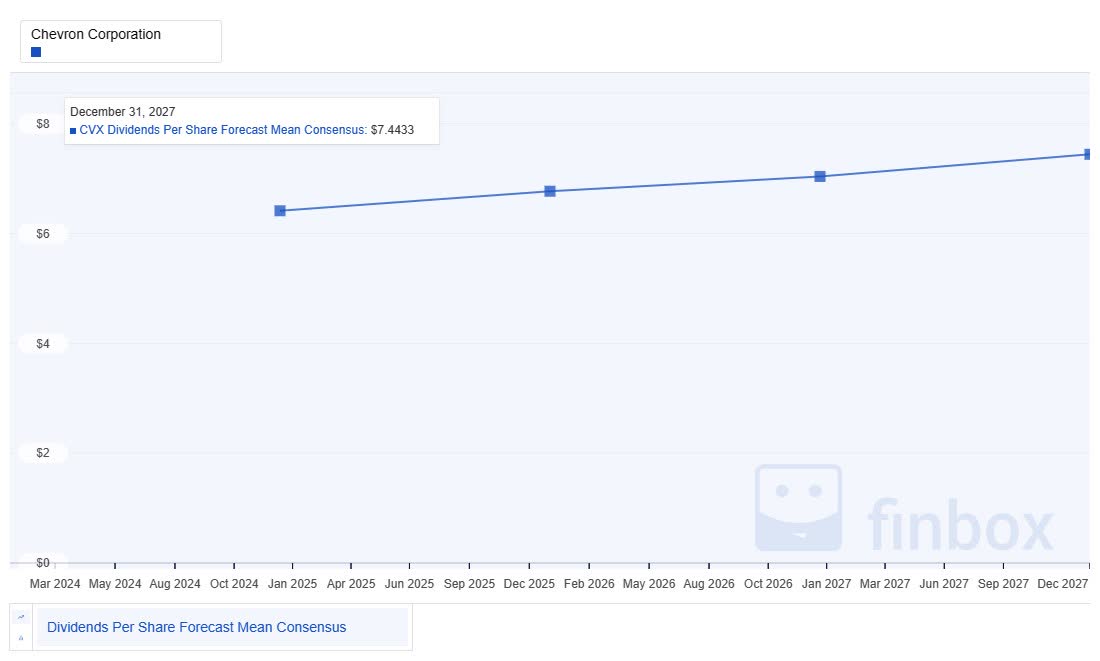
To add to the comfort of the predicted future increases in dividends is the projected payout ratios. With the low projected growth and EPS headwinds that are anticipated, it is no surprise to see that the payout ratios are forecast to increase. This is something we will need to keep an eye on. It is also something that makes me wonder if the projections aren't a bit pessimistic right now, given some of the current challenges.
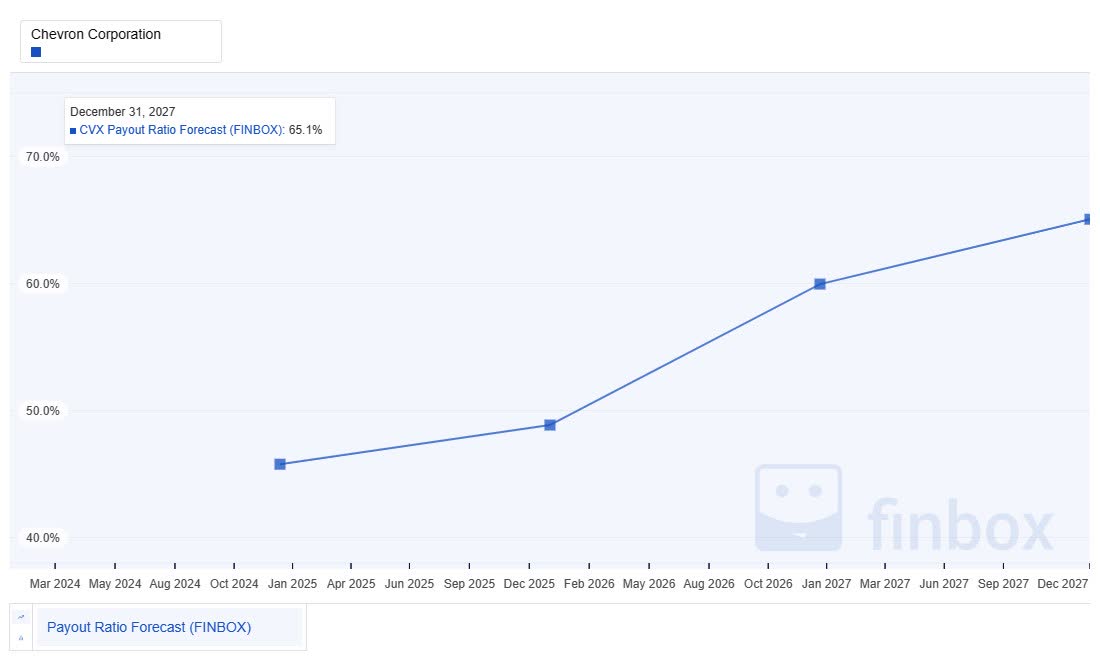
Just to be explicit, the increase in earnings-based payout ratio aligns with a decline in revenue that is forecast. If true, that is a significant decline, and suggests that the current valuation is likely not attractive.
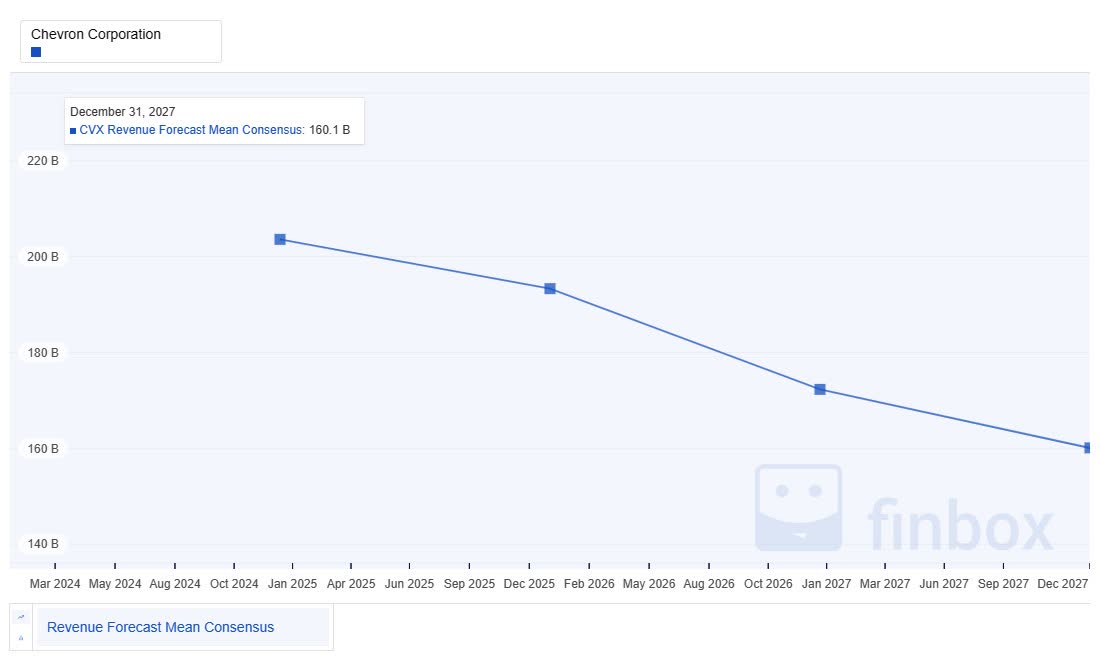
To balance that perspective though, CVX believes strongly in their ability to continue to generate growing, and attractive free cash flow, even at relatively conservative oil prices. They are projecting at least 10% average free cash flow growth.
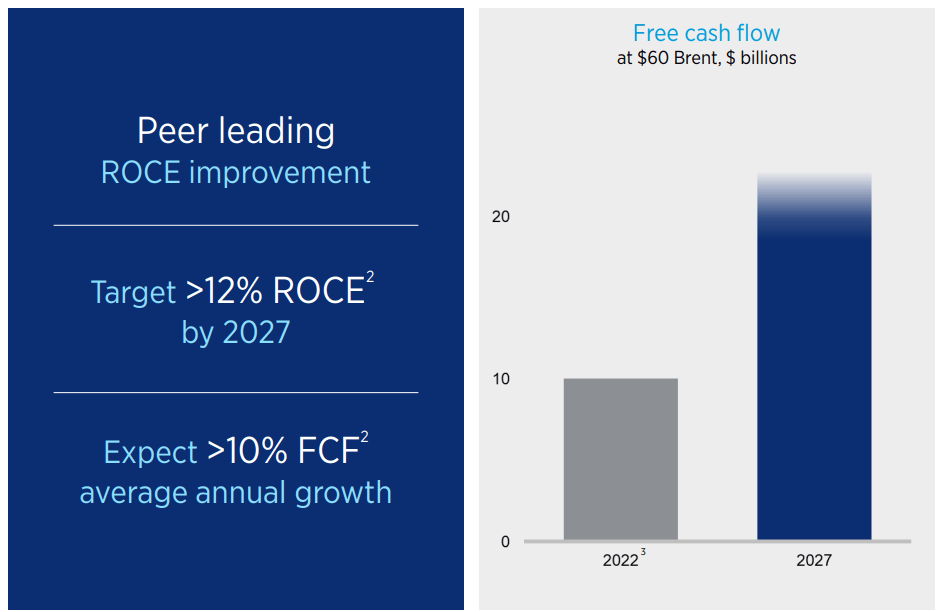
Chevron Risk
CVX is a high-quality company that is one of the best in class in a very cyclical industry. The S&P credit rating of AA-, Moody's credit rating of Aa2, and A Value Line Financial Strength rating all attest to the quality of this company.
However, the risks are considerable - with a few that worry me listed below.
First, CVX operates in a challenging industry that is very sensitive to the price of oil. With the growth of low-cost production coming out of the shale regions, this helps increase the buffer of pricing impacts, and also provides margin, however this is still something to consider. The weakness in profit and cashflow during the recent spell of low prices definitely shows the business sensitivity.
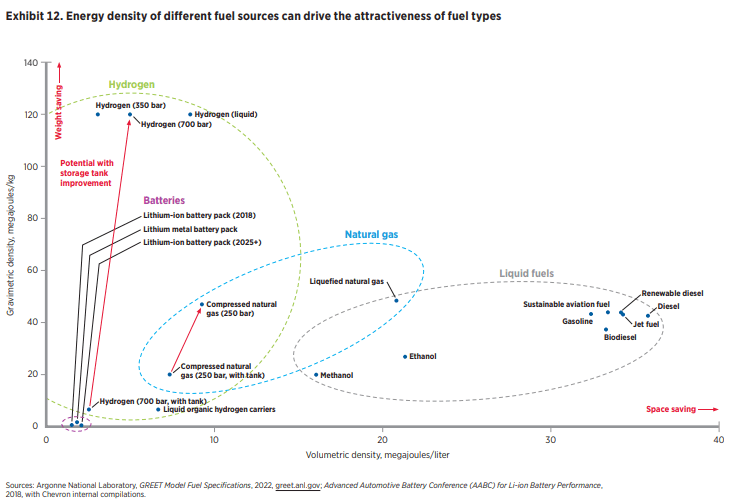
Second, CVX may be challenged by the energy transition. Now, the company is investing heavily in carbon capture technologies, as well as biofuels, while also reducing the carbon intensity of current production through methane controls. There is also the argument for the need for oil-based energy to keep up with world-wide energy demand growth. I personally believe this argument and think that CVX is on the right path to profitably invest in various carbon reduction technologies, close to their core business. One more potential future energy transition business idea I like is producing lithium as a potential byproduct of other operations. Their recent 2023 Climate Change Resilience Report does a nice job laying out a balanced, but obviously, CVX centric view of the future. Just a couple charts that I like from the report that lay out the challenges in meeting future energy demands from a global perspective, as well as from a physics perspective. Hydrocarbons are hard to replace, so I like that CVX is more pragmatic in using them in a more sustainable way.
Third, CVX has real business and geopolitical risks. Reference the recent write-downs ($3.5-$4B) that they had to take due to the regulatory environment in California, and being accountable for abandonment and decommissioning of assets in the Gulf of Mexico when the company they sold those assets to declared bankruptcy. Also, it will be interesting to see how the conflict in Guyana impacts the expected acquisition of Hess. These are examples of the types of risks that make investing in a company like CVX in an industry that is not exactly in favor, worrisome, which is again, why I like seeing the view of the future that management has laid out, which strikes a nice balance between the realities of future environmental concerns, business risks, and future energy needs.
Moving away from the scary risks, I also like further confirmation of what we've already established as far as dividend growth and sustainability are concerned, and Seeking Alpha's Dividend Grades support solid dividend safety. I do think it's funny in the current investment environment that a yield of 4% only gets you a C-, but again, that is relative to its sector peers, which I believe do not bring the same level of quality.
Seeking Alpha
As a final check of risk, I like to look at short-term risk indicators for any new investments, with Short Interest being one key indicator for me that I might be missing something that others might know.
Seeking Alpha
Based on the low short interest, I don't see any short-term red flags that haven't been discussed.
Summary
I am going to do something that I hate to do in my articles and suggest a hold. I believe, based on the uncertainty with the Hess acquisition, the recent write-downs, and with the unfavorable future revenue and growth projections that I want to wait until CVX is closer to the true 52-week lows. I don't plan to reconsider until CVX falls to at least $144, which isn't that far, but may wait for the next earnings refresh to get some more color on the current risks before adding more. $144 is where my margin of safety against my valuations starts to look attractive and is also around the floor for the most recent lows. I already have a significant holding in CVX, which I do not plan to sell, so a hold recommendation seems prudent.
Having said that, I went back and forth between the strong side of hold and the weak side of buy. CVX is rated as a buy by my fellow SA Analysts, as well as by the broader Wall Street contingent. Long-term, and given the dividend yield, I feel confident this is a good investment.
Seeking Alpha
As part of this analysis, I also highlighted PFE, BMY, and RMD as being attractively valued from a Historical and Future Fair Value perspective, and worthy of further investigation. Please see the Fair Valuation Estimation section for links to recent articles on PFE and BMY that I believe are still representative.
For further details see:
High-Quality Dividend Growth Near 52-Week Lows: Chevron Is Shaping Up