VTI - Hints Of A Major Economic Slowdown In Personal Consumption Expenditure (PCE) Data
2023-09-29 11:45:16 ET
Summary
- Monthly estimates of Personal Consumption Expenditures are important indicators of economic activity in the US.
- PCE data indicate that there was a major slowdown in overall U.S. consumer spending in August.
- The slowdown in U.S. consumer spending was particularly notable in the most economically sensitive sectors of the economy.
Monthly estimates of Personal Consumption Expenditures ((PCE)) contained in the report on Personal Income and Outlays , published by the Bureau of Economic Analysis ((BEA)) constitute some of the most important high frequency indicators of economic activity in the U.S. The most recently published PCE data, corresponding to the month of August 2023, were published by the BEA at 8:30AM, September 29, 2023. In this article, we will walk our readers through an in-depth analysis of the most recently published PCE data, and then discuss their implications for the U.S. economy and financial asset prices.
Summary Data and Analysis
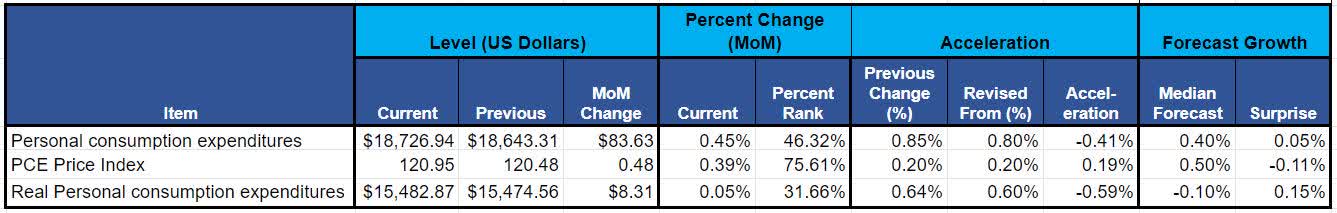
We begin our examination of the BEAs report on PCE in the month of August 2023, with summary data and analysis which we highlight in Figure 1. We recommend that readers pay particular attention to the percent rank of Month-on-Month (MoM) growth, MoM acceleration, and the surprises relative to forecasts.
Figure 1: Change, Acceleration, Expectations, and Surprise
PCE Summary (Bureau of Economic Analysis & Investor Acumen)
There was a very major deceleration in nominal and especially real (inflation-adjusted) consumption expenditures. However, since the median forecast was expecting an even greater deceleration, the PCE data actually represented a modest upside surprise. Looking a bit deeper, most of this upside surprise is attributable to the fact that the median forecast was expecting the PCE Price Index ((PCEPI)) to reflect inflation of 0.5% compared to the actual figure of 0.4%. In other words, the modest positive surprise in real expenditure was primarily due to the PCE inflation surprise rather than nominal expenditure surprise.
The Impact of Inflation on the Purchasing Power of Personal Consumption Expenditures
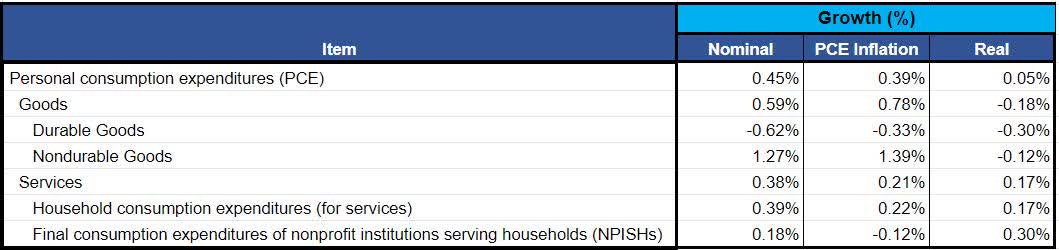
In this section, we highlight the impact of inflation on this month's PCE data. Inflation affects the purchasing power of any given dollar amount of money that is spent by consumers. In other words, inflation affects the quantity of goods and/or services that a given amount of money can buy. In Figure 2, we show PCE in both "current dollars" and in "real" terms. The "real" figures adjust the nominal current dollar figures for the changes in purchasing power caused by inflation/(deflation). The purchasing power adjustments to the PCE consumer spending data are made by applying the appropriate PCE price indexes ((PCEPI)), that are published on the same day as the report on Personal Income and Outlays.
Figure 2: PCE in Current Dollars and Adjusted for Inflation
Impact of Inflation on PCE (Bureau of Economic Analysis & Investor Acumen)
As can be seen above, the MoM real growth in spending for goods was actually negative, particularly in the most economically sensitive sectors such as in Durable Goods category. Durable goods prices experienced some deflation in August, reinforcing the impression of economic weakness in this economically sensitive sector.
For the remainder of this article, all figures will be presented in "real" (inflation adjusted) terms.
Analysis of Annualized Growth of Major Components of Real PCE Over Various Time Periods
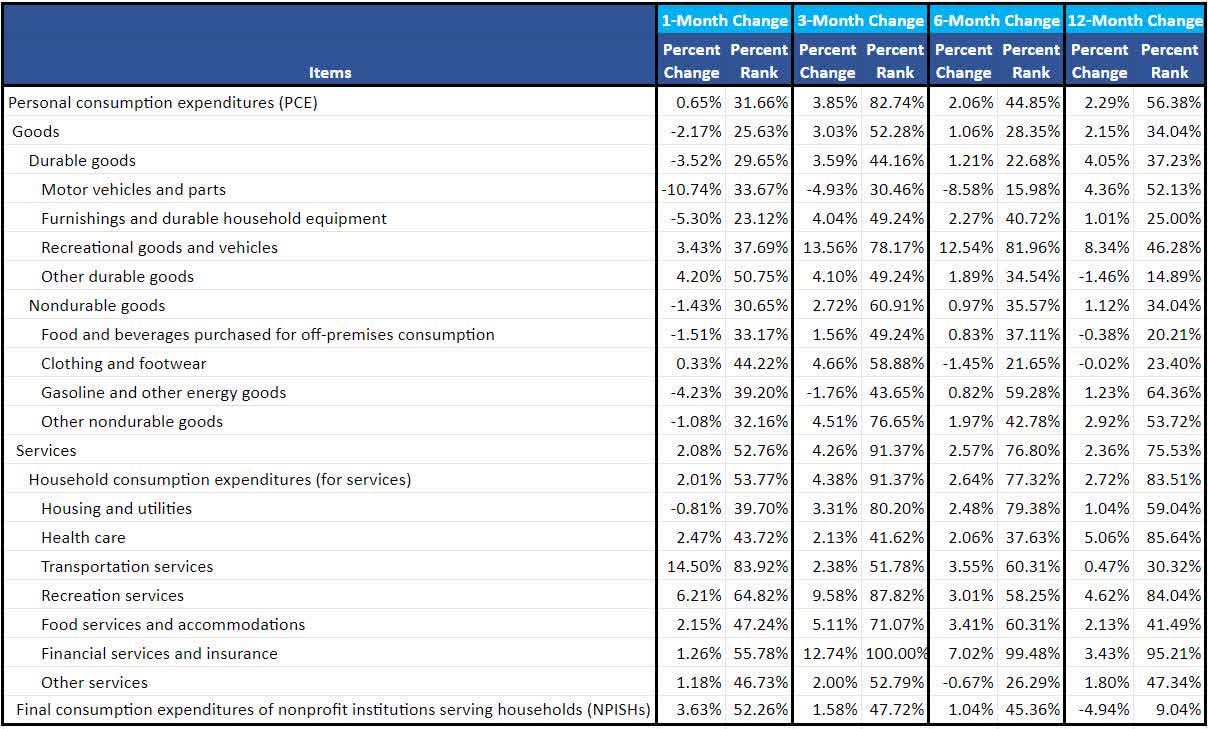
In this section we break down Real Personal Consumption Expenditures into major components, scrutinizing their annualized growth rates over various time frames (1m, 3m, 6m and 12m). The purpose of this analysis is two-fold. Our first purpose is to identify which components of PCE are growing at a faster or slower rate than the overall aggregates. Our second purpose is to determine whether, and to what extent, growth rates are accelerating or decelerating over various time frames.
Figure 3: Annualized Growth Rates of Major Components of Real PCE
Annualized Growth of PCE Components (Bureau of Economic Analysis & Investor Acumen)
As can be seen from this table, the divergence between growth in goods and services is quite notable. For example, while 1-month and 6-month growth in Services is registering at historically above-average rates, growth in goods is well below historical averages. Indeed, the growth in the more economically sensitive goods sector is similar to what has historically been seen in periods prior to past recessions.
Contributions to Change and Acceleration of Real PCE: Components Analysis
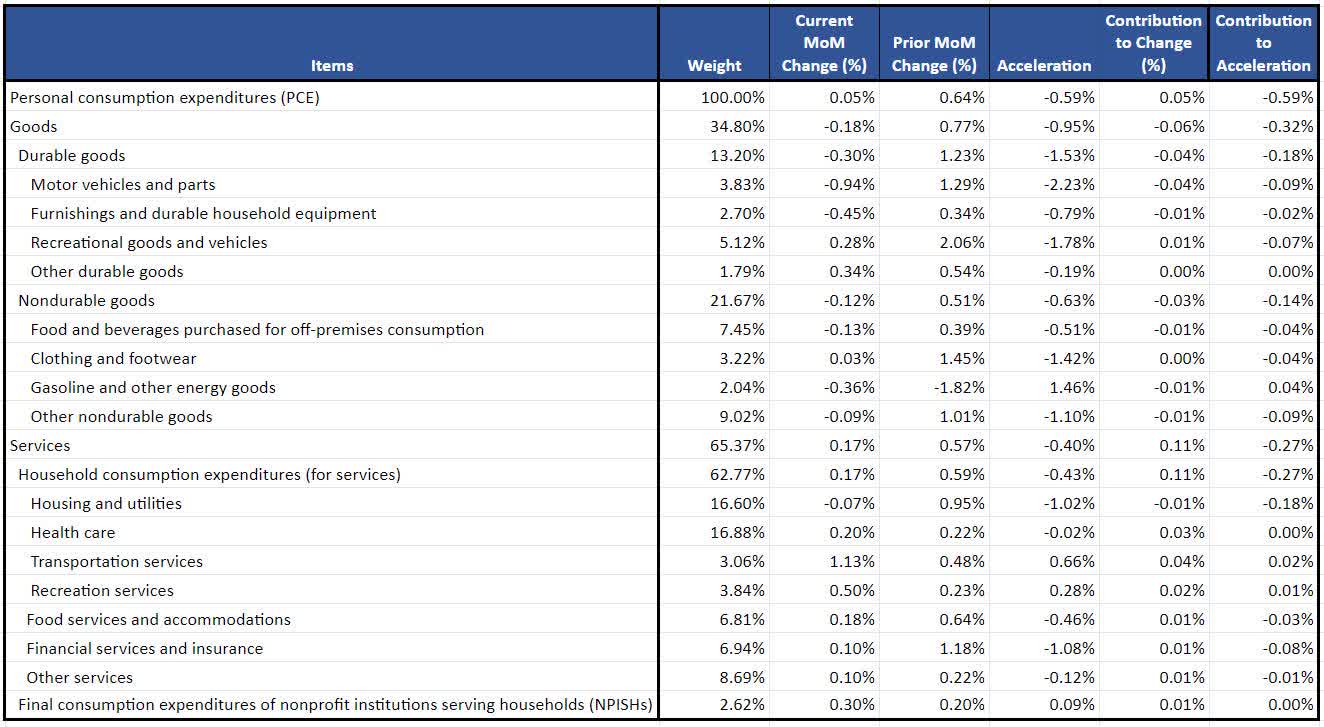
In this section our analysis is focused on the component contributions to the MoM Change and MoM Acceleration that are attributable to select major components of PCE.
Figure 4: Contributions to Change and Acceleration Attributable to Major Components
Contribution of Components to PCE (Bureau of Economic Analysis & Investor Acumen)
What we can see in the table above is that the deceleration in overall PCE is primarily attributable to the significant deceleration in the goods sector -- despite the fact that the goods sector has a much lower weighting in PCE than the services sector. This is important to note because the goods sector more "economically sensitive" than the services sector and it therefore tends to lead trends in economic slowdowns and recessions.
Implications for the US Economy
Personal Consumption Expenditures, including import content, accounts for slightly more than 70% of the BEA's estimate of total expenditures "for final consumption" in the U.S. If imported content (not included in calculation of GDP) is excluded, PCE account for roughly 62% of US GDP. If all expenditures on goods in services in the US are taken into account (including business-to-business spending in primary and intermediate stages of production) the share of PCE in total expenditures is slightly less than 30%. Whichever way one looks at it, PCE data provides important information about the major tendencies and trends in consumer spending and consumption in the US.
The PCE data for August indicates a major overall slowdown in consumer spending in the US economy. When excluding expenditure items that are non-cyclical, such as healthcare and other types of services that tend to be somewhat insensitive to overall economic changes that are impacting spending and production in other more sensitive areas of the economy, it can be seen that the slowdown in PCE is quite significant, with real spending growth in economically sensitive categories exhibiting growth that is similar to historical precedents in pre-recessionary periods.
In our view, the significant weakening in consumer spending is being somewhat masked in the overall PCE data by economically insensitive and lagging categories. Indeed, some of these insensitive categories are somewhat misleading because they don't represent spending by consumers at all. Such is the case with "imputed" expenditure items and other items that reflect expenditures "on behalf of" consumers (e.g., Medicare and Medicaid expenditures).
We believe that weakness in consumer spending will become an increasingly notable trend in coming months
Implications for Financial Markets
We do not think that most financial market participants have caught on to the incipient weakness in real (inflation-adjusted) consumer spending, particularly in the most economically sensitive parts of the U.S. economy.
In the short-run, evidence of an economic slowdown may be taken as "good news," since many market participants will believe that this will take pressure off of the Fed to continue their hawkish policies and rhetoric. However, we believe that on a multi-month time view, as the extent of the slowdown in consumer spending becomes more serious and more clearly understood, this will likely exert downward pressure on bond yields and downward pressure on the prices of common stocks, particularly in economically sensitive sectors.
In the short-term, markets will probably enjoy a bit of a respite from this relatively weak PCE data. But readers should be on the lookout for economic data that indicate deepening of the currently incipient economic slowdown. If and when this occurs, the current complacent attitudes of "bad news is good news," will tend to shift towards more fearful sentiments of "bad news is bad news."
Concluding Thoughts
The data on Personal Consumption Expenditures provide some of the most (if not the most) significant indicators of economic activity in the US, available at a monthly frequency. The most astute investors are able to capitalize on sound analysis of macroeconomic indicators such as PCE to boost performance and minimize risk in their investment portfolios. How? First of all, the cyclical (and sometimes even major sub-cyclical) movements in the macroeconomy tend to be major causal drivers of movements in financial asset prices (bonds and equities). Second, assets associated with particular industries or "factors" tend to outperform during specific phases and stages of the U.S. business cycle.
As a general matter, we think that recent evidence of an overall economic slowdown, which has been strengthened by this PCE report, requires investors to conduct an in-depth review their portfolio strategy and allocations.
For further details see:
Hints Of A Major Economic Slowdown In Personal Consumption Expenditure (PCE) Data