HNDL - HNDL: Reiterating Avoid Recommendation
2023-07-28 12:25:34 ET
Summary
- The HNDL ETF splits its portfolio between low-cost fixed income and broad equity ETFs and a 'Dorsey Wright Explore Portfolio'.
- Despite a complex strategy, the HNDL ETF has significantly underperformed compared to the Vanguard Balanced Index Fund since its inception.
- Investors are advised to look beyond the headline 7% of NAV distribution and consider total returns when analyzing funds like HNDL.
In November, I wrote a cautious article on the Strategy Shares Nasdaq 7 HANDL Index ETF (HNDL), suggesting the HNDL ETF was overly complex and investors were paying a very high fee (~2%) for the differentiated 'Dorsey Wright Explore Portfolio' that did not appear to add any value. It has been almost nine months since my article, so let us review the HNDL ETF's recent performance to see if our initial assessment was accurate.
Brief Fund Overview
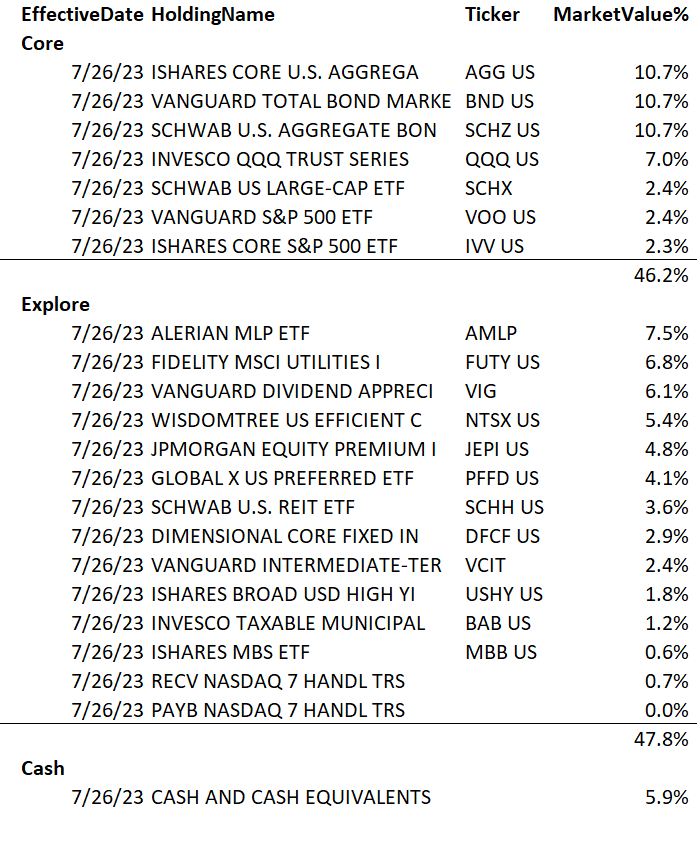
First, a review of the HNDL ETF strategy, for those not familiar. The HNDL ETF is split 50/50 between a 'core portfolio' of low-cost fixed income and broad equity ETFs in a 70/30 allocation, and a 'Dorsey Wright Explore Portfolio' that tactically allocates to a variety of high yielding asset classes using a rules-based momentum strategy.
The main selling feature of the HNDL ETF is a managed distribution yield that aims to pay a monthly distribution equal to an annualized 7% of NAV.
As of July 26th, the fund's allocation between the 'core' and the 'explore' portfolio is shown in Figure 1.
Figure 1 - HNDL portfolio holdings (Author created with data from HNDL holdings)
The HNDL ETF employs leverage of ~30% to enhance returns.
Inline Returns In The Past Few Months, But Lagging Since Inception
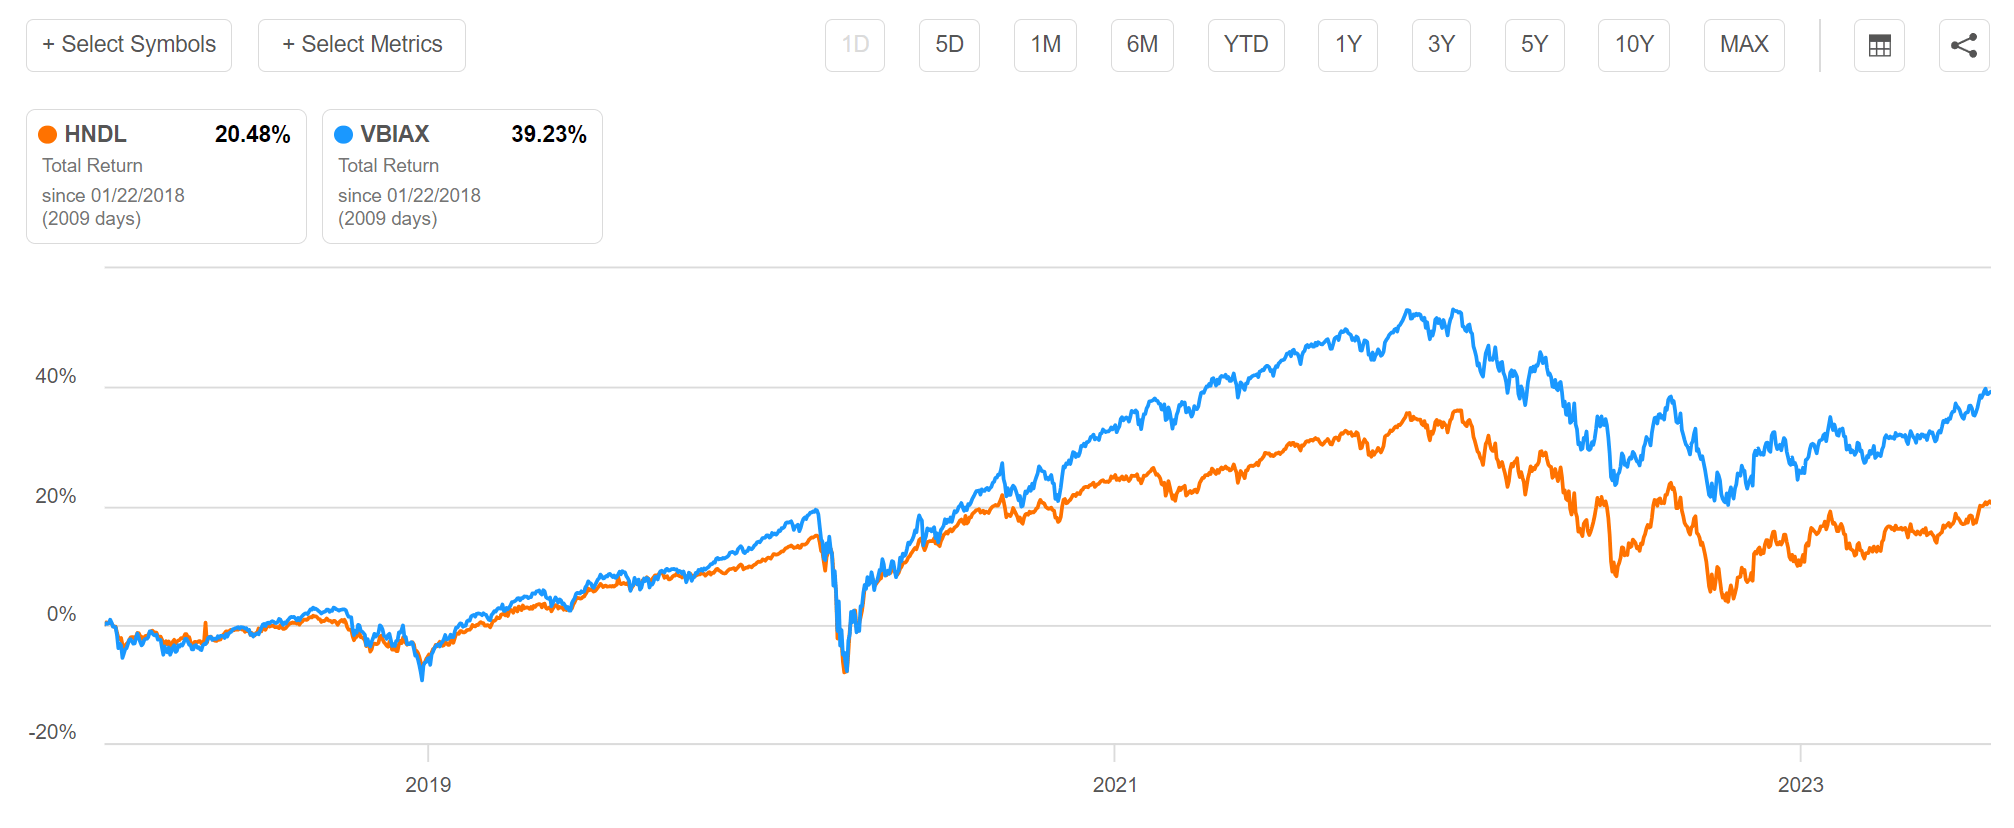
One of my main criticism of the HNDL ETF was that despite its complicated strategy and high fees, it has significantly underperformed a simple balanced fund like the Vanguard Balanced Index Fund (VBIAX) since inception, with a total return of 20.5% compared to 39.2% for the VBIAX (Figure 2).
Figure 2 - HNDL vs. VBIAX since inception (Seeking Alpha)
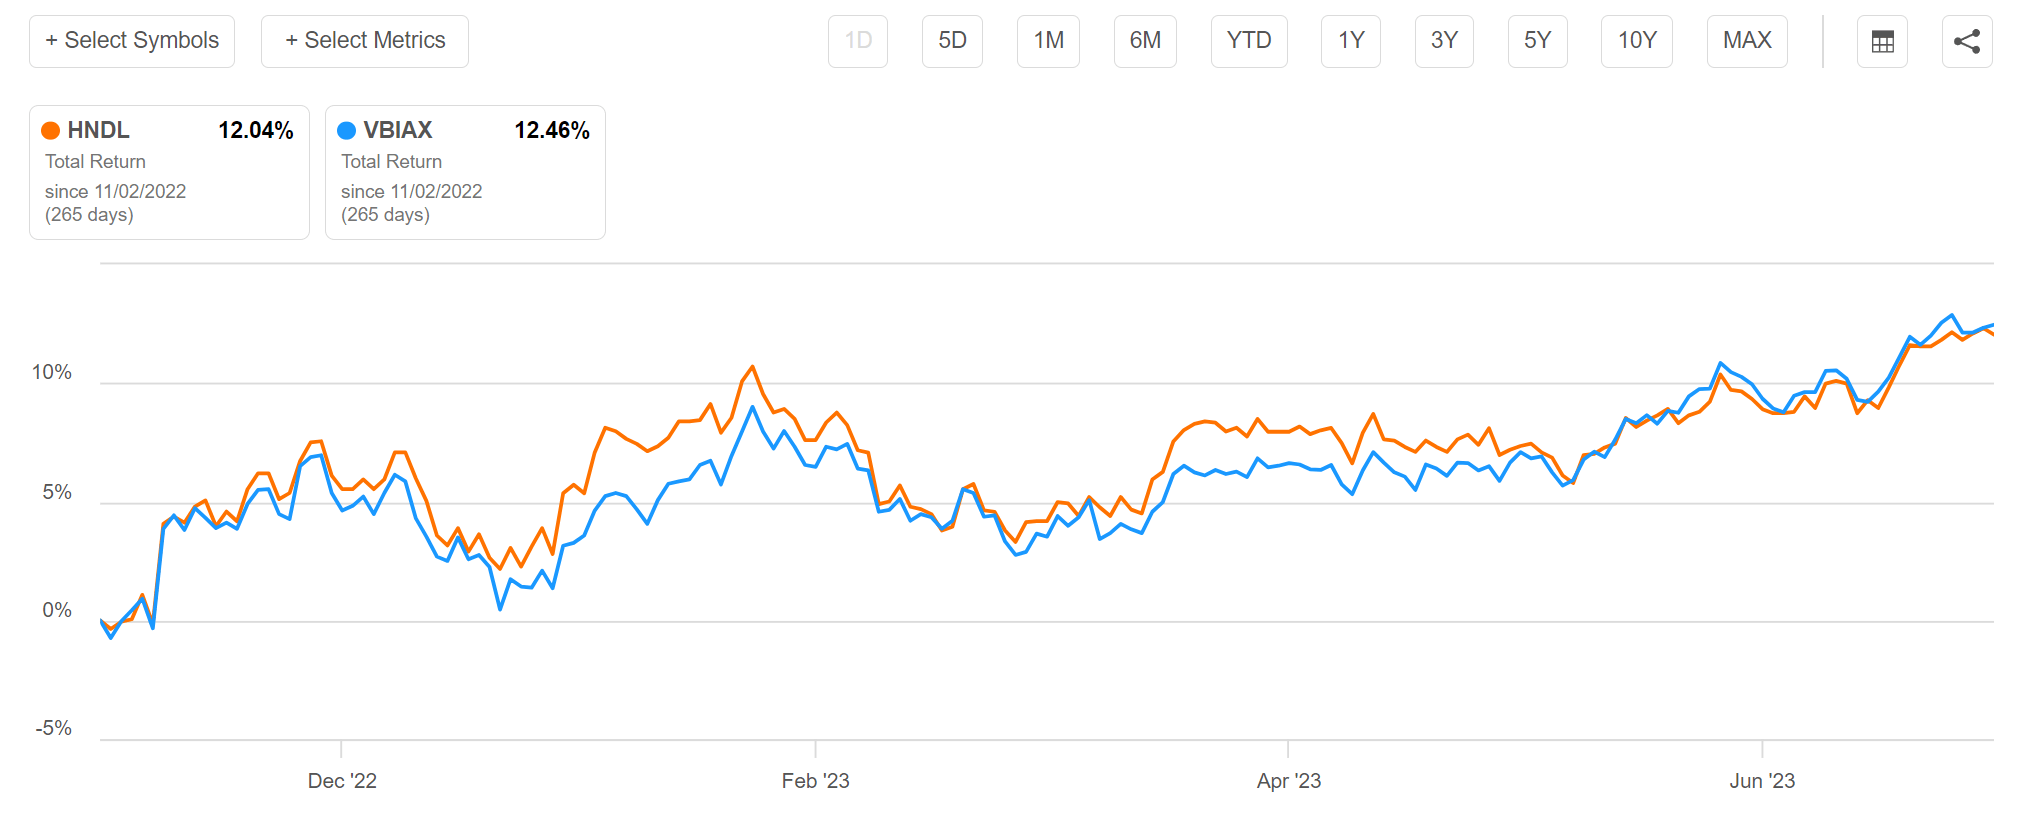
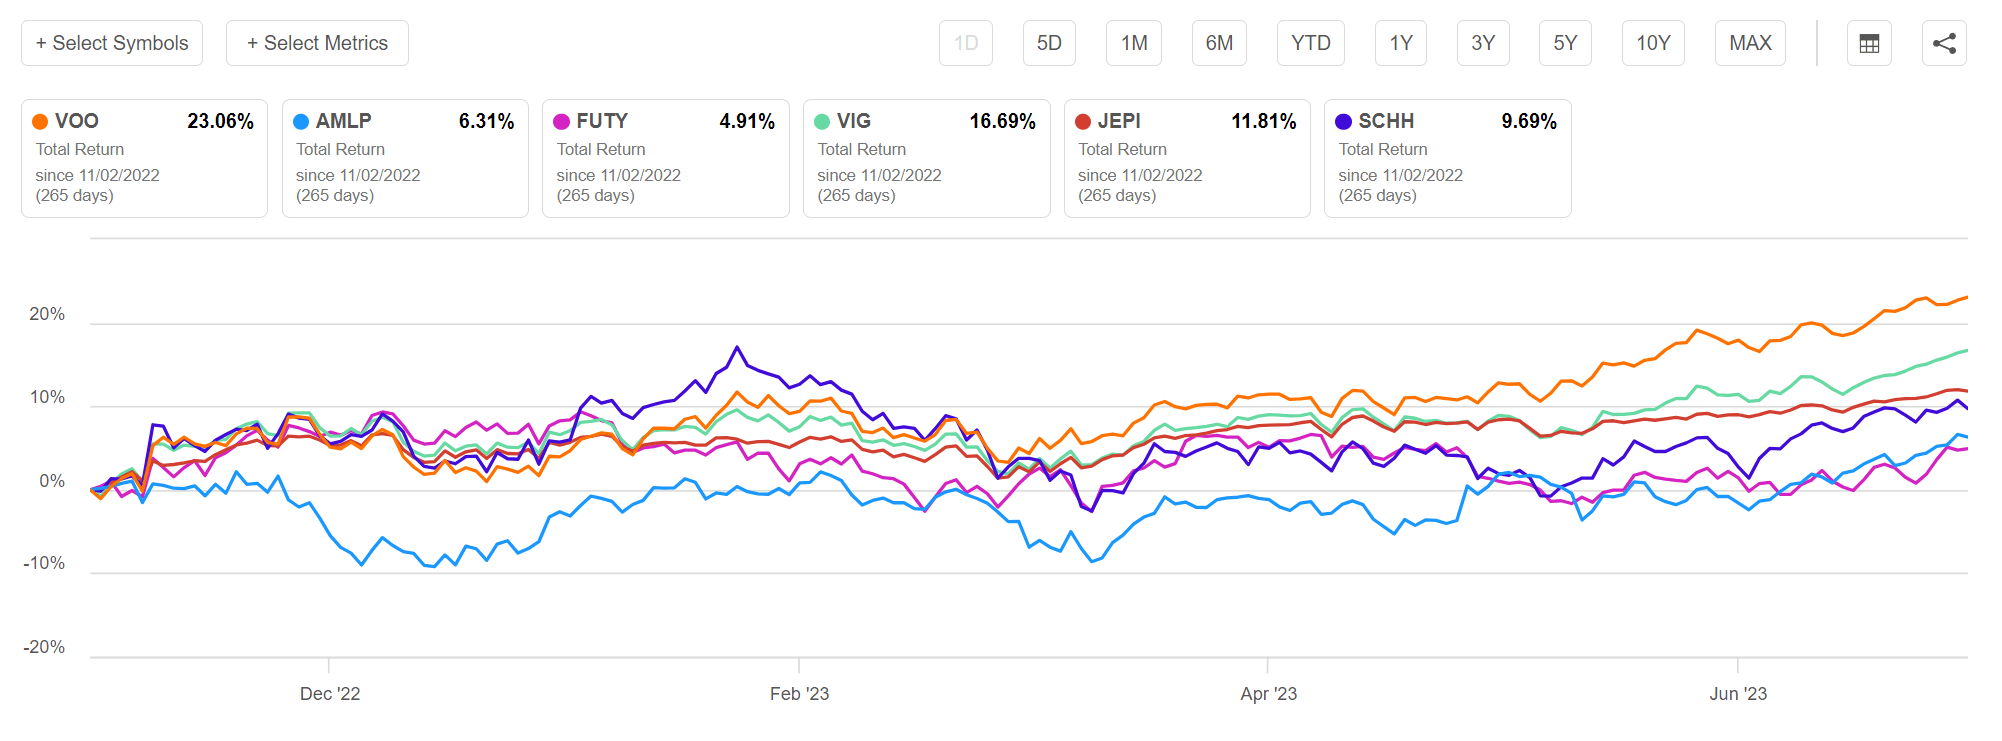
However, in the shorter-term time frame since the publishing of my article in early November, the HNDL ETF has only underperformed VBIAX by 0.4% (Figure 3).
Figure 3 - HNDL vs. VBIAX since November 2022 (Seeking Alpha)
Has the HNDL ETF's performance turned a corner and better days are ahead?
Looking underneath the hood at HNDL's tactical allocation portfolio, I believe the answer is 'probably not'.
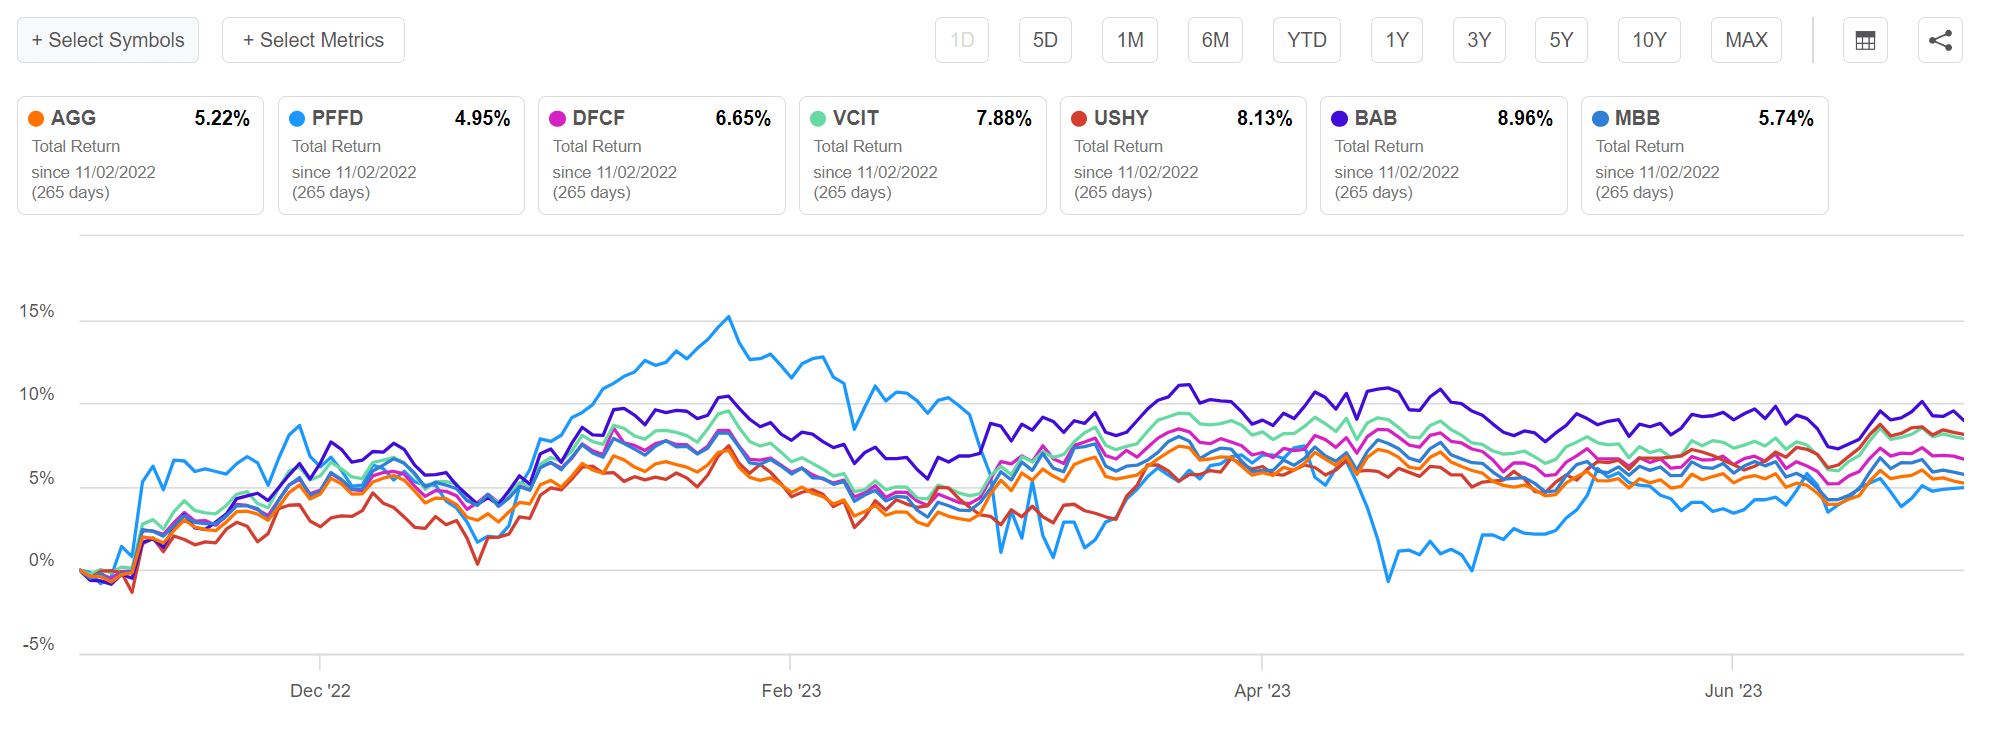
Comparing the HNDL's tactical fixed income investments, we can see that indeed, the HNDL ETF have made some good trades, with almost all of the individual fixed income securities outperforming core bond returns since November, as modeled by the iShares Core U.S. Aggregate Bond ETF ( AGG ) (Figure 4).
Figure 4 - Tactical fixed income vs. AGG (Seeking Alpha)
However, at the same time, almost all of the tactical equity holdings have dramatically lagged core equities, as modeled by the Vanguard S&P 500 ETF ( VOO ) (Figure 5).
Figure 5 - Tactical equity holdings vs. VOO (Seeking Alpha)
Furthermore, while the bond securities have outperformed since November, that does not necessarily mean they have been held by the HNDL ETF since that time, as the HNDL ETF tactically trades around the 'Explore' portfolio. For example, the HNDL ETF did not hold the Dimensional Core Fixed Income ETF ( DFCF ) in November when I last reviewed the fund.
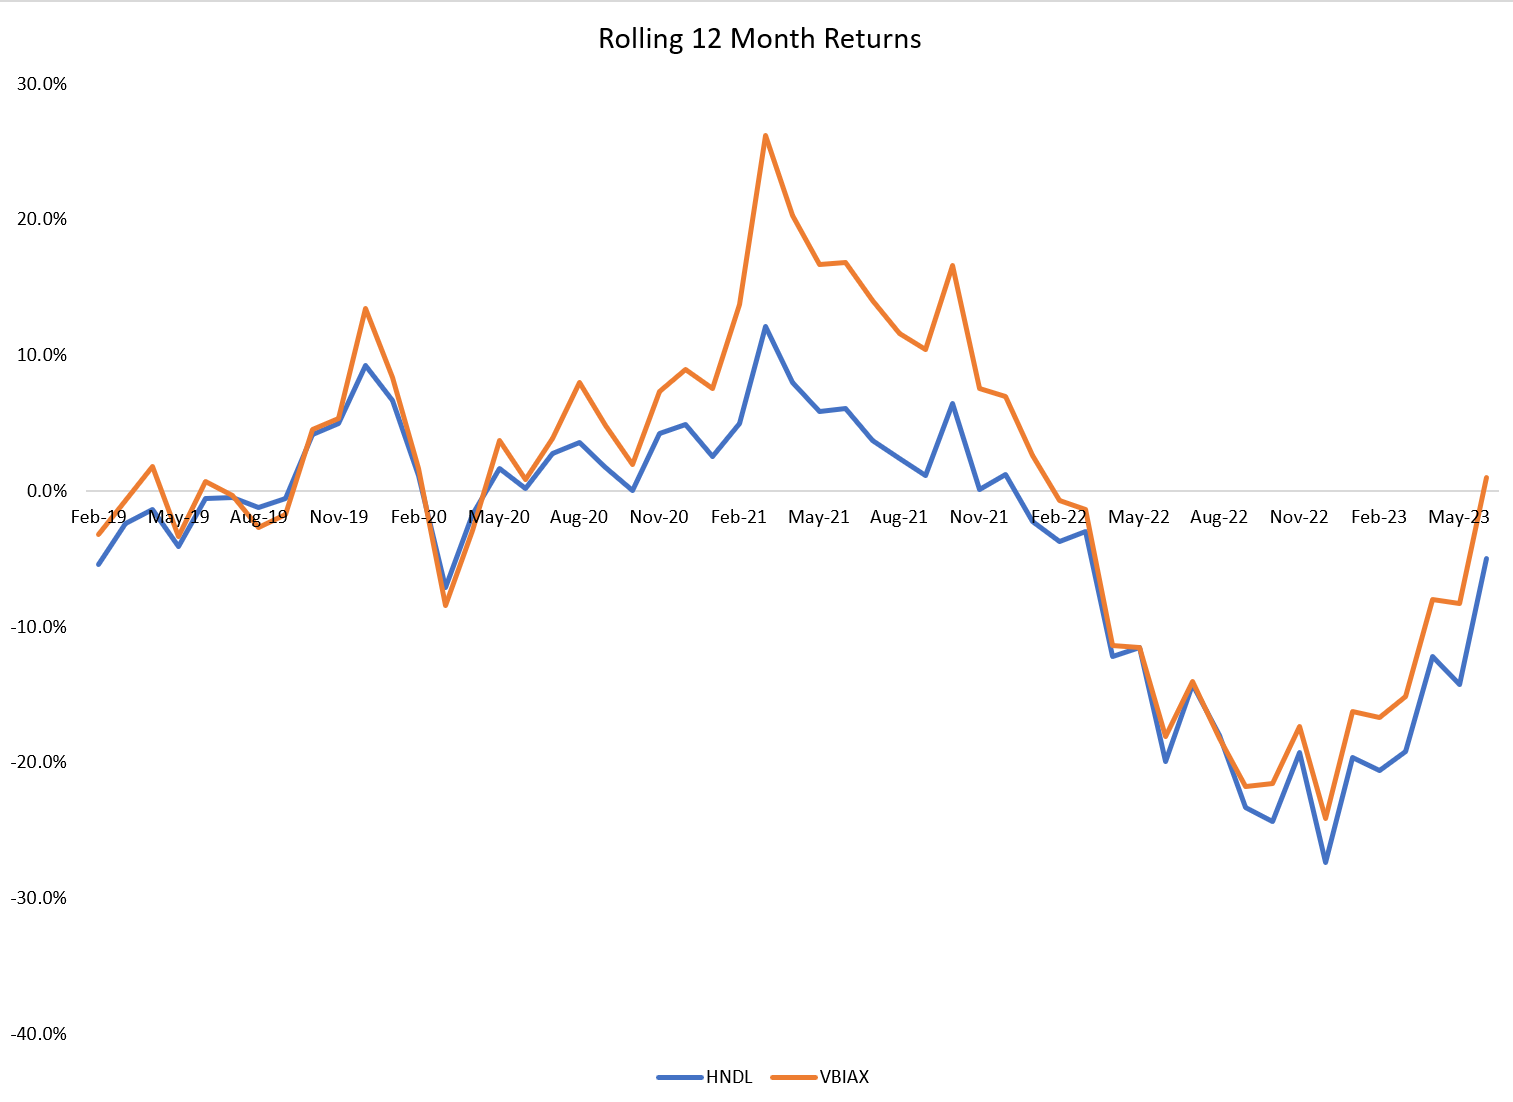
Another interesting observation is that even though risk markets have essentially gone up in a straight line since November, the best that HNDL could do is to underperform the VBIAX by 40 bps in that time frame. In fact, if we analyze rolling 12 month returns of the HNDL ETF vs. the VBIAX fund, we can see that there are virtually no time periods where the HNDL ETF has outperformed the VBIAX fund (Figure 6).
Figure 6 - HNDL vs. VBIAX rolling 12 month returns (Author created with data from Portfolio Visualizer)
So from historical observations, the best that HNDL can muster is 'match' the returns of a low-cost balanced fund, while periodically, the HNDL ETF suffers significant underperformance leading to a large performance gap since inception.
Distribution Yield Vs. Total Returns
In my prior article, one reader commented that they preferred the HNDL ETF because it paid a 7% yield vs. VBIAX's 2.6%, and 'pre-retirees and retirees don't have the same goal assumed by the author'.
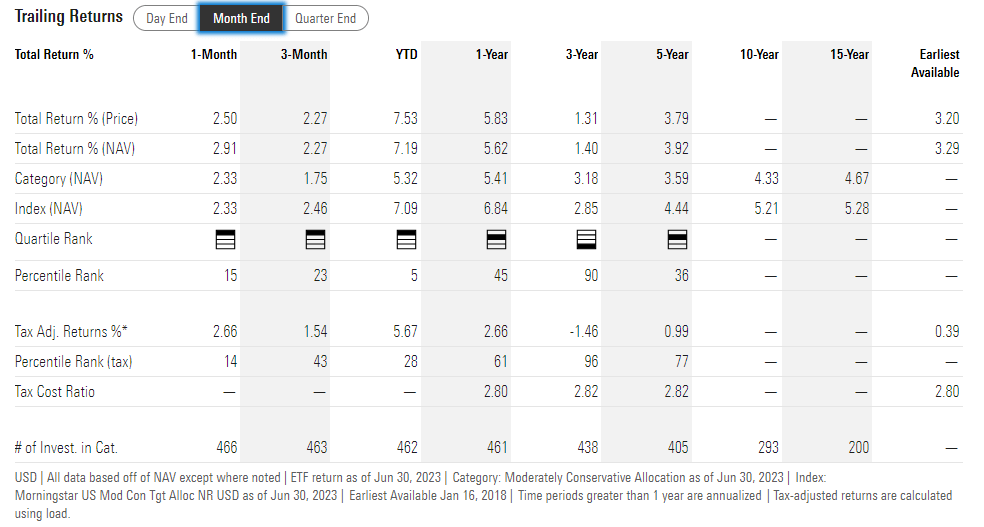
While it is true that different investors may have different investment horizons and goals, it is absolutely misguided to only compare the distribution yield of the HNDL ETF against the VBIAX and conclude HNDL is superior. Simply put, if the HNDL ETF only generates 5Yr average annual returns of 3.9% to June 30, 2023, then HNDL is not 'earning' its distribution, when viewed from a 'return of principal' lens (Figure 7).
Figure 7 - HNDL historical returns (morningstar.com)
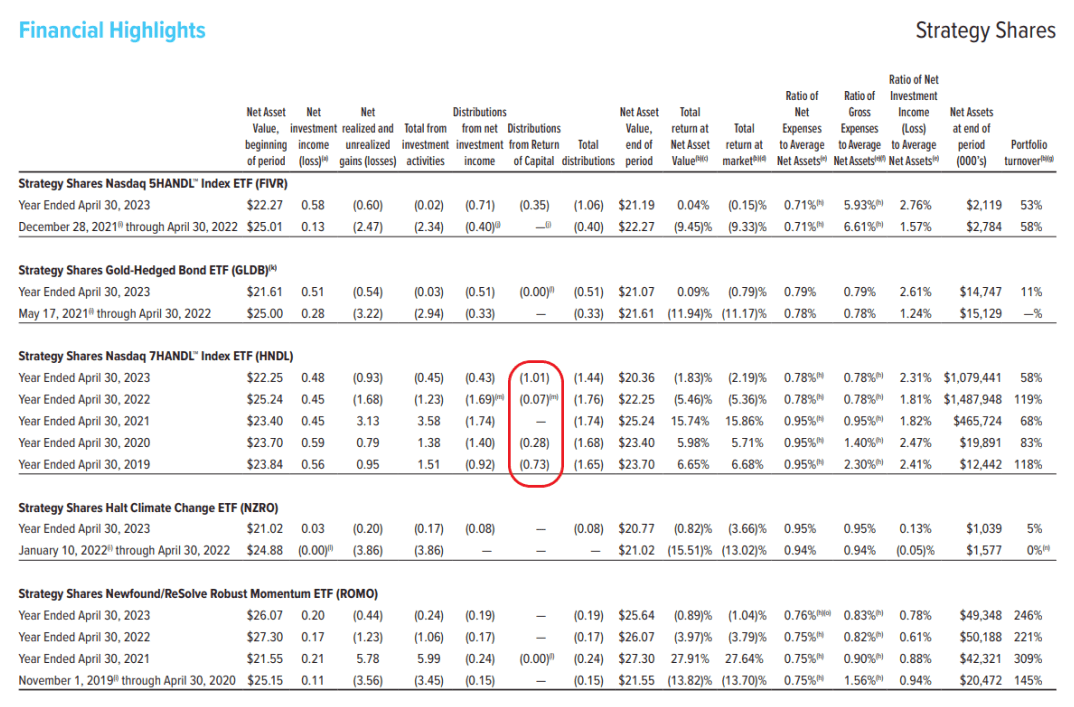
For example, going through HNDL's annual report, we can see that the HNDL ETF has been heavily utilizing NAV amortizing return of capital ("ROC") to fund its 7% of NAV distribution (Figure 8). HNDL investors are simply paid back their own capital.
Figure 8 - HNDL heavily relied on ROC to fund distribution (HNDL annual report)
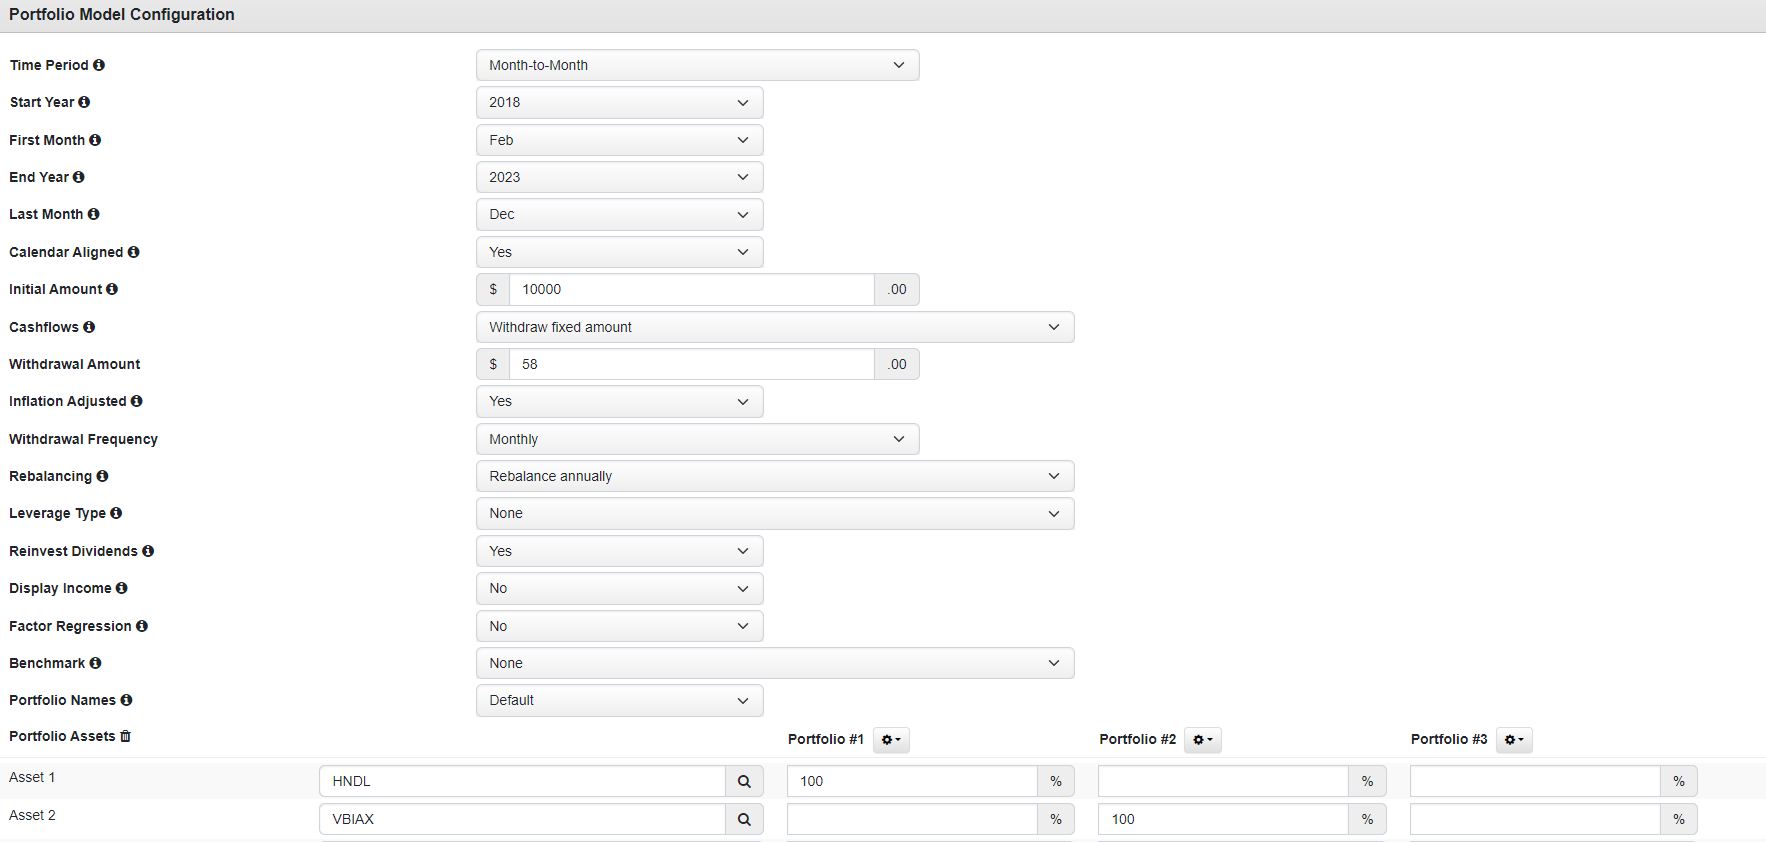
Another way to think about the question of total return vs. distribution yield is to consider two portfolios, one 100% invested in HNDL ETF and reinvesting all distributions but withdrawing a fixed $58 per month (roughly 7% of initial $10,000 capital). Portfolio 2 invests 100% in VBIAX, reinvesting all distributions, and withdrawing a fixed $58 per month as well (Figure 9).
Figure 9 - HNDL vs. VBIAX portfolio setup (Author created with portfolio visualizer)
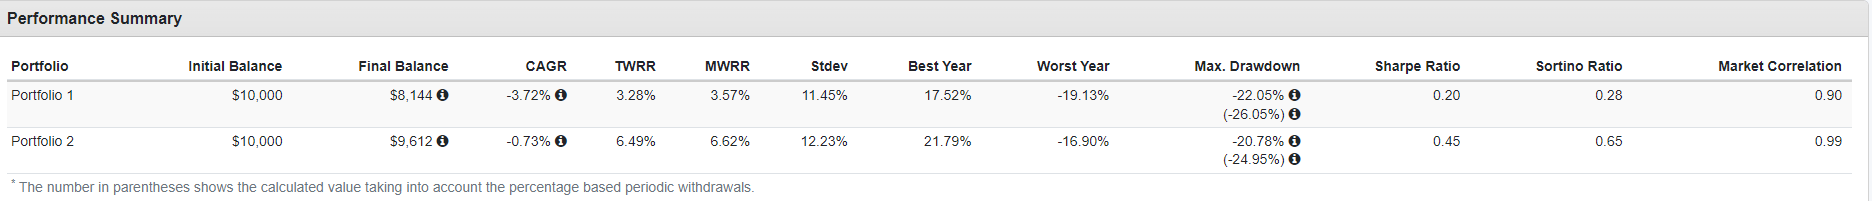
This leads to the returns profile in Figure 10. Comparing the two portfolios, we can see clearly that with the same 'portfolio withdrawal rate' , the VBIAX portfolio vastly outperforms the HNDL ETF. This is because VBIAX has generated higher 'total returns' , which allows it to more sustainably pay the monthly distribution.
Figure 10 - HNDL significantly lags the VBIAX (Author created with portfolio visualizer)
This analysis negates what I think is the misguided argument that the HNDL is preferable because it has a higher distribution yield. A higher returning asset can always be structured to pay out a higher 'distribution', so investors should look beyond the upfront yield.
Conclusion
Upon further examination of HNDL's historical performance, I continue to argue investors should avoid this expensive and underperforming fund. Simply put, the best the HNDL ETF can do historically is match a balanced fund like the VBIAX on a rolling 12 month basis. However, on average, the HNDL ETF underperforms, which leads to long-term underperformance.
While some investors may be attracted to HNDL's 7% of NAV distribution yield, they need to realize the distribution is funded partly from their own capital.
For further details see:
HNDL: Reiterating Avoid Recommendation