HEP - Holly Energy Partners: Excellent Prospects Driven By High Economic Leverage On Capital Deployed
2023-09-22 17:21:23 ET
Summary
- Holly Energy Partners enjoys consumer advantages and cost differentiation benefits given its industry positioning.
- HEP's latest financial results continued its high post-tax margins and confirmed its ability to compound capital.
- Investors should be aware of the risks associated with HEP, including its exposure to macroeconomic and commodity cycles, the inflation/rates axis, and relative valuation compared to peers.
- Net-net, rate buy.
Investment briefing
Those names offering storage and transportation services to the oil and gas industry are potentially differentiated from drillers and suppliers. The fact is they offer different products/services than the underlying resource, meaning there is scope to enjoy consumer and/or cost leadership advantages. This is unlike producers, suppliers and so forth, who all sell the same product and can't differentiate on cost or consumer.
I scrutinized Holly Energy Partners, L.P. ( HEP ) with these points in mind, and found this to be true. The company enjoys high post-tax margins, suggesting it also enjoys consumer advantages and cost differentiation benefits. In an inflationary world, this is critical, as the cost to store and transport essential resources is embedded into the value chain.
This report will unpack the HEP investment debate from the perspective of its ability to compound capital. My strategy is simple. I treat companies as investors. Then, I compare the rates of return produced on their capital allocations to what we could reasonably expect/have produced by investing at long-term market returns. HEP exhibits these economic qualities and this report will unpack the ways how. Net-net, I rate HEP a buy.
Figure 1.
Risks to investment thesis
Investors should understand these risks before moving further:
- The company is in a cyclical industry that is susceptible to macroeconomic and commodity cycles. This could impact earnings growth and capital requirements going forward.
- The inflation/rates axis has a heavy influence on asset replacement costs, financing decisions and ability to obtain capital. This could hinder HEP's ability to grow.
- The company is selling at a premium to respective peers and this relative valuation may play into sector positioning by larger-scale investors.
Investors must realize these risks in full before proceeding to any investment decisions.
Critical investment facts forming buy thesis
1. Insights from latest numbers (Q2 FY'23)
HEP booked r evenues of $140mm for Q2 , up 34.78% YoY. Revenues for the YTD tallied $283mm, so the split was pretty even from Q1–Q2. It clipped OpEx of $427mm, down 9% YoY, due to lower natural gas costs, and pulled this to pre-tax income of $82mm and earnings of $0.40/share.
BIG Insights
As to the operational highlights, results were fairly mixed in HEP's core competencies, but net positive in my view. To name a few:
- In terms of sales volumes, HEP recorded a total of 50mm gallons for Q2, a significant increase of 92.31% compared to 26mm gallons recorded last year. However, utilization rates were impacted due to hydrogen plant turnarounds at Navajo and Parco, which co-located with 2 of HEP's renewable diesel plants. Crude oil charges averaged 54,000 barrels/day, declining 91% YoY due to maintenance activities (last year, the avg. charge was 627,000 barrels/day).
- On the other hand, HEP's renewables segment clipped core EBITDA of $23mm, up from negative $63mm clipped in Q2 '22. Adding the cost of market inventory values, pre-tax earnings were negative $11mm vs. $28mm this time last year.
- In its marketing division, pre-tax earnings came to $25mm, down ~4.2% YoY. I'd point out the total amount of branded fuel sold hit a new quarterly record of 364mm gallons on a gross margin $0.09 per gallon, stretching up from 335mm gallons YoY.
- The lubricants + specialty products line did $72mm pre-tax and decreased ~54% YoY. The downside stemmed from a lower FIFO benefit in how HEP booked its new inventories, moving to lower-priced feedstock inventory during the quarter. To illustrate, the benefit was $0.5mm in Q2 FY'23, compared to a $71mm benefit in Q2 last year.
- Management r evised its CapEx guidance for FY'23, eyeing a new range of $900mm-$1.06B vs. $940mm-$1.15B previously. This represents a decrease of 8.70%-7.83% YoY. The refining segment's expected spending now stands at $250mm-$270mm, reflecting a decrease of 6.90%-2.88% YoY. For Q3 '23, it plans to run between 585,000-615,000 barrels per day of crude oil in its refining segment. Castberg and Tulsa refineries are scheduled for planned turnarounds during this period as well.
HEP also paid its quarterly dividend of $0.45/share to its stockholders, comprising an $87.3mm payout. Moreover, the company repurchased 1.2mm shares from REH Company for a total of $411mm after the quarter's end. This brought the YTD total cash return—which includes both dividends and share repurchases—to >$834mm.
Economic analysis of value
Several inflection points are worth noting regarding HEP's business economics. The company is a good steward of capital my view, and compounds capital at reasonable rates of return.
For starters, the firm enjoys NWC efficiencies. Figure 3 outlines its cash conversion cycle ("CCC") and DSO on a rolling TTM basis since 2020. As of Q2, it was recycling each $1 tied up in NWC back to cash in less than a month, 24 days to be precise. Say it maintains an avg. 25 day CCC going forward, HEP would turn over its NWC 14.6x over the next 12 months, presuming 365 days in the year. But each $1 in NWC returning to cash in <1 month means the cash can be put back to work at a faster rate.
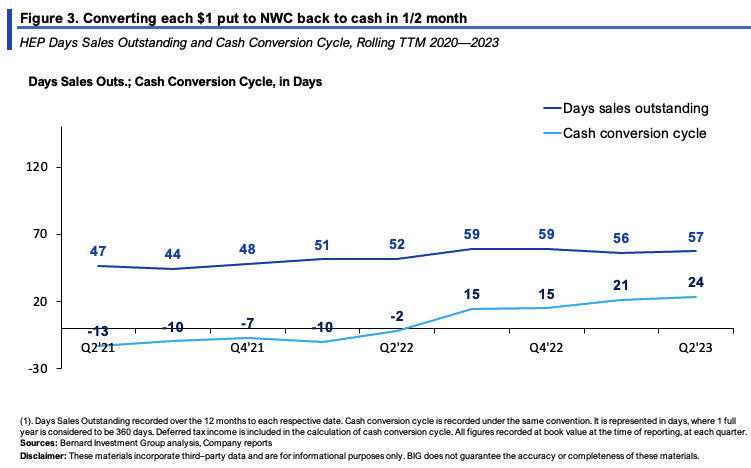
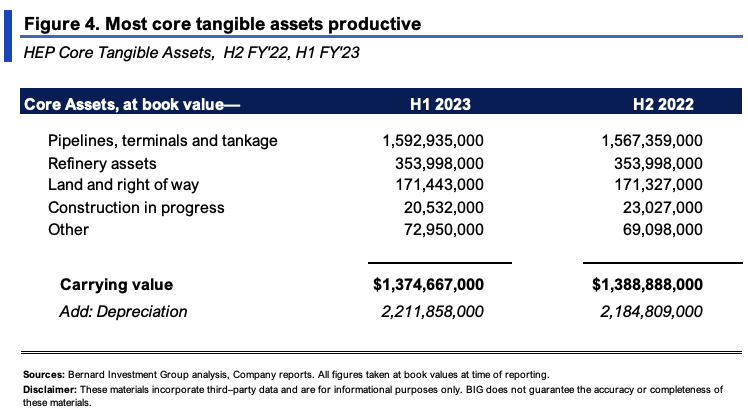
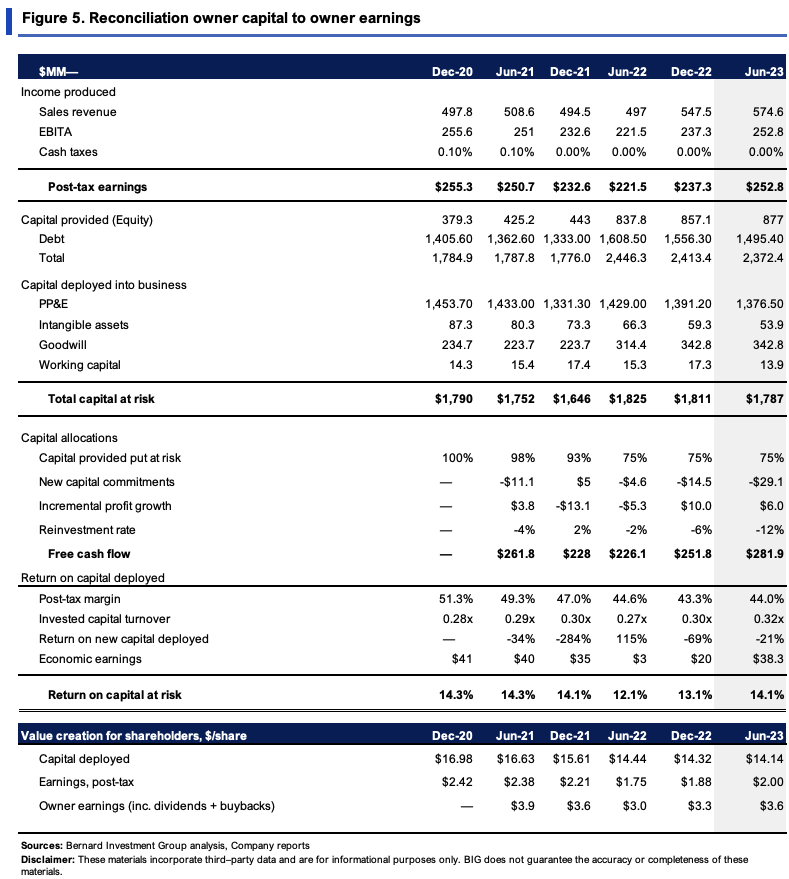
HEP's capital productivity is worth noting too. Its core tangible assets are noted in Figure 4, listed at carrying value. But the important data is observed in Figure 5. It had deployed $1.79Bn of capital at risk into the business by Q2, equating to $14.14/share, less intensive than previous periods (TTM values). The $14.14/share produced $2/share in trailing post-tax earnings in Q2, an attractive 14% rate of return. Including all dividends paid up, HEP spun off $3.60/share to its owner over the TTM.
Critically, this is where I see the most potential value in HEP. I've rhapsodized at length in the past about the absence of differentiation amongst oil + gas players (all the way from mine to storage + transportation). Most providers are bound by similar pricing constraints, indistinguishable as they all have the same core offerings. But consider the following:
- HEP's core assets and business model is tremendously profitable at the margin. It regularly posts 45—50% post-tax margins on the $1.7—$1.8Bn of capital required to run the business. This tells me it either (i) employs a cost differentiation strategy, pricing its offerings above industry averages, and/or (ii) enjoys consumer advantages versus its competitors. So its investments are profitable, as mentioned.
- But capital turnover is low, at ~0.3x on a regular basis. That's $0.30 in sales for every $1 of invested capital, which could be higher in my view. But this squares off with the economics of the business. HEP is offering services from its core assets, not necessarily using them to make sales, or rotating a heap of inventory.
Points (1) and (2) describe what value you can expect out of any company. Think of in food terms. Your profit is like a tasty dish, say, ramen noodles in this instance. High post-tax margins mean you get a big serving in your bowl. High capital turnover means you get plenty of servings (ideally >1). Ideally, you want both to be high, but it's rarely the case. Hence you'd be looking at any upsides in capital turnover as a positive catalyst to HEP's earnings going forward.
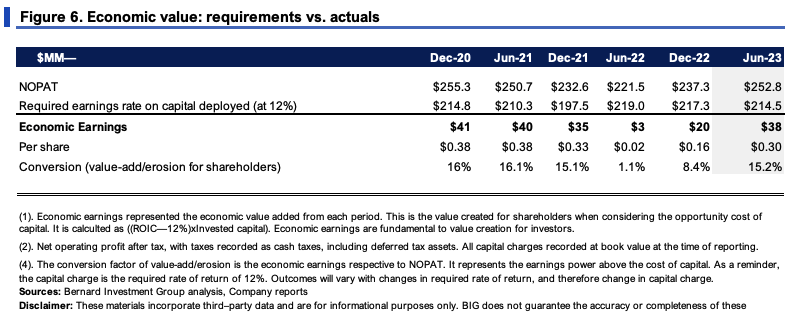
The 14% rate on capital is an important number. We employ a 12% required return on investment for all our equity holdings. We're after economic earnings above this 12% rate. This in mind, you can see in Figure 6 the economic profits HEP has thrown off to its owners above the 12% threshold, amounting to $0.30/share last period.
Forward expectations at steady-state value
The core value drivers of HEP's operations over the last 3 years are noted in Figure 7. Sales growth has been flat, but, as shown earlier, pre-tax margins are high.
Critically, with every new $1 in sales, HEP reduced its fixed asset density by $1, basically matching. This tells me:
(i). The assets employed in the business are driving more sales per unit of investment;
(ii). HEP requires less ongoing investment to hit a stated level of business growth, without crimping income at the margin.
BIG Insights
Should HEP continue at this steady-state, HEP could spin off plenty of cash flow to its owners. But, sales growth would be flat, and the business would shrink.
Actually, consensus has HEP's sales to grow 10% this year and ~6.25% in FY'24, at an average 8% rate. Carrying this forward, and assuming a 5% rate of fixed capital investment, the company could spin off $280mm—$380mm in FCF, with $9–$15mm in quarterly investment ($32—$40mm annualized). This would mean a c.$50mm total investment to grow earnings post-tax by ~$140mm, >260% return on incremental capital. Seeing as its capital returns are high, and above the 12% threshold, each 1% growth in sales would be complementary to FCF and economic value.
BIG Insights
Technical considerations
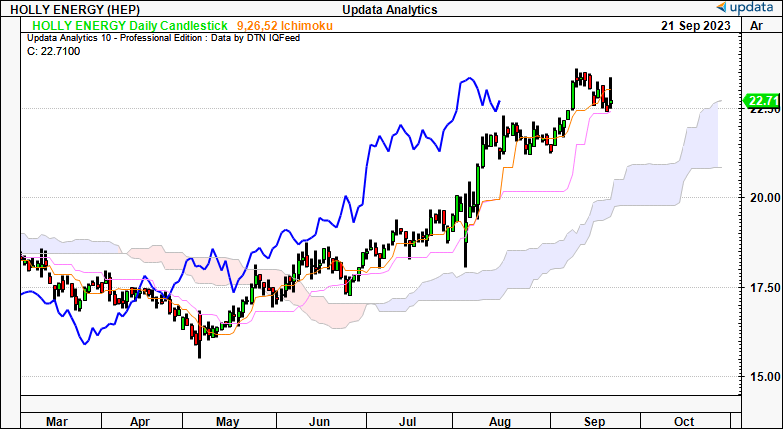
Regarding the market-generated data, charts 1–3 speak for themselves, covering both daily and weekly time frames.
- Chart 1 (daily cloud chart):
- Both price and lagging lines positioned above the cloud in bullish territory.
- Support currently ~$20, would lift to $22 with a break higher from here.
- Confirms bullish uptrend in continuation of trend seen since May.
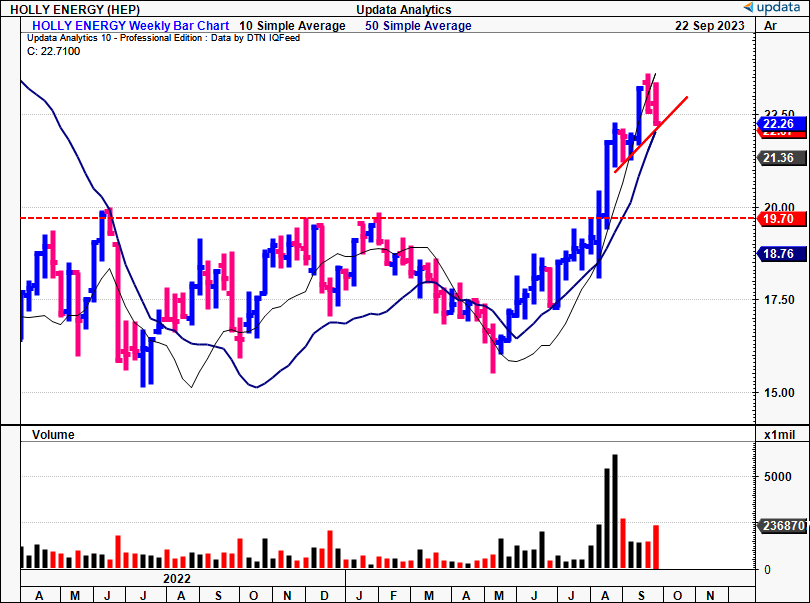
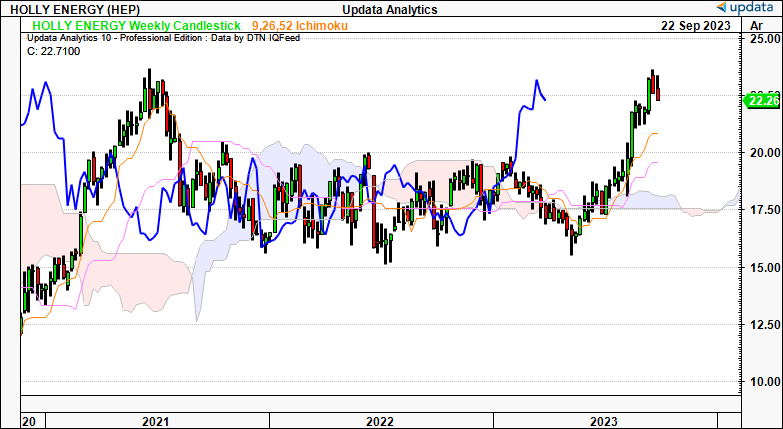
- Chart 2 (weekly):
- Both price and lagging lines also above the cloud, with near-vertical move exhibited after the cloud cross.
- Now testing prior highs of '21, support at $20.00 on this frame as well.
- Corroborates bullish view and confirms bullish trend out to the coming months.
- Chart 3 (daily point and figure):
- Upside targets to $25.30, after potential consolidation to ~$22. This looks to have been met, so I'd be looking to the $25 mark as the next short-term target.
- P&F has eyed the moves beyond $16–$17 well, catching the $19 target along the way.
- Also corroborates bullish view.
Data: Updata
Valuation and conclusion
The stock sells at ~12x forward earnings and ~18x forward EBIT. Both are notable premiums to the sector of 13.5% and 90% as I write. It could be argued the sector is overly-cheap, however. You're getting a 12% forward cash flow yield in buying HEP today, so the value is certainly there.
How much value is the next question. Investors have priced the company at a 2.5x multiple to its invested capital, indicating their expected earnings power. The risk is the market has reflected its forward growth potential well in the current market levels, which could be the case as seen in Figure 9.
BIG Insights
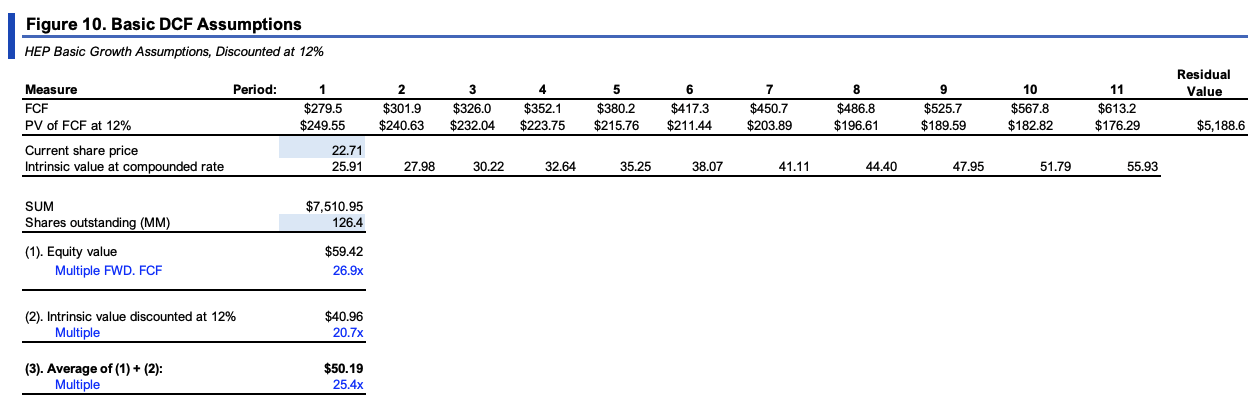
But a more thoughtful analysis is required. Extending the forecasts laid out in Figure 8 to FY'28 and discounting at the 12% gets you to $59/share in implied value. Compounding HEP's intrinsic value at the function of its ROIC and reinvestment rate to FY'28 gets you to ~$41/share. Averaging the two arrives at $50/share, more than 127% value gap at the time of writing. Changing the revenue growth rates to 5% arrives at $30/share. So even if HEP misses targets, I believe the company is still undervalued. This supports a buy rating.
In summary, HEP is throwing off attractive rates of cash to its owners whilst producing equally attractive rates of return on the capital required to run the business. These two investment facts make for an interesting set of economics that (i) support HEP's dividends well, (ii) provide grounds for plenty of cash to be spun off to shareholders, and (iii) attract higher market values over time. Net-net, I rate HEP a buy, eyeing a performance band of $50/share in the upside case, and $30/share in the downside case.
For further details see:
Holly Energy Partners: Excellent Prospects Driven By High Economic Leverage On Capital Deployed