MDC - Home Builders' Base Rates: A Reference For Better Fundamental Analysis
2023-06-01 14:23:54 ET
Summary
- I am sharing the base rates for the US home builders. They covered the performance from 2005 to 2022 to reflect the most recent peak-to-peak Housing Starts cycle.
- The base rates are meant to be a reality check when you carry out a fundamental analysis. I also shared how I have used them and ways to avoid biases.
- My key metrics are ROE and Gross Profitability. Their current performance is lower than those in 2005.
- The base rates illustrate the cyclical nature of the various metrics. According to Damodaran, we should look at the performance over the cycle if we want a long-term view of the company.
The rationale of my analysis
In his book "Think Twice: Harnessing the Power of Counterintuition", Michael Mauboussin discusses how we can:
"... fall victim to simplified mental routines that prevent us from coping with the complex realities inherent in important judgment calls."
One of the routines is the inside view. The inside view is how we view our situation, relying on our narrow experiences and intuition to make decisions.
"The inside view is the one that all of us … adopted to assess the future of our project. We focused on our specific circumstances and searched for evidence in our own experiences." Daniel Kahneman
There is another way to view things called the outside view. The outside view is how we view other people's situations. It considers similar situations that can provide a basis for decision-making. The outside view looks at other experiences (base rates) so that we can have a more realistic expectation.
The above is the inspiration for this article. I have compiled the historical data of the top 9 US home builders for revenue, returns, margin, debt, and cashflows. These will serve as base rates for the home builders.
For details on the selection of the companies to form the panel, refer to the Method section. I used the past 18 years' financials for this. The 18 years will cover the performance over the most recent Housing Starts cycle.
I am looking at opportunities to invest in home builders. These base rates served as references when assessing the performance of a potential target. I hope you can use it for the same purpose.
Housing Starts
The US Housing Starts is cyclical as can be seen from Chart 1. The most recent peak-to-peak cycle seemed to be from 2005 to 2022. To obtain the base rates over the cycle, I considered the performance of the panel from 2005 to 2022.
Chart 1: US Housing Starts (FRED)
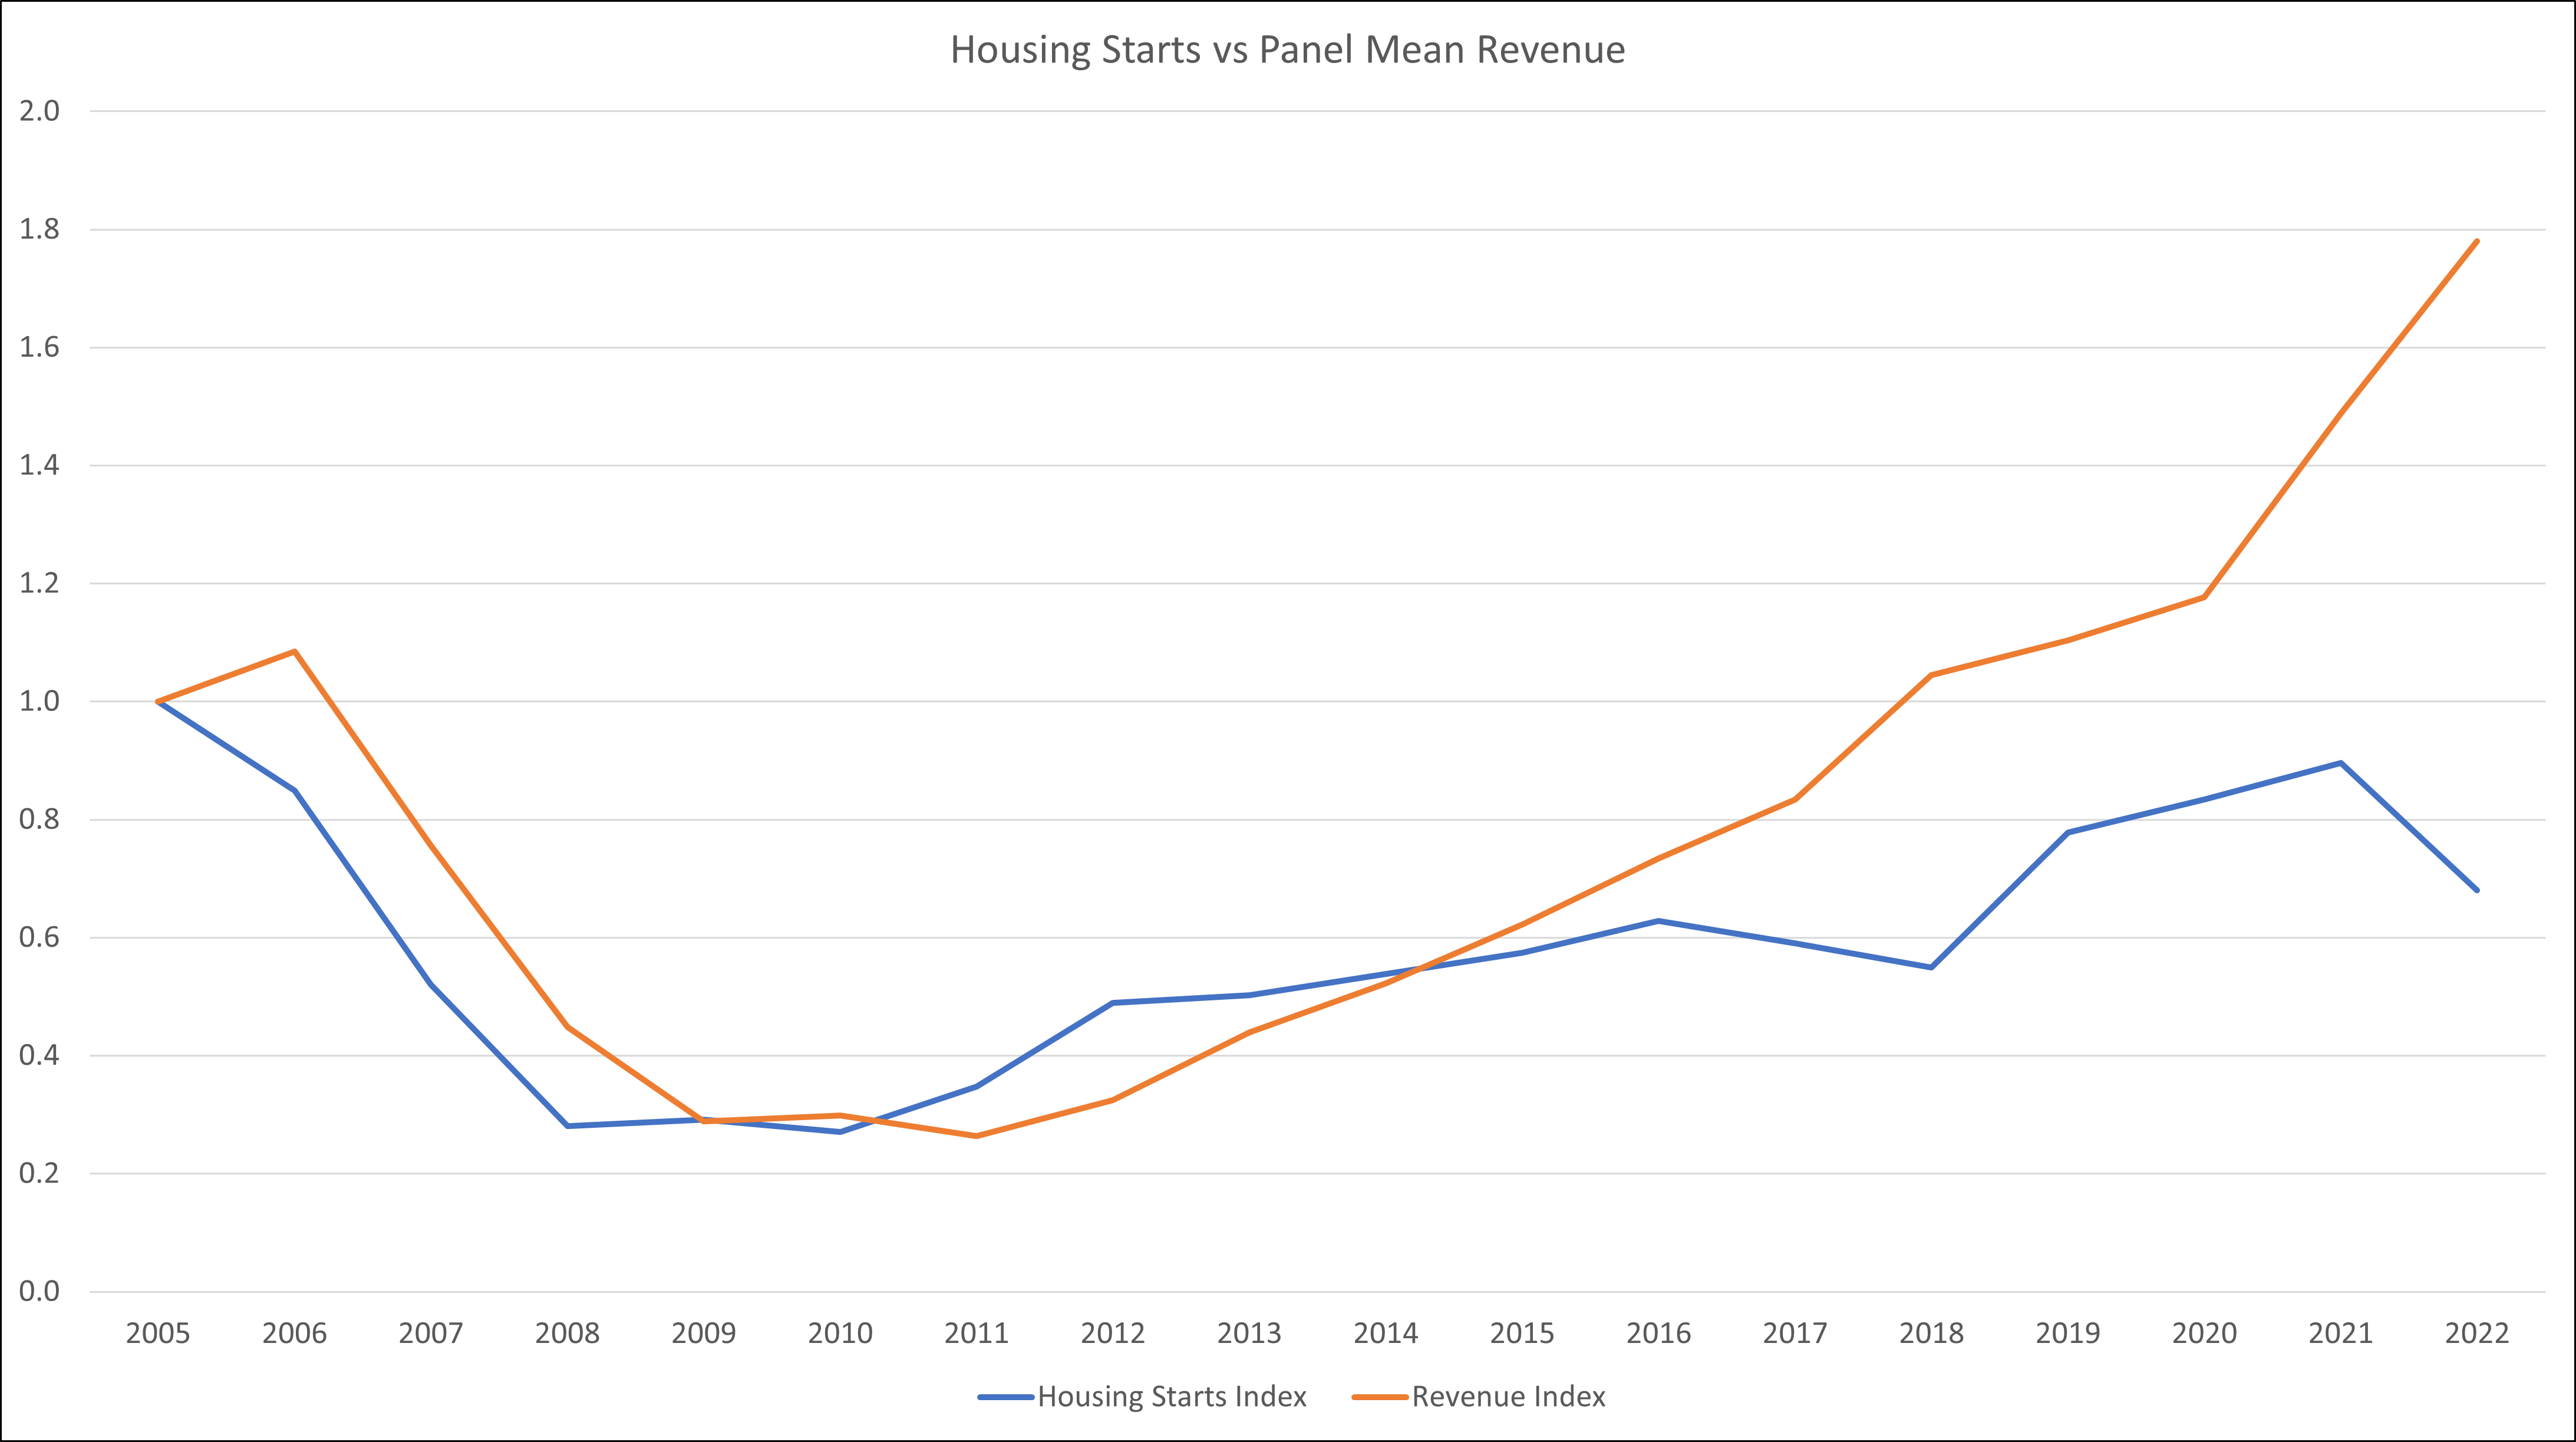
Over the past 18 years, there was a 0.77 correlation between the US Housing Starts and the mean revenue of the panel. You can see from Chart 2, that from 2005 to 2016, the panel mean revenue closely tracked the Housing Starts. The correlation during this period was 0.90.
Chart 2: Housing Starts vs Mean Revenue (Author)
Notes to Chart 2:
a) To be able to plot revenue and Housing Starts on one chart, I converted them into indices.
b) The index for a particular year is obtained by dividing the value for the year by the respective value in 2005.
But there seems to be some divergence from 2016 onwards. One possible explanation for this is that the Housing Starts are reported in units. But revenue comprises both units and selling prices.
The divergence could be due to the increase in unit selling prices since 2016. If you look at Chart 3, you can see that the Housing Price Index in 2016 is about the same level as in 2005. But from 2016 to 2022, the Housing Price Index grew at 10 % CAGR.
We know that Housing Starts are cyclical. What if the current drop in Housing Starts is not "volatility" but the start of the downtrend of the next cycle? I would then expect the number of units to be sold by the home builders to drop.
The revenue impact will depend on the unit selling price. You can see from Chart 3 that the Housing Price Index is currently no longer trending up. Will it drop like what happened from 2008 to 2012, or this is merely a sideway pattern?
Looking at Chart 3 will not tell you which way it will go. But I hope this is a useful risk management insight for those who are currently thinking of investing in home builders.
Chart 3: US Housing Price Index (Trading Economics)
Base rates
I am a long-term value investor holding onto stocks for 6 to 8 years. You should not be surprised that my base rates cover almost 2 decades of performances.
Secondly, I don't look at quarterly results. Rather I focus on annual performances. In other words, don't use my base rates to see what is going to happen next quarter.
While I have compiled quite a lot of information, for this article, I will present them as charts. Furthermore, they cover what I focus on when I carry out my fundamental analysis.
Nevertheless, if any reader would like further information, I would be happy to share them.
Base rates - top line and bottom line
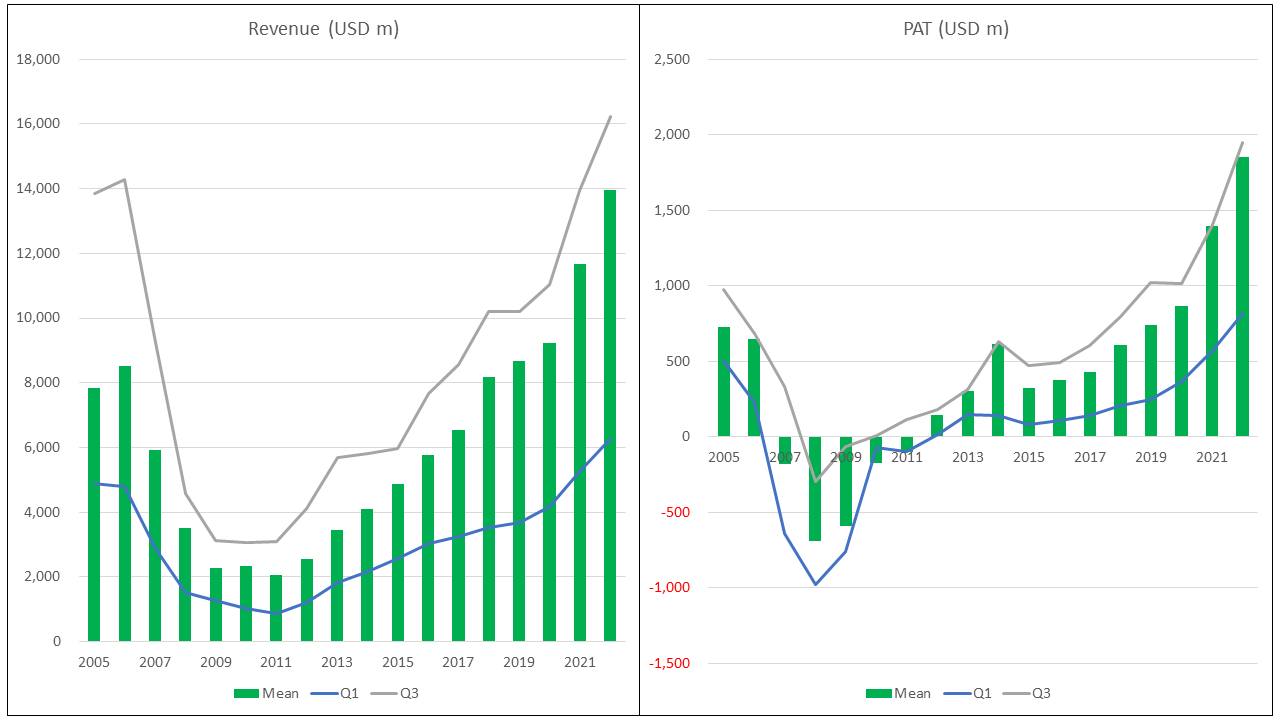
Looking at Chart 4, you will notice that the means for both revenue and PAT (profit after tax) were very close to the respective upper quartiles (Q3). This is probably because of one or two companies with outlier revenue or PAT.
You can see that during the trough of the cycle, even the upper quartile suffered losses. In other words, losses were broad-based.
Damodaran opined that the value of cyclical companies is often more dependent on the movement of the commodity price than on firm-specific characteristics. Valuing such companies based on their current earnings can lead to a misleading picture.
We should thus look at the "normalized" earnings over the cycle. Chart 4 supports Damodaran's advice.
Notice how the interquartile range has changed over the cycle. At the peak, the range is much wider than during the trough. You could conclude that the larger companies are earning more during the peak. But before you draw any conclusion, look at the returns.
Chart 4: Revenue and Profit After Tax (Author)
Base rates - margins
If revenue and PAT were cyclical, you may think that profit margins (or loss margins) should be "stable".
But Chart 5 showed that both the Gross Profit Margins and PAT Margins are also cyclical. Their correlation with the Housing Starts from 2005 to 2022 was 0.81 for the Gross Profit Margins and 0.72 for the PAT margins.
I would consider the Gross Profit Margins correlation as significant. Again, heed Damodaran's advice when looking at this metric for home builders.
Chart 5 also showed that during the trough of the cycle, the loss margins (negative PAT margins) incurred by the smaller companies (Q1) were more severe.
I am not sure whether this means that you should exit the smaller companies faster than the bigger ones when you see a Housing Starts downtrend.
Chart 5: Margins (Author)
Base rates - returns
Given the cyclical patterns for the profits, you should not be surprised that the returns were also cyclical.
As can be seen from Chart 6, the pattern for the ROE is very similar to that for the ROA.
The current ROE is lower than that in 2005. This is strange given that the current PAT is very much higher than that in 2005. Refer to Chart 4. This is due to the higher growth in the Total Equity as shown in Chart 7.
Chart 6: Returns (Author)
We have a different picture when it comes to ROA where the current performance is better than that in 2005. I would say that this is because the growth in the Total Assets was lower than the growth in Equity. Refer to Chart 7.
Looking at Chart 6, you can see that the change from positive returns to negative ones during the cycle trough seemed more severe for the mean and lower quartile.
I refer to my point made earlier. Does it mean that you exit the smaller companies faster than the bigger ones when you see a Housing Starts downtrend?
To come back to my earlier observation about the larger interquartile range for the PAT during the peak. We don't see this pattern in the returns.
Moral of the story? Never look at one metric in isolation.
Chart 7: Equity and Total Assets (Author)
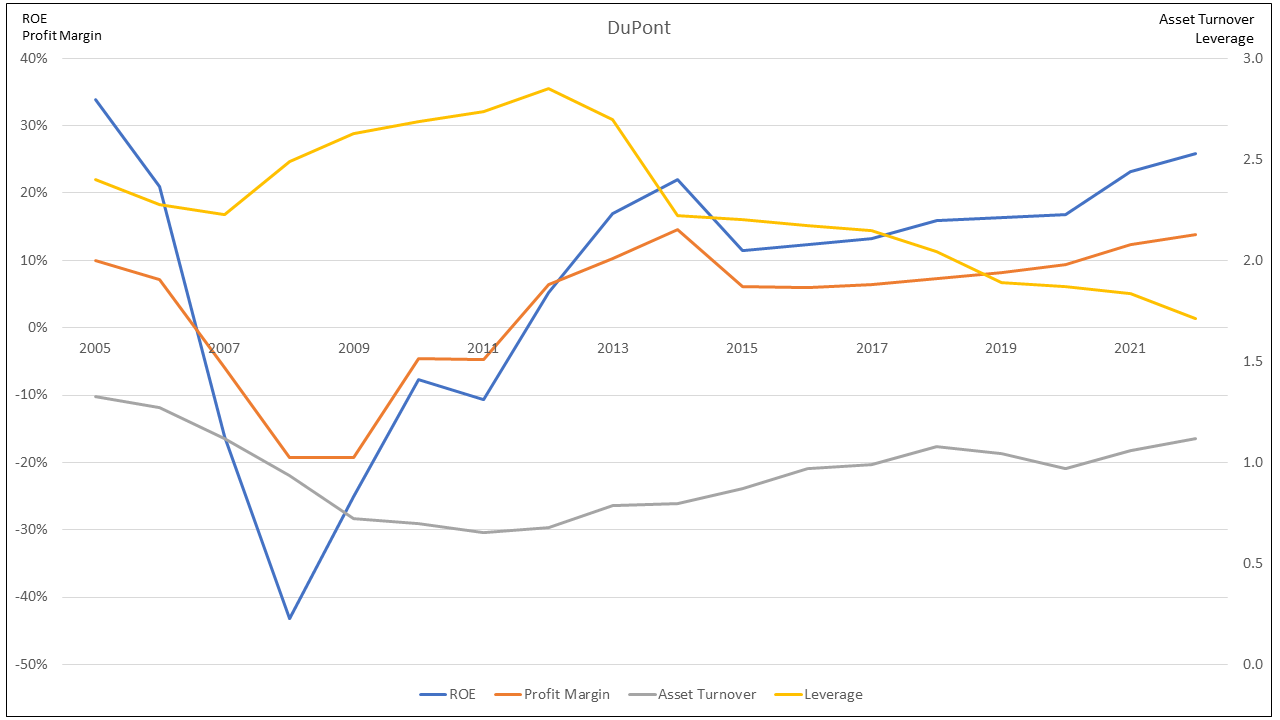
A DuPont's analysis of the mean return showed that the Profit Margin accounted for the bulk of the changes in the ROE.
The interesting thing is that the current ROE is even lower than that in 2005. This is because the higher Profit Margin was offset by the lower Asset Turnover and Leverage.
Chart 8: DuPont Analysis (Author)
Base rates - Financial strengths
The positive sign is that the panel is today financially stronger than in 2005. Looking at Chart 9, you can see that both the Debt Equity ratio and Leverage are currently lower than those in 2005.
I would go as far as to say that patterns for both these metrics seem to be an inverse of the Housing Starts pattern.
There are two possible explanations for this:
- During the Housing Starts uptrend, the panel did not require as much funding compared to the downtrend leg.
- Companies lost money during the trough period thereby reducing the Equity.
Chart 7 suggests that the latter explanation is the most likely one.
Chart 9: Financial Position (Author)
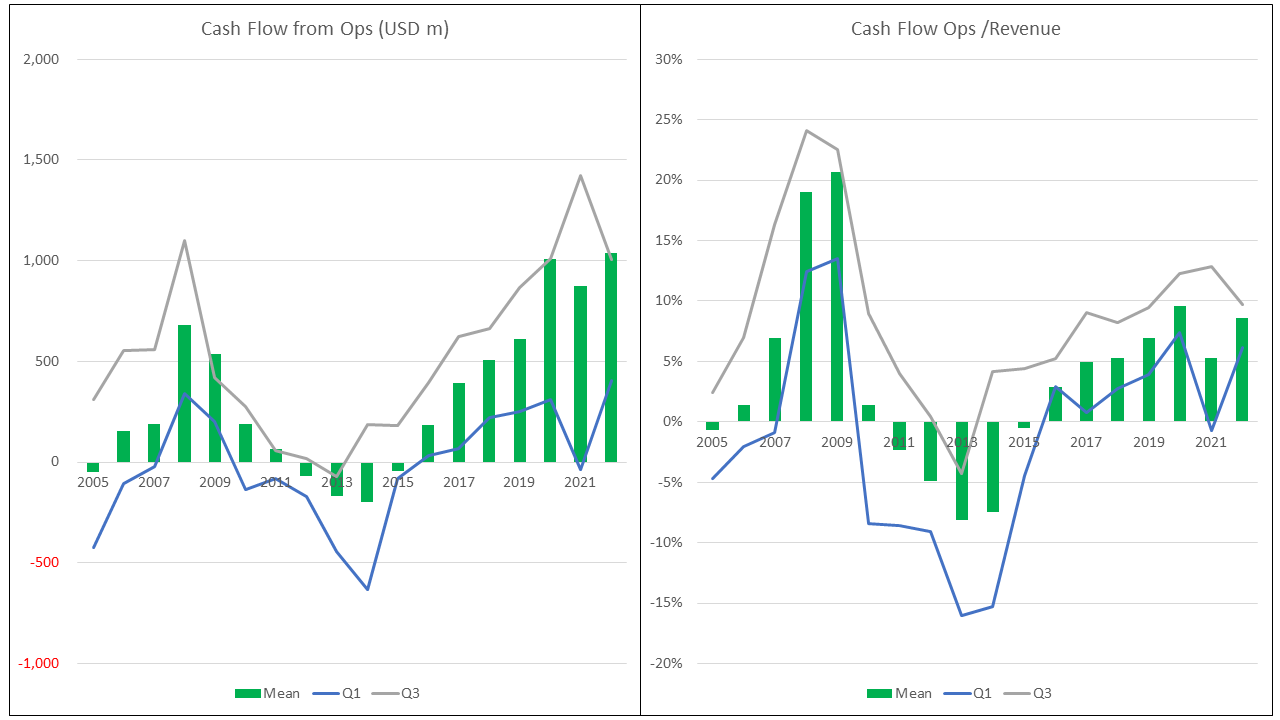
I am not sure whether this is because more cash flows were generated during the uptrend leg. To gauge this, I next look at the cash flows. Chart 10 suggests the following:
- There is a lag between the Cash Flows from Operations and the Housing Starts. The bottom of the Housing Starts was from 2008 to 2010. The bottom of the Cash Flows from Operations was about 4 years later.
- The current cash flow generating ability, as measured by the Cash Flow from Ops as a % of revenue seemed less efficient compared to that 10 years ago.
Chart 10: Cash Flow from Operations (Author)
Base rates - gross profitability
Gross profitability is defined as Gross Profits/Total Assets. According to Professor Novy-Marx, this has the same power as PBV in predicting cross-section returns of stocks.
There is a 0.89 correlation between this metric and the Housing Starts. When the Housing Starts goes into the downtrend leg, expect the stock returns to follow suit.
You can see from Chart 11 that the current performance is lower than that in 2005.
Chart 11: Gross Profitability (Author)
Conclusion
Although I have shared several comments for each metric, this is not an analysis of where the home builders will go. Rather it is a collection of data about what happened in the past to serve as base rates for future decision-making.
I am a long-term fundamental investor and over the years I have used base rates for the following purposes:
- Reality check. Base rates can help to set expectations. This is achieved by looking at the range of possible outcomes. They also help to ensure that my assumptions are grounded in reality in my valuation models.
- Risk assessment. Historical performances can give an idea of the worst-case scenario. Furthermore, sector performances can show negative trends that may not be obvious when looking at an individual company's performance.
- Inputs for my models. There are times when I am not able to use a company's historical data. For example, the company is undergoing a turnaround. In such cases, I use sector base rates to estimate the turnaround performance.
I hope what is presented here can be helpful to you.
You may argue that my base rates reflect the performance of the larger companies. If you are investing in smaller companies, the picture may be different. I have not carried out a comparison between the smaller companies and those in this panel.
But I have carried out a comparative analysis of the large, medium, and small size companies of the 100 Bursa Malaysia property companies. While the sizes of the various metrics are different, they all share the same profile/pattern. I would not be surprised to find the same thing for the US home builders. But this is a story for another day.
Base Rate Fallacy
Just because we have base rates does not mean that we can make better decisions.
This is because of the behavioral bias known as the base rate fallacy. The base rate fallacy is the tendency of human beings to prefer one set of information above the other.
For instance, when deciding to invest, you receive different information at different points in time. Because of the base rate fallacy, you tend to ignore important information and end up basing your decisions on irrelevant information.
This fallacy was discovered by Nobel Prize-winning psychologists Kahneman and Tversky.
There are several explanations for why the base rate fallacy occurs. One of the main theories is that it is a matter of relevance. We ignore base rate information because we classify it as irrelevant and therefore feel that it should be ignored.
It has also been suggested that the base rate fallacy results from the representativeness heuristic. In layman's terms, this is the mental shortcut that individuals use when making judgments or decisions. It involves relying on the degree of similarity between a specific object or event and a mental prototype or stereotype of that category.
What can we do to avoid this behavioral bias? The following measures have been suggested:
- Avoid making decisions based on recent events alone. The recent events should be viewed from a long-term perspective.
- Avoid making all decisions by yourself. Getting input and feedback from other parties can provide another perspective. I suppose you can see the various Seeking Alpha articles in this context.
- Avoid investing with a short-term mindset. From a long-term perspective, the short-term events may look like a small blip.
The key point is that the base rate fallacy can unwittingly influence our thinking. We need to take the above steps to reduce it.
Method
The panel companies were selected from Builderonline.com's list.
Builderonline.com had an annual Builder 100 and Next 100 list that looks at the top 200 home builders across the United States, ranked by closings. The list covered both private companies and public-listed ones (denoted by "p") in Chart 12.
For my panel of top 9, I had to leave out the following 4 companies from the top 13 listed (based on the 2022 rank):
- Clayton Properties as there is no readily available financials.
- Taylor Morrison, Century Communities, and LGI Homes as they did not have the financials from 2005.
Instead, I replaced them with Toll Brothers, M.D.C. Holdings, and M/I Homes.
My panel thus comprised 9 companies out of the Builderonline.com top 13 companies. I did not proceed with other companies further down the list as the gap in the closings between them and D.R. Horton was getting wider.
Chart 12: Panel (Author from Builderonline.com)
The financials for the panel companies were extracted from TIKR.com. They covered the Income Statements, Balance Sheets, and Cash Flow Statements for each company from 2005 to 2022.
To handle the large amount of data, I summarized them using a measure of central tendency and dispersion.
In my charts, I used the simple average or mean to measure the central tendency. I used the interquartile range to show the dispersion. I used EXCEL to compute these metrics and to chart them.
For further details see:
Home Builders' Base Rates: A Reference For Better Fundamental Analysis