BTAFF - Hoping For A Roaring Bull Run? Think Again!
Summary
- Relying on the high-flyers of tomorrow is a strategy that is rarely successful, emotionally taxing, and not scalable.
- In this article, I will explain, at the example of five companies, the advantages of a dividend growth strategy.
- I will highlight why the strategy outperforms in a sideways or even bear market.
- The mindset required takes time to adopt, but it helps to stay the course, even in turbulent times.
- The companies I discuss are: British American Tobacco, Lowe's, Leggett & Platt, Bristol Myers Squibb, and Houlihan Lokey.
Introduction
Who wouldn't want to be a multi-millionaire? In 2020 and 2021, returns of 100% or 1,000% were indeed seemed easily achievable - by copying the success of those referred to as the "golden hands" shared so generously in social media. With altcoins, crypto stocks, meme stocks like Bed Bath & Beyond ( BBBY ) or GameStop ( GME ), early retirement, a at least a house in Florida or some other seemingly unattainable goal, finally seemed attainable.
Until it wasn't!
In early 2023, things look very different. Aside from an occasional hiccup in meme stocks, optimism has largely faded. After all, 2022 was the worst year for stocks since the Great Financial Crisis. The strategy - if you want to call it that - of betting on tomorrow's high flyers only works for a short time and actually only resembles a kind of musical chairs. Sure, anyone can get lucky once, hit the buy button on tomorrow's meme stock at the right time, and exit the position a few days later with whopping profits. However, you should ask yourself:
Is my strategy really scalable?
After all, the strategy needs to deliver reliable and repeatable results over the long term.
In this article, I will address a strategy that is well known but usually underestimated and rarely used with success because it requires a skill that is rarely observed today: patience. I will show why this strategy performs better in a sideways or slow-growing market. I will demonstrate the strategy using the example of five companies. They operate in five of the eleven GICS sectors (consumer staples, consumer discretionary, industrials, healthcare, and financials).
Brief Overview Of The Five Companies
Let's say you have $100,000 saved up and want to start investing in 2023. You may think, "Is this the right time, after all 2022 was a really bad year. What if 2023 is even worse?" Of course, that's not the right way to think. With the strategy I will discuss in the last part of this article, you are no longer relying on capital gains, and I am confident that looking back, 2023 will be an excellent entry point to get the ball rolling, so to speak.
We assume that the $100,000 is invested in equal amounts into the stocks of these five companies, all of which have either investment-grade ratings or do not carry any debt on the balance sheet:
- Bristol-Myers Squibb Company ( BMY )
- Lowe’s Companies ( LOW )
- British American Tobacco ([[BTI]], [[BTAFF]])
- Leggett & Platt ( LEG )
- Houlihan Lokey ( HLI ).
Bristol Myers Squibb
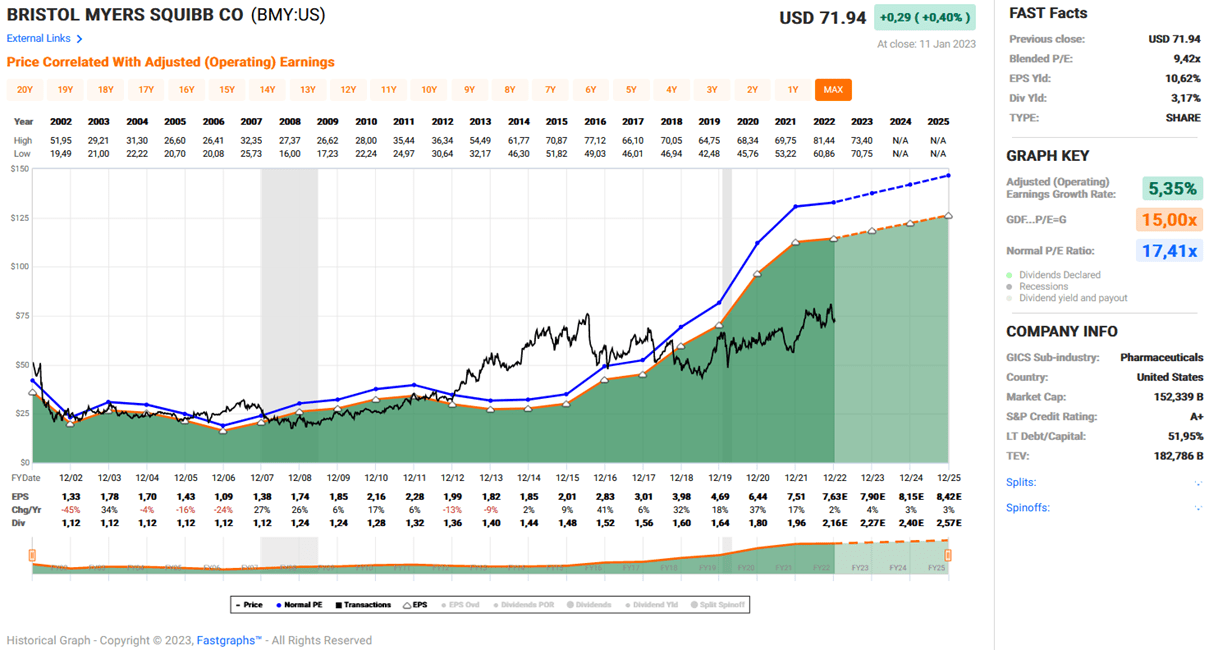
Bristol Myers Squibb is a major pharmaceutical company with a market capitalization of around $150 billion. The company has a decades-long history and made news in 2019 with its acquisition of Celgene. The transaction was risky as it added a lot of debt to the balance sheet, but looking back, it was done at the right time when interest rates were extremely low. By making this bold move, BMY diversified its drug portfolio and significantly improved its pipeline, as I discussed in my original article on the company. Free cash flow ((FCF)), the key metric an investor employing this strategy should focus on, has more than doubled since the acquisition and currently stands at about $13.5 billion (three-year average, including my estimate for 2022), after adjusting for stock-based compensation expense. As a pharmaceutical company, BMY is anything but capital intensive - it only invests about 6-7% of its normalized operating cash flow ((nOCF)) in capital expenditures. The company's cash cows are Revlimid (a small molecule cancer drug), Eliquis (an anticoagulant co-marketed with Pfizer ( PFE )), and Opdivo (an antibody-based cancer drug), which account for over 60% of sales. This concentration risk, along with generic competition for Revlimid and still significant leverage, are the main reasons the stock is relatively cheap (P/E of less than 10, FCF yield of about 9%), although the share price has risen about 30% since the December 2021 low of $55. Combinations of Opdivo (e.g., with Yervoy) will help label expansion, and BMY's pipeline includes several promising cancer drugs (Reblozyl, Abecma, Onureg, and Breyanzi), a multiple sclerosis drug (Zeposia), a hypertrophic cardiomyopathy drug (Mavacamten), and an immunology drug (Sotyktu). Of course, like all major pharmaceutical and biotech companies, BMY will be affected by the Inflation Reduction Act and the Drug Price Negotiation Initiative. Accordingly, Morningstar lowered its fair value estimate by 3% in September 2022.
Management's confidence in the business (justified in my view) is underscored by a $15 billion buyback authorization in December 2021, which should be considered in the context of BMY's net debt of currently ( Q3 2022 ) about $31 billion, including lease liabilities. This is certainly substantial, but given the strong cash flow (more than $10 billion for the foreseeable future) it is hardly a concern, as is the interest coverage ratio of about 11 times nFCF before interest. Moody's A2 rating (S&P equivalent rating A) confirms the solid financial foundation, same as the outlook upgrade from negative to stable in February 2021.
2007 was the first year BMY raised its dividend from the long-term level of $0.28 per quarter. Since then, the company has increased its dividend every year, with growth actually accelerating since 2019. I find it very interesting that Bristol Myers was a relatively unattractive investment from a dividend perspective until its acquisition of Celgene, which itself paid no dividend. Long-term dividend growth is only 4.5%, but the ten- and five-year compound annual growth rates of 5.0% and 7.3%, respectively, confirm that BMY is increasingly rewarding its shareholders through dividends. And the company definitely has the financial capacity to do so, as confirmed by its payout ratio of about 35% of average nFCF over the past three years.
The recent 5.6% increase , while somewhat modest, is still very acceptable and I see no signs of slower growth going forward. As of January 12, 2022, the stock trades with a dividend yield of 3.2%, slightly above its five-year average of 3.0%. Bristol Myers is definitely not a particularly cheap stock right now, but it is still a good value, and I continue to add to my position on weakness.
The FAST Graphs chart (Figure 1) confirms the reasonable valuation, but I would urge you not to extrapolate growth into the future, as BMY's earnings will feel the impact of generics competition going forward. However, given its strong pipeline, I am confident that Bristol Myers is a solid long-term investment. I own a modest position, but due to the fact that the performance (in terms of free cash flow) of large pharmaceutical companies fluctuates, I maintain a diversified sub-portfolio with holdings such as Amgen ( AMGN – current yield 3.2%, last increase 10% ), Johnson & Johnson ( JNJ – current yield 2.6%, last increase 6.6% ) and Merck ( MRK – current yield 2.6%, last increase 5.8% ).
Figure 1: FAST Graphs plot of Bristol Myers Squibb [BMY] (taken with permission from www.fastgraphs.com
Lowe's Companies, Inc.
After The Home Depot ( HD ), which I have covered in the past here on Seeking Alpha, Lowe's is the largest home improvement retailer in the United States. At the end of fiscal 2021, Lowe's operated 1,971 domestic stores, compared to HD's 2,371. The average SKU count is broadly similar, around 40,000.
While HD is increasingly targeting professional customers, Lowe's is more what I call a traditional home improvement retailer. However, Lowe's professional segment is also growing under the leadership of Marvin Ellison , a former HD executive. In terms of net sales, HD is much larger ($151 billion in fiscal 2021) than Lowe's ($96.5 billion), which suggests Lowe's has more room for growth, also considering that LOW could eat into HD's share of professional customers. Of course, home improvement stores are cyclical, but it seems unreasonable to expect a downturn of similar magnitude to the Great Recession.
The pandemic was a strong tailwind for home improvement stores, and both HD and LOW continue to perform well, confirming that the sales surge was not a one-time thing. The biggest risk, of course, is the U.S. housing market, which has begun to cool. However, it should be remembered that a weaker housing market is not necessarily a 1:1 headwind for home improvement retailers, as they rely heavily on renovation supplies.
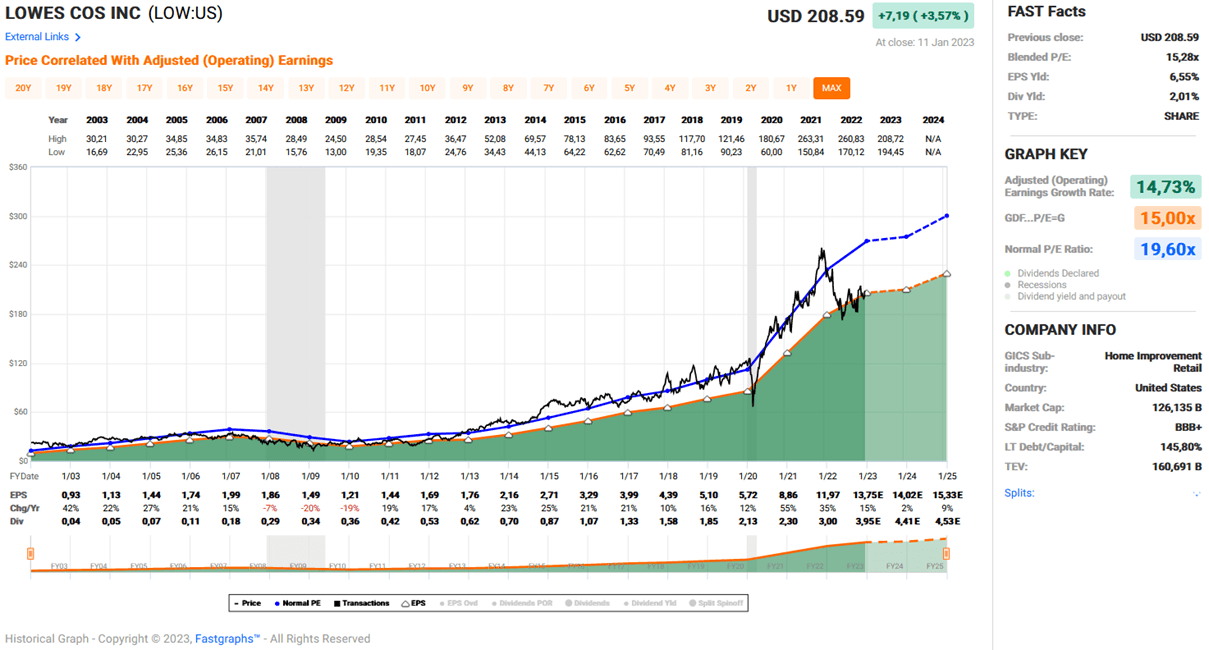
Like HD, LOW also made substantial share repurchases in 2021. On the one hand, this confirms management's confidence in the business, but on the other, it certainly represented a rather weak return on investment at the valuations at the time and also reduced the quality of the balance sheet. Lowe's net debt of $35 billion at the end of Q3 2022 is certainly substantial for a company with a market capitalization of $130 billion. However, when put in relation to average normalized free cash flow over the past three years, it appears far less worrisome. Hypothetically, without buybacks and dividends, LOW could pay off all of its debt within four years, assuming no significant economic downturn. Its interest coverage ratio is about 10 times nFCF before interest.
Moody's has rated Lowe's long-term debt Baa1 (S&P equivalent to BBB+) and affirmed its stable outlook in 2019. Apparently, the significant buybacks and somewhat muted expectations for the economy have not caused the agency to reconsider its rating. Also, Lowe's needs to invest only about 15% of its nOCF back into the business (capital expenditures), and an average nFCF margin of about 9% over three years is very solid indeed.
With a dividend payout ratio of about 30% of average nFCF, and assuming the economy does not fall off a cliff, we should continue to see generous dividend increases in the future. Lowe's dividend history is very good, but I have found varying data on the number of consecutive dividend increases. For example, MarketBeat mentions 49 years , while Sure Dividend calls Lowe's a dividend king (i.e., at least 50 years). According to company's information, Lowe's has paid a quarterly dividend since going public in 1961.
In a recent press release , management states quite modestly that it has increased its dividend for more than 25 consecutive years. The dividend growth history posted on Lowe's website goes back to 1980, and a dividend CAGR of 17.8% over four decades reads incredible. Over the last five and ten years, the company has increased its payout to shareholders at a CAGR of over 20%. However, with a looming recession and a somewhat more conservative mindset, it seems reasonable to expect slower growth in the future. It always makes me wonder when analysts extrapolate such rates into the future. I would rather be wrong on the downside than on the upside.
I do not currently own any shares of Lowe's, but given its solid long-term performance and bright future prospects, I am thinking about adding it to my portfolio to complement my still-small position in The Home Depot. Lowe's is actually quite cheaply valued, as evidenced by its dividend yield of 2.0%, for example - nearly 20% above the five-year average dividend yield. A current price-to-earnings ratio of 15 seems very reasonable indeed, as does the current nFCF yield of about 6.5%.
Figure 2: FAST Graphs plot of Lowe’s Company [LOW] (taken with permission from www.fastgraphs.com
British American Tobacco
One man's trash is another man's treasure - tobacco companies tend to be unpopular investments for obvious reasons. Due to the increased focus on more socially acceptable companies in many actively and passively managed funds, tobacco stocks continue to perform poorly from a capital gains perspective. As a global company, British American Tobacco naturally has a strong exposure to the United States. British American Tobacco owns the leading menthol brand, Newport, and is, therefore, likely to be disproportionately affected by the impending ban on menthol flavored cigarettes. In addition, the currency risk associated with investing in a foreign company (BTI reports its profits and pays dividends in pounds sterling) must also be carefully considered.
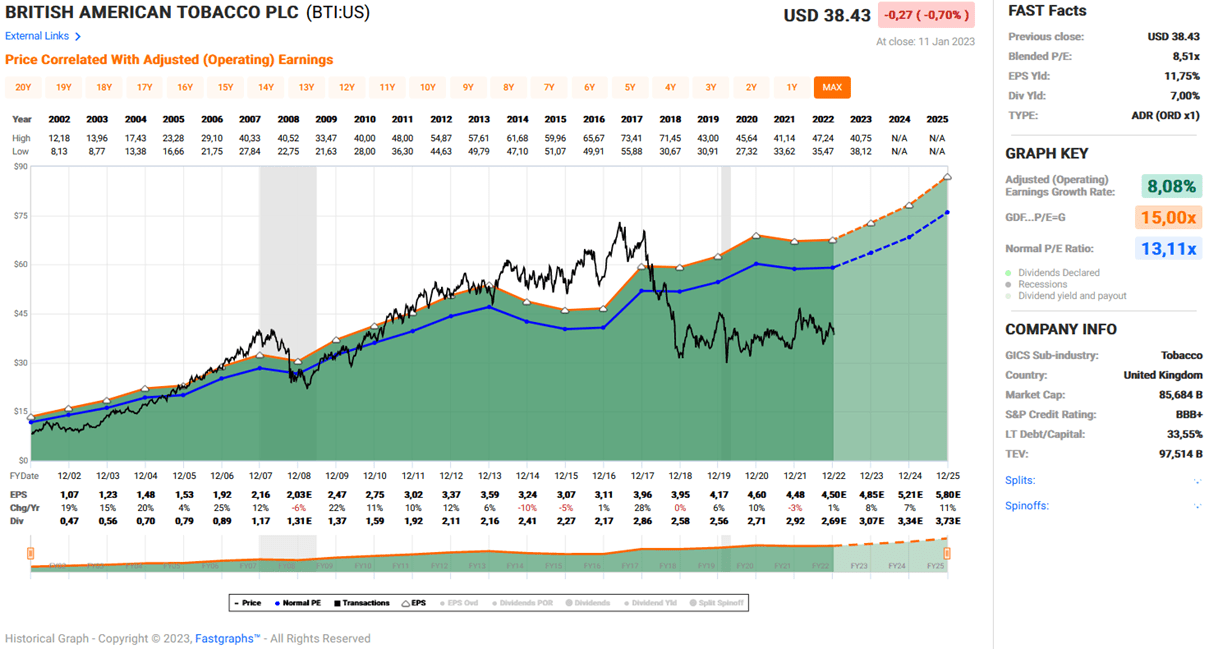
These are all factors that make the tobacco industry in general, and major player BTI (current market capitalization of £73 billion or $89 billion) in particular, appear unattractive. However, low capital expenditures - BTI only needs to invest about 6% of its normalized OCF - and very high margins result in almost unbelievably strong free cash flow. British American's three-year average normalized FCF margin is 29%. The tobacco majors have been successfully offsetting declining cigarette volumes with price increases for decades, confirming the price inelasticity of the product. BTI has a diversified portfolio of brands and, along with Philip Morris ( PM ), is the only major tobacco company that has developed meaningful modified-risk products, such as its vaping products marketed under the Vuse brand and its heated tobacco products marketed under the Glo brand.
At the end of June 2022, the company had £41.5 billion of net debt on its balance sheet . This is a significant amount, largely due to the acquisition of Reynolds in 2017. As a result, BTI's interest coverage ratio is approximately six times its three-year average nFCF. In the hypothetical case that BTI were to suspend its dividend and share buybacks, it would take five to six years to pay off all debt. These statistics read worrisome, but given the reliability of BTI's free cash flow, I am anything but nervous. 90% of its debt, which has an average maturity of about 10 years, is fixed rate. Management continues to deleverage and its confidence in the business is also underlined by a £2 billion buyback program , of which £1.3 billion was completed at the end of June 2022. Moody's long-term rating is Baa2 (S&P equivalent BBB) with a stable outlook, and the agency affirmed the rating in February 2020.
Unlike its much smaller UK competitor Imperial Brands ( IMBBY , IMBBF ), which had to cut its dividend in 2020 due to irresponsible dividend growth in recent years, BTI has increased its dividend at least since 2008. Of course, non-UK investors should consider exchange rate fluctuations in their risk assessment, but analyzing dividend growth in another currency should be avoided as it would paint a false picture. Over the last 15 years, BTI increased its dividend at a CAGR of 9.1%, but growth understandably slowed due to prioritization of debt reduction and investment in modified risk products.
Still, for a stock with a current dividend yield of 6.8%, ten- and five-year CAGRs of 5.2% and 4.5% are reasonable and very acceptable. BTI's payout ratio in relation to nFCF is typically between 60% and 70%. This is far from worrying, but underlines the limited growth prospects. In the press release on the 2022 half-year results, BTI management reiterated its intention to continue to increase the dividend.
Largely due to the reasons mentioned in the first paragraph, BTI is quite cheap. The FAST Graphs chart ( 1:1 ADRs ) in Figure 3 confirms this. A price-to-earnings (P/E) ratio of 8.5 makes BTI a solid value pick, as does the average three-year nFCF yield of 10% to 11%. I own a sizable position in British American's original shares, which trade on the London Stock Exchange, for example, or OTC via ticker BTAFF .
Figure 3: FAST Graphs plot of British American Tobacco ADRs [BTI] (taken with permission from www.fastgraphs.com
Leggett & Platt
Leggett & Platt is a diversified manufacturer of engineered components that are found in homes and commercial environments (beddings, floorings, home and work furniture), automobiles and to a very small extent also in the aerospace sector. I covered the company several times in the past (here is my original analysis ).
The company generates nearly two-thirds of its sales from consumer durables and the rest - split about 50/50 - from automotive and commercial products. It is one of the companies that has largely avoided moving its manufacturing overseas (two-thirds in the U.S., 12% in Europe, and only 11% in China), so I believe Leggett is solidly positioned in an increasingly deglobalized world.
However, being a combined consumer and industrial business, earnings are very cyclical and the capex ratio (capex dividend through nOCF) is substantial at 20% to 40%. That said, I think Leggett's three-year average normalized free cash flow margin of 8% is very reasonable, as it takes into account developments since 2020.
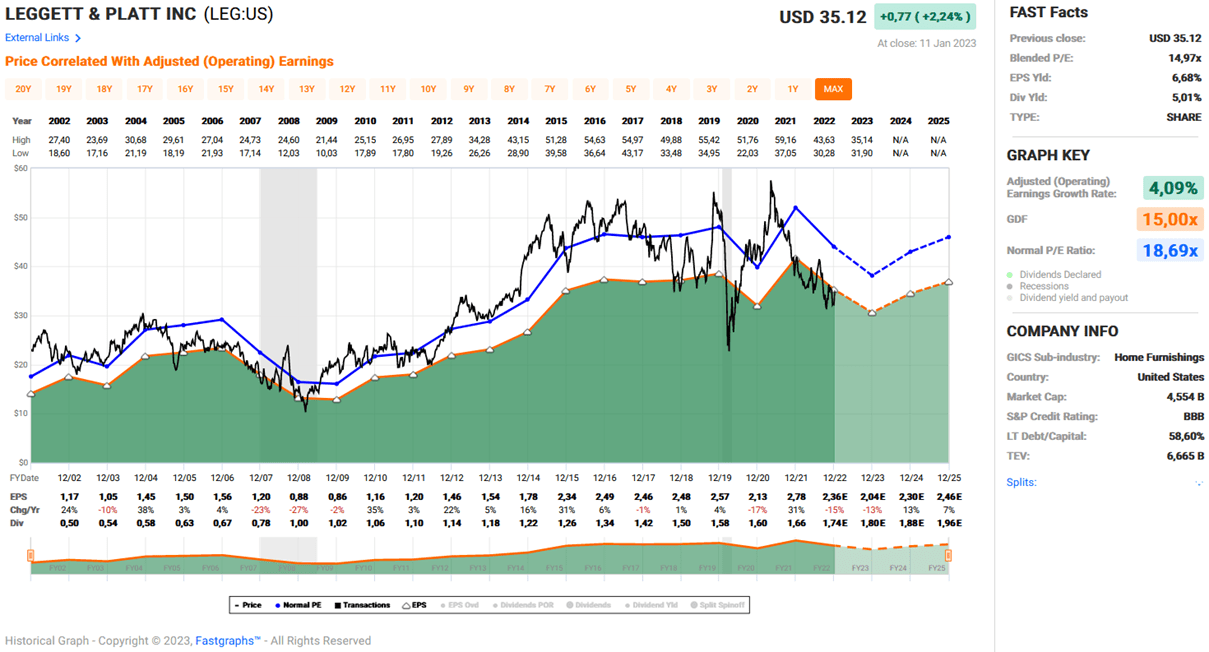
Leggett suffers from similar issues as the broader industry and, therefore, currently operates with very weak free cash flow. However, as described in my September 2022 article , the company has negotiated more flexible debt covenants in recent years, giving it room to maneuver in difficult times. The current net debt of $2.1 billion does not sound like much in absolute terms, but considering Leggett is a fairly small company with a current market cap of around $4.8 billion, it is definitely worth keeping an eye on the debt.
Normalizing FCF with respect to working capital movements, Leggett's current interest coverage ratio is about 6 times, but when using conventionally calculated FCF, it is somewhat lower due to unfavorable working capital movements. I am not suggesting that Leggett will have trouble servicing its debt in the future, but I do think that in the event of a moderate economic downturn, the company may be forced to resort to token dividend increases. However, management remains confident (underscored by moderate but very well-timed share buybacks), as does ratings agency Moody's, which saw no reason to change the stable outlook after the understandable downgrade in April 2020, from Baa2 to Baa1 (S&P equivalent rating BBB).
What I like most about Leggett is the management team - they are very reliable, have a proven track record of navigating difficult waters, and most importantly, are very open and transparent in their earnings press releases and conference calls .
Leggett's dividend history is phenomenal. The company has increased its dividend for 51 consecutive years, and management continues to place a high priority on distributing to shareholders without compromising its balance sheet . Since 1971, Leggett has increased its dividend at a CAGR of 11.5%. Believe it or not...
... one LEG share purchased in 1971 entitles the owner to an annual dividend of $93.96.
Of course, growth has slowed, but five- and 10-year CAGRs of 4.1% and 4.3%, respectively, are still meaningful and sustainable if Leggett's efforts to become a vertically integrated bedding manufacturer bear fruit (the pandemic and related fallout for now clouds the proper judgment). A payout ratio of about 60% in terms of three-year average nFCF is also quite reasonable.
Cyclical stocks like LEG should not be bought during periods of economic expansion, so the current period seems to me to be a good opportunity to build a position. I built my position in several tranches in 2022 and only occasionally buy a very small number of shares. However, even after the recovery from the recent lows, I still think the stock is a solid opportunity (dividend yield of 5.0%, P/E of 15, nFCF yield of 8.4%). Nevertheless, Leggett is certainly the riskiest stock discussed in this article and therefore requires proper diversification. Also, investors should think of LEG as an income stock, as the chart from FAST Graphs shows.
Figure 4: FAST Graphs plot of Leggett & Platt [LEG] (taken with permission from www.fastgraphs.com
Houlihan Lokey
To round out the portfolio, a diversified financial company is a good idea. As such, I value Houlihan Lokey, a little-noticed investment bank with a current market cap of about $6.6 billion. I wrote about the company in May 2022. Now, you might wonder what an investment bank is doing in a portfolio that is claimed to be only moderately cyclical after I discussed a company like Leggett & Platt.
Quite simply, Houlihan is a market leader among global restructuring firms, global M&A firms and global fairness opinion firms. Thanks to its significant restructuring division, its profits do not collapse in a recession. And given the likely increase in bankruptcies of so-called "zombie companies" (see my recent article on their social impact and how to avoid them), Houlihan should continue to do very well.
Most of Houlihan's costs are variable, with employee compensation making up the lion's share. The company does not rely on a lot of fixed assets and therefore has rather low operating leverage. Unsurprisingly, the capex ratio is extremely low at around 2% of estimated baseline nOCF. Conversely, its free cash flow margin is very solid at around 20% to 35%, even after accounting for stock-based compensation, which is understandably significant.
Houlihan's balance sheet does not require much discussion. The company is not rated by Moody's and others because it has no debt - except for a loan of about $500 million payable to a former shareholder. The main liabilities on the balance sheet are, unsurprisingly, accrued salaries and bonuses ($686 million at the end of fiscal 2023 Q2 ) and operating leases ($189 million).
Because Houlihan only went public in 2015 and began paying a dividend that year, its dividend history is quite short. However, given its strong corporate culture, savvy and motivated management, employees and partners, disciplined acquisitions (e.g., Oakley Advisory in late 2022), and low payout ratio of about 30%, I believe HLI is a solid dividend growth stock. The current dividend yield of 2.2% is quite low, but should be viewed in the context of a long-term dividend CAGR of 34%. Over the past five years, HLI has grown its payout to shareholders at a CAGR of 21.5%. If the company maintains this growth in the short term, an investor would outpace the current yield of long-term treasuries within 3 to 4 years.
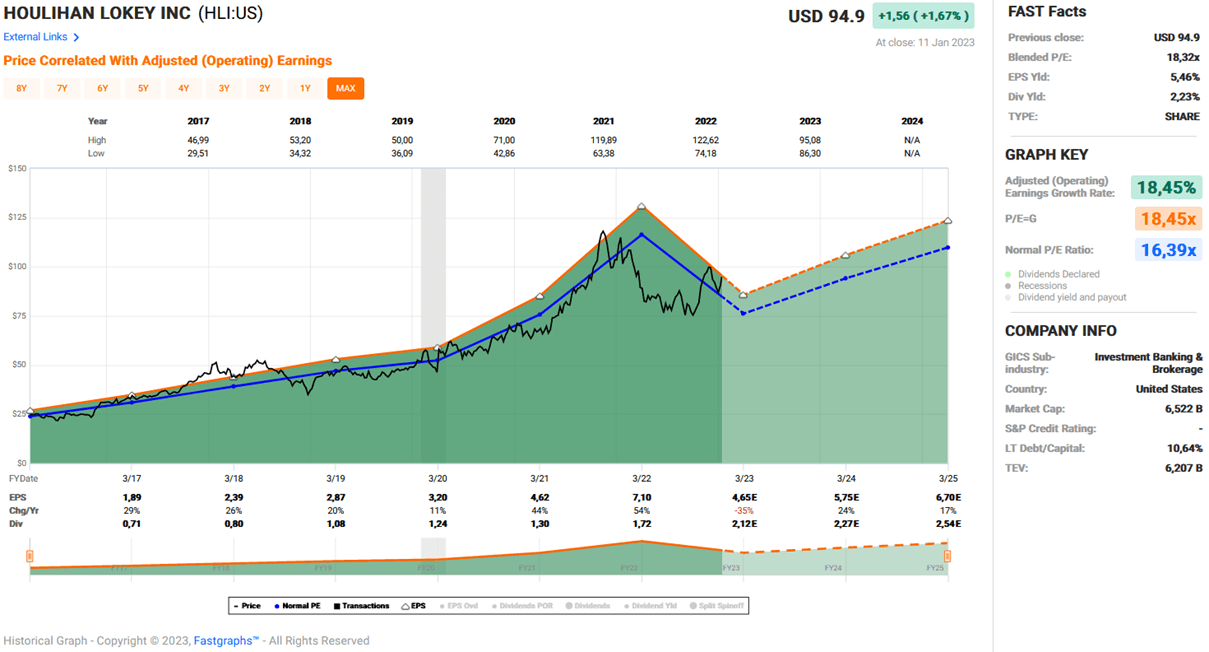
The stock has recovered well from its summer 2022 lows and, with a current P/E of 18, appears anything but cheap (Figure 5). However, the three-year average nFCF yield of 7.5% argues against this, and I believe that Houlihan’s baseline free cash flow going forward should indeed be expected at around $500 million per year, largely due to the major acquisitions it made in recent years. I started buying HLI in 2020, but my position is still modest, so I am building my position cautiously, knowing that the market can be merciless on small caps like this.
Figure 5: FAST Graphs plot of Houlihan Lokey [HLI] (taken with permission from www.fastgraphs.com)
Getting Rich Slowly - But Surely
Now that I have introduced you to these five companies, let's take a look at how an equally weighted portfolio can produce results that are far more reliable - and scalable - than betting on the next hot topic.
Let's say you invest $20,000 of your hard-earned $100,000 savings in each of the five companies. You decide to live a rather frugal lifestyle, hold down a second job, and live in an area where rent is still reasonable. You are able to save $1,500 each month and invest $300 in each of the five stocks - each month without looking at the charts. You have a good job that pays you a salary that increases with inflation. Plus, you do not spend your dividend checks, but relentlessly focus on reinvesting dividends.
To model the results below, I have assumed that the stock prices of all five stocks are increasing at their respective 20-year CAGRs. After all, a dividend reinvestment model must account for increasing stock price growth to avoid providing overly optimistic results. However, I capped the growth at 11% because I expect the stock market to perform much weaker in the future than it has over the last decade, a period that was characterized by low interest rates and asset purchasing programs. Such a ceiling may sound high, but I should add that three of the five stocks have grown at much lower rates anyway (Table 1).
Table 1: Long-term share price growth rate assumptions - BMY, LOW, BTI, LEG and HLI (own work)
Second, I accounted for dividend growth in the model using each company's 20-year dividend CAGR (if applicable, otherwise the maximum available). However, for companies with growth rates above 5%, I capped dividend growth at this value to remain conservative (Table 2). For comparison, an equally weighted portfolio of the five companies recorded a CAGR of 11.6% over the last five years.
Table 2: Long-term dividend growth rate assumptions - BMY, LOW, BTI, LEG and HLI (own work)
The starting yield of the portfolio is 3.8%, which is considered relatively high, but still acceptable from a risk-return perspective. Very conservative investors might consider lowering the starting yield somewhat, but should be careful to place more emphasis on dividend growth. With the 5% dividend growth cap in place, dividends will grow at an average CAGR of 4.7%, while stock prices will grow at an average CAGR of 6.7% - reinvestment becomes increasingly inefficient, which is another inherently conservative measure. The important insight in this context is that the slower the stock price rises, the stronger the positive effect of reinvested dividends.
Now let me ask you, would you expect the portfolio to yield dividends of nearly $21,000 after just ten years? The five positions would represent yields on cost of:
- 5.3% for BMY
- 2.6% for LOW
- 13.5% for BTI
- 11.2% for LEG
- 3.0% for HLI.
If you are patient enough to let the miracle of compounding work for another ten years, the model portfolio would pay out nearly $70,000 in dividends annually, and the yields on cost would be:
- 9.0% for BMY
- 3.2% for LOW
- 23.3% for BTI
- 28.1% for LEG
- 3.6% for HLI
The yields on cost are shown in Figure 6, which I think should be a strong incentive to think about how to become a more patient and forward-looking investor. There are two reasons for the "outperformance" of BTI and LEG. In the case of BTI, the high starting yield of 6.8% helps, even though the share price performance is quite strong at 7.6%, making dividend reinvestment somewhat inefficient. In the case of LEG, the high starting yield of 5.0% and the weak share price growth (2.1% CAGR) worked together. Growth stocks like HLI "underperform" from this perspective, but it is important to remember how small the company still is and how solid its track record is so far. Obviously, from a risk management perspective, a conservative investor might want to look into rebalancing funds, in order to avoid concentration risks.
Figure 6: Yield on cost projections for BMY, LOW, BTI, LEG and HLI (own work)
And anyone still not convinced should consider the growth of the portfolio's value. An investor starting with $100,000 today would be looking at a handsome $800,000 after less than ten years. After twenty years, the portfolio value would have grown to nearly $5 million, thanks to consistent reinvestment of dividends. It is considerations like these - but especially the growth in yields on cost - that make me an extremely confident and very patient income-oriented investor. At the same time, they illustrate why it is best to hope for a somewhat more modest bull market in the future, or even better, a sideways market.
Key Takeaways
- Your hard-earned dollars should be treated like soldiers - don't waste them on desperate ventures.
- Strategies based on hype, hope, or the greater fool theory are not scalable. When applied with success, they require consistent maintenance in a timely manner.
- Dividend investing in reliable, high-quality companies requires almost no nurturing and is unemotional.
- A dividend-focused strategy can also be maintained during periods of increased volatility without losing sleep.
- Success is largely decoupled from stock price performance - a weak bull market, a sideways market or a bear market benefit this strategy greatly.
- A frugal lifestyle, consistent reinvestment of dividends and, above all, patience and conviction are the key to success.
Thank you very much for taking the time to read my article. How did you like it, my style of presentation, the level of detail? If there is anything you'd like me to improve or expand upon in future articles, do let me know in the comments section below.
For further details see:
Hoping For A Roaring Bull Run? Think Again!