WMT - Hormel Foods Corporation: Thankful For 57 Years Of Growing Dividends
2023-11-21 19:44:35 ET
Summary
- Hormel Foods Corporation is a fairly priced dividend king with a decade-high yield.
- The company has been paying a growing dividend for 57 years and is a survivor in the consumer staples industry.
- The stock offers potential for capital appreciation and a high yield on cost for long-term holders.
The Kings are down but not out
Continuing with more fairly priced dividend kings and aristocrats at decade-high yields, today we have Hormel Foods Corporation ( HRL ). The risk-free rate of "free" short-term money has clobbered this group. While interest in bank accounts and money market funds is hardly free [the principal is static and your interest is taxed at normal earned income rates], dividend growers can provide lower-taxed "qualified" dividends that are expected to grow over time.
In my opinion, especially if you're already flush with cash equivalents, this is one of the cheapest places in the market to focus your attention on. Hormel is another buy to add to my list.
For full transparency, here is my current list that I'm buying in the higher than 10-year average yield segment:
- Clorox ( CLX )
- Realty Income Corporation ( O )
- Schwab U.S. Dividend Equity ETF ( SCHD )
- Leggett & Platt ( LEG )
- Medtronic Plc ( MDT )
- 3M Company ( MMM )
- Johnson & Johnson ( JNJ )
- Vanguard Real Estate ETF ( VNQ )
They are up to $12 Billion in annual sales and have been around since 1891. Consumer staples are survivors, they are one of the best places to look for long term, sustainable dividend growth.
10 Year Peter Lynch share price-to-earnings growth line
Starting any good analysis for a mature company should first compare the 10-year growth trends in share price versus EPS or other earnings metrics appropriate for the company at hand. We can see over the past decade, EPS has increased 62.5% whilst shares have only appreciated 19.94% . Peter Lynch always starts his case studies by analyzing this sort of chart. When price appreciation is above earnings growth, stay away. When the opposite is true, consider further analysis.
What they do
From the 10K :
The Company manages and reports its operating results in the following four segments: Grocery Products, Refrigerated Foods, Jennie-O Turkey Store, and International & Other. Net sales to unaffiliated customers, segment profit, and the presentation of certain other financial information by segment are reported in Note P - Segment Reporting of the Notes to Consolidated Financial Statements and in the Management's Discussion and Analysis of Financial Condition and Results of Operations.
Hormel is one of the oldest consumer staple packaged foods companies. Their goods are ubiquitous on the shelves and refrigerators of the US consumer. 100% of the company revenue exposure is in food production and sales.
Most Recent Quarter Revelations
EPS of $0.40 misses by $0.01 | Revenue of $2.96B (-2.34% Y/Y) misses by $88.74M
Some items from the most recent quarter call of note are the following:
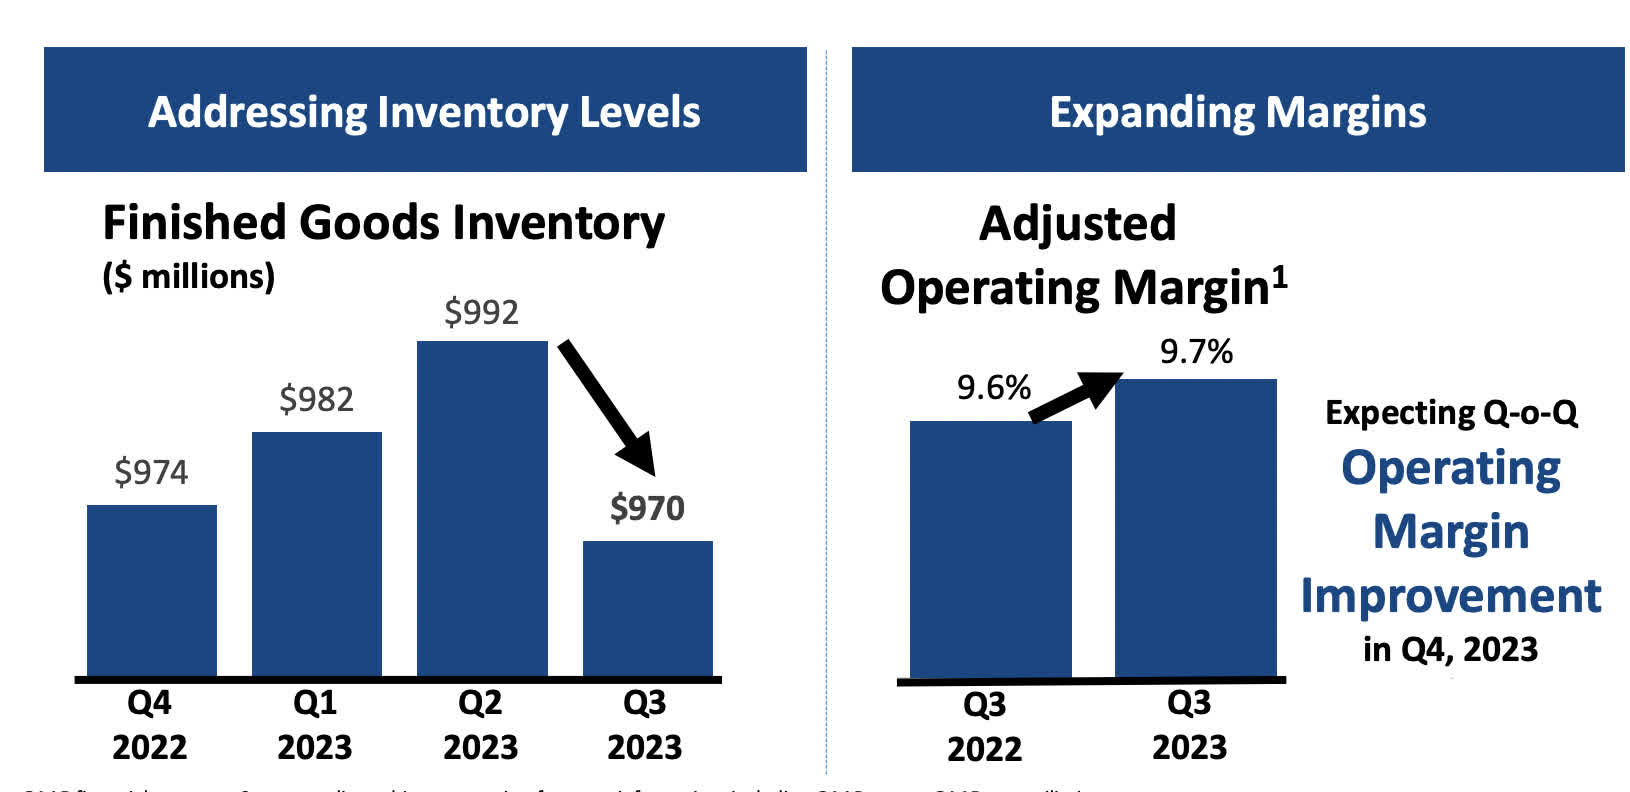
- Goal-Reducing inventory to more historical levels remains a top priority for the company. Our actions to rectify the inefficiencies caused by elevated inventory are working, demonstrated by a sequential reduction in dollars of both finished goods and total inventory.
- The value of finished goods inventory ended the quarter at its lowest level since the same time last year, representing meaningful improvement.
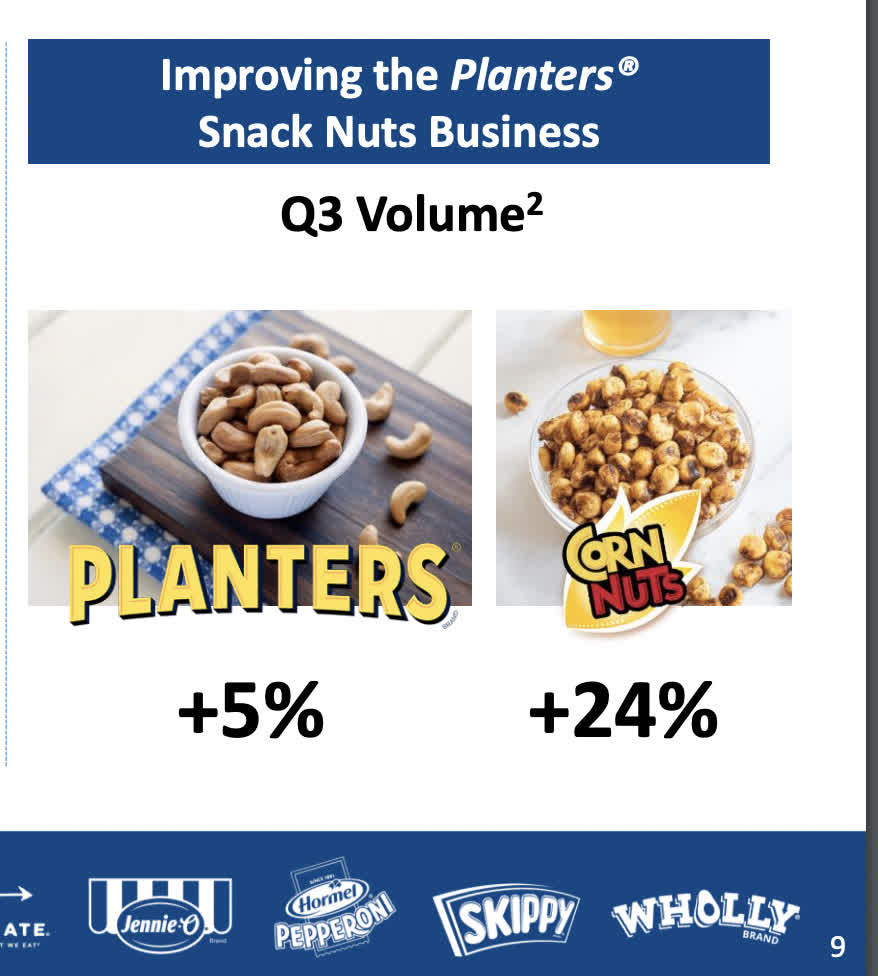
- For the quarter, retail shipments of Planter snack nuts and Corn Nuts varieties were up 5% and 24%, respectively
- We also more than overcame the positive mix impact from strong Skippy sales in turkey markets last year, as well as a 15% increase in advertising investments to support our brands during the third quarter. We expect our highest operating margins of the year in the fourth quarter aided by a seasonally strong sales mix and savings from a series of projects aimed at reducing costs and complexity throughout our system.
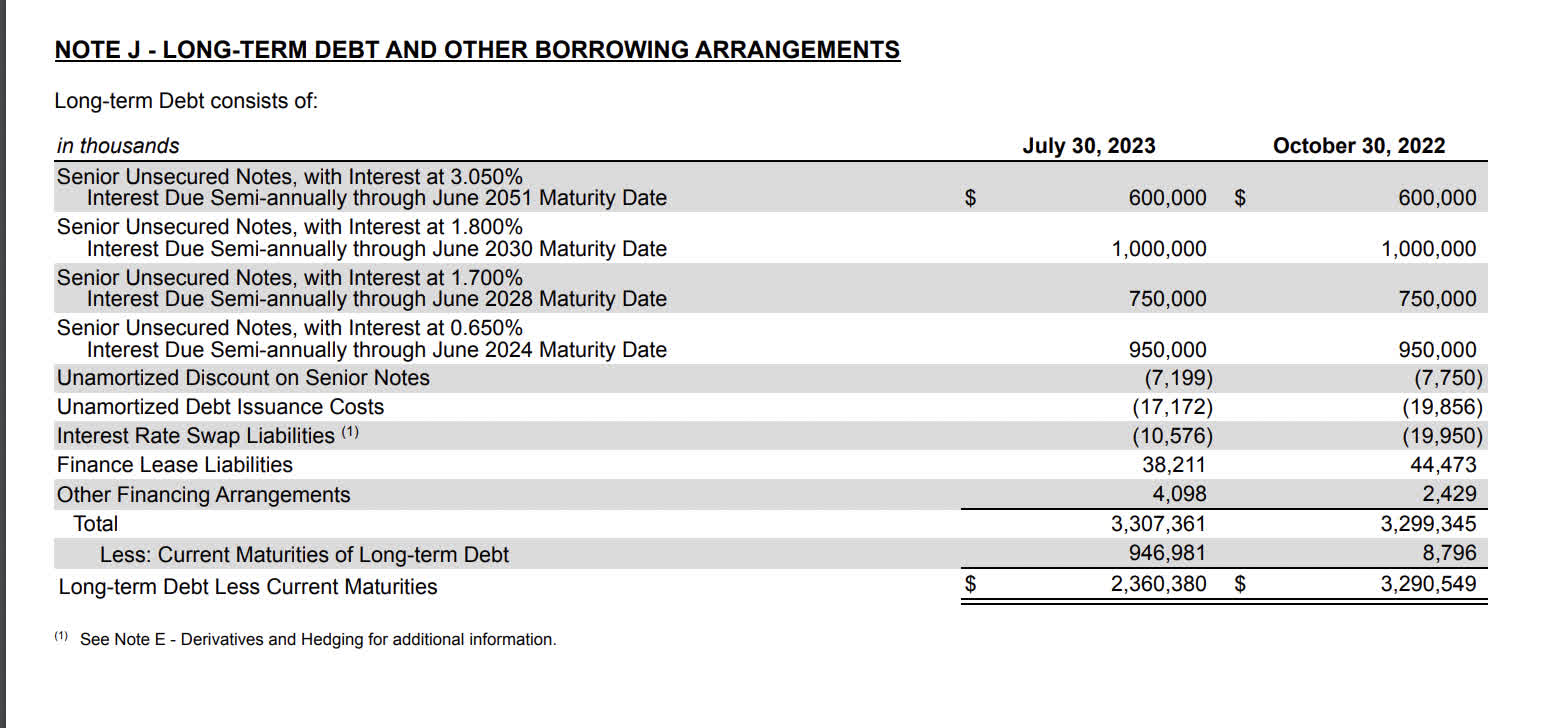
Debt and upcoming maturities:
With $946 million maturing this year creating a bit of drag on cash flow, the rest of the maturity schedule looks healthy.
- $600 million at 3.05% maturing 2051
- $1 billion maturing 2030 at 1.8%
- $750 million maturing 2028 at 1.7%
- $950 million maturing 2024
Clear skies are ahead after the upcoming 2024 maturities. We'll see in further analysis below, that Hormel Food Corporation averages about $1 Billion in free cash flow per annum. The forward dividend payment is $1.1 a share X 546 million shares outstanding, equivalent to USD 600 million. That will leave about $3-$400 million leftover to pay down debt maturing. The company also has nearly $700 million in cash and cash equivalents at current.
They may be able to pay this maturity in full if Hormel Food is willing to deplete cash reserves. My guess is they increase short-term borrowing to pay any shortfall rather than borrowing long at today's rates since the gap needed is quite narrow. The net effect of increases in interest expense should be quite minimal.
Net interest expense is currently $44 million. With total long-term plus short-term debt coming in at $3.3 Billion, that's about a 1.3% net cost of debt after adding back in the interest they have been collecting on cash equivalents.
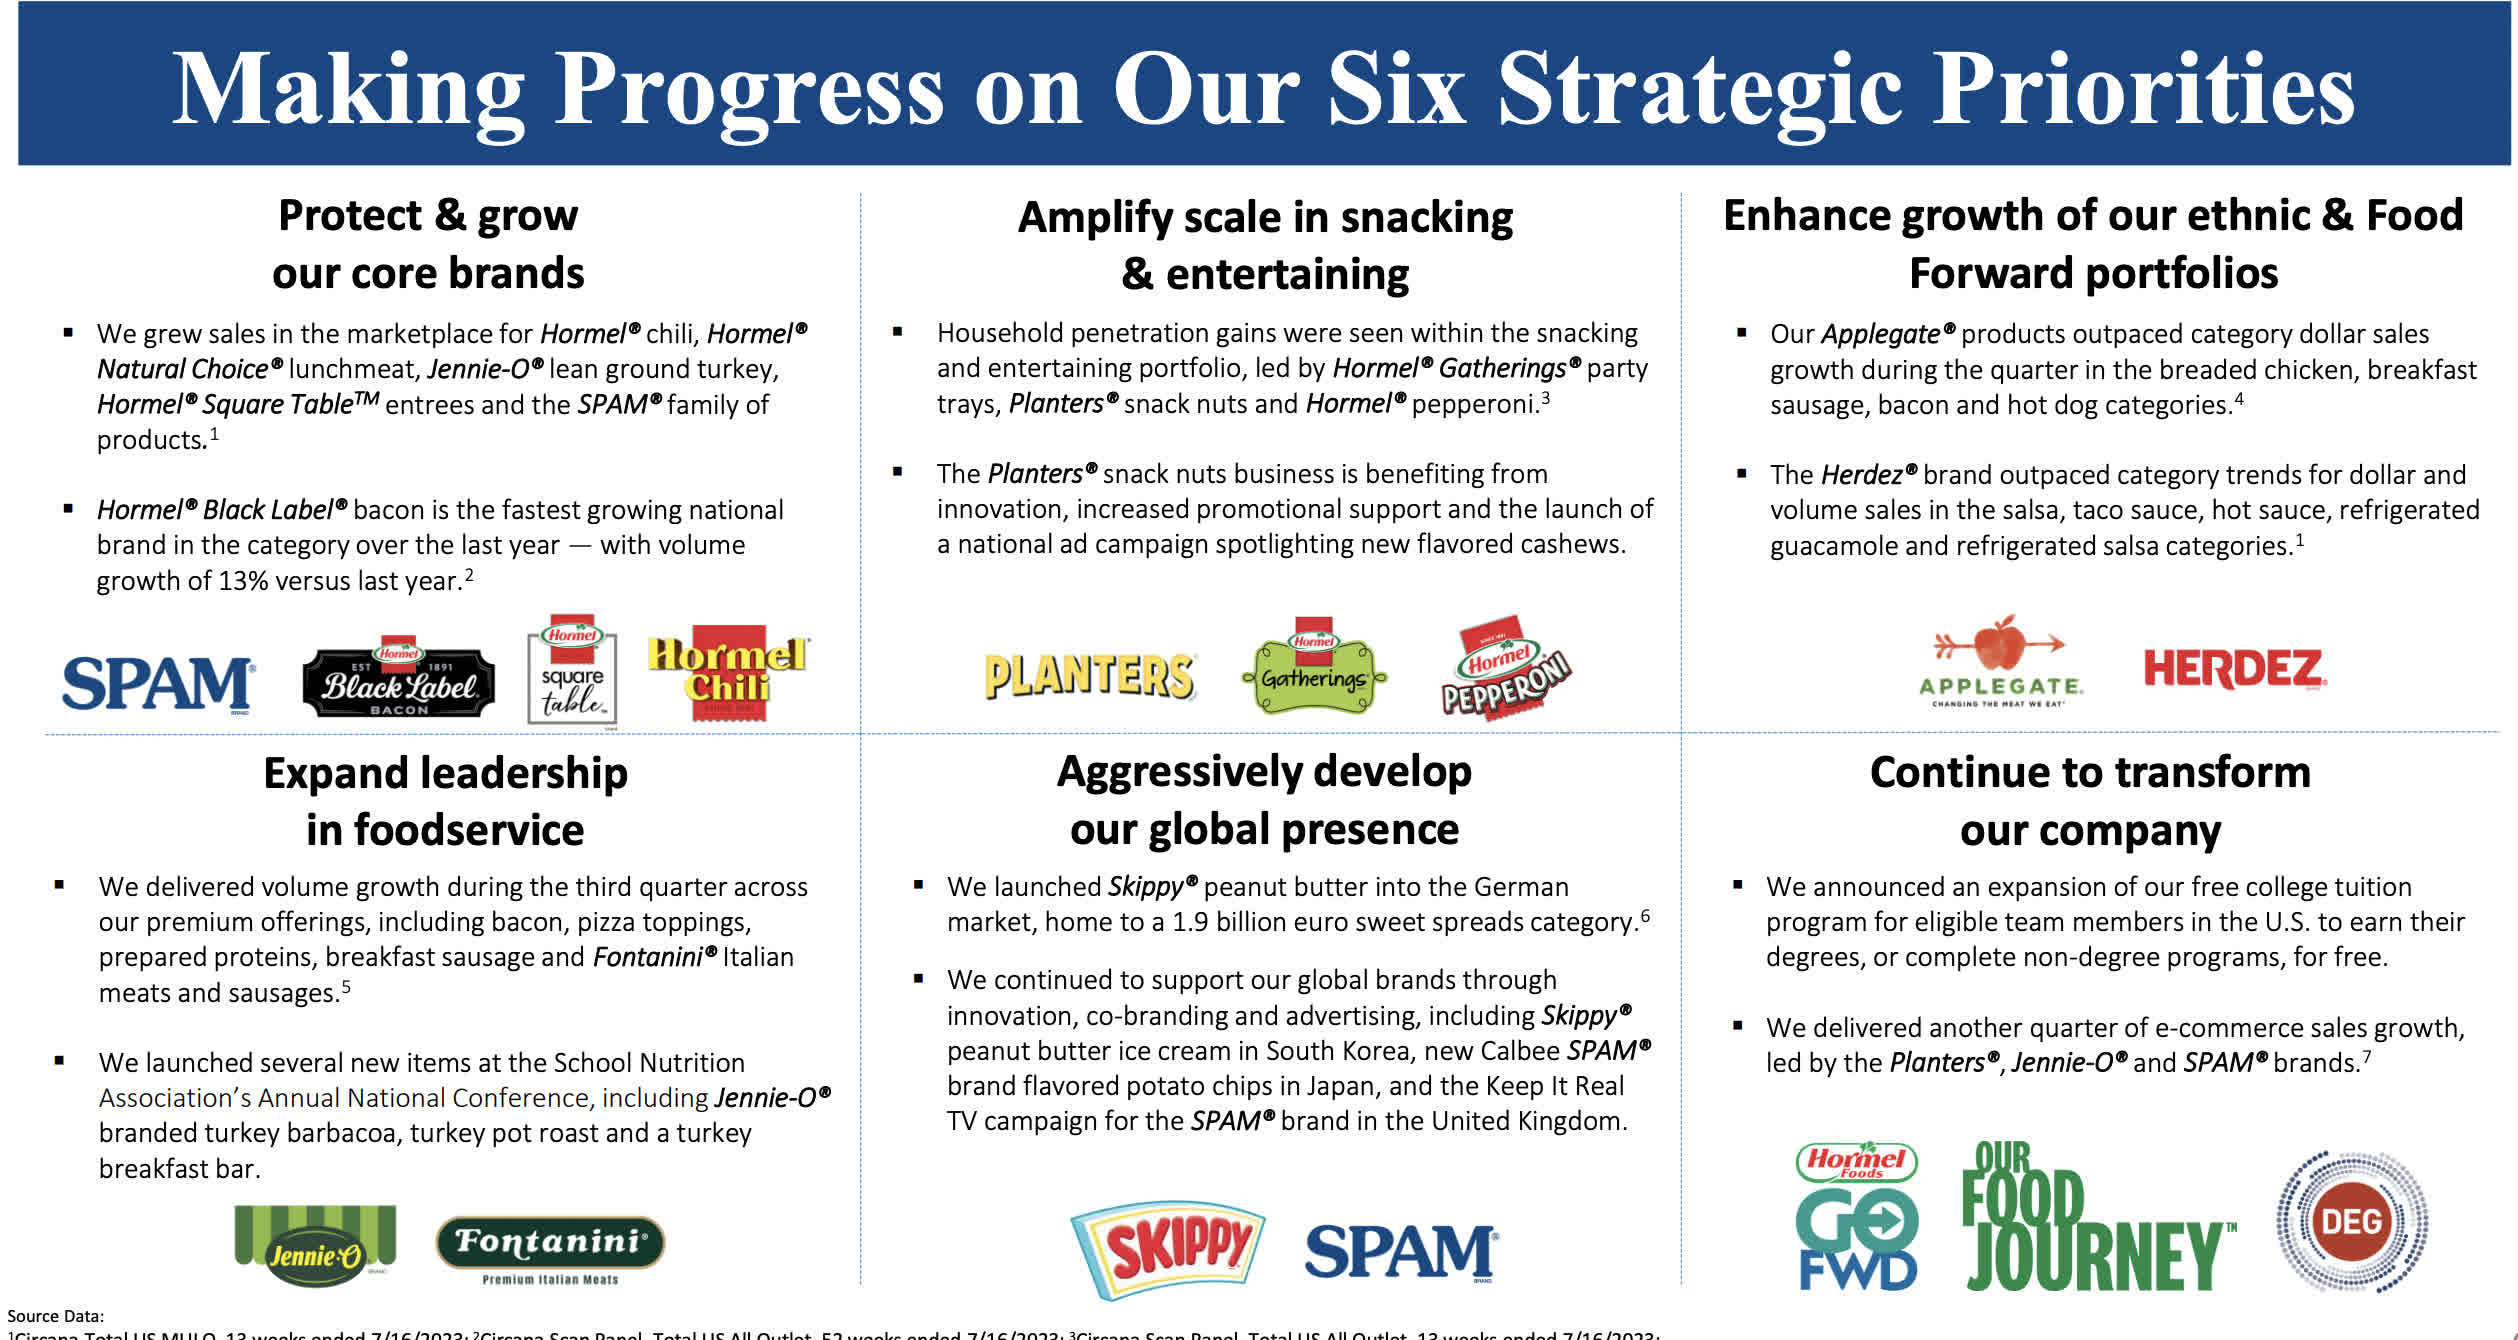
Skippy and Spam are the global focus for brand expansion with new unique products being introduced to Japan and Korea. Domestically, the Black Label Bacon brand is the fastest-growing brand in the nation within this segment.
The company acquired Planters from Kraft Heinz ( KHC ), another favorite company of mine, in 2021. Will the full return to sports watching and live sporting events post-COVID, this acquisition would seem to be a wise one with shipments of the Planters products up year over year.
As noted on the call, the company is executing on lowering finished goods and improving adjusted operating margins.
Hormel 2022 10K
Looking 4th quarter 2022 reported segment profits, we can estimate the most profitable parts of the business. Total quarter sales were $3.28 Billion.
Revenue division:
- Grocery products- 28%
- Refrigerated Foods- 53%
- Jeanie-O Turkey Store- 11.9%
- International and other- 6%
Profit division:
- Grocery products-27%
- Refrigerated Foods-44.5%
- Jeanie-O Turkey Store- 20%
- International and other- 8%
From a brief look comparing revenue make-up to profit makeup, only international and other and the Jeanie-O Turkey Store make up a larger proportion of profit versus revenue.
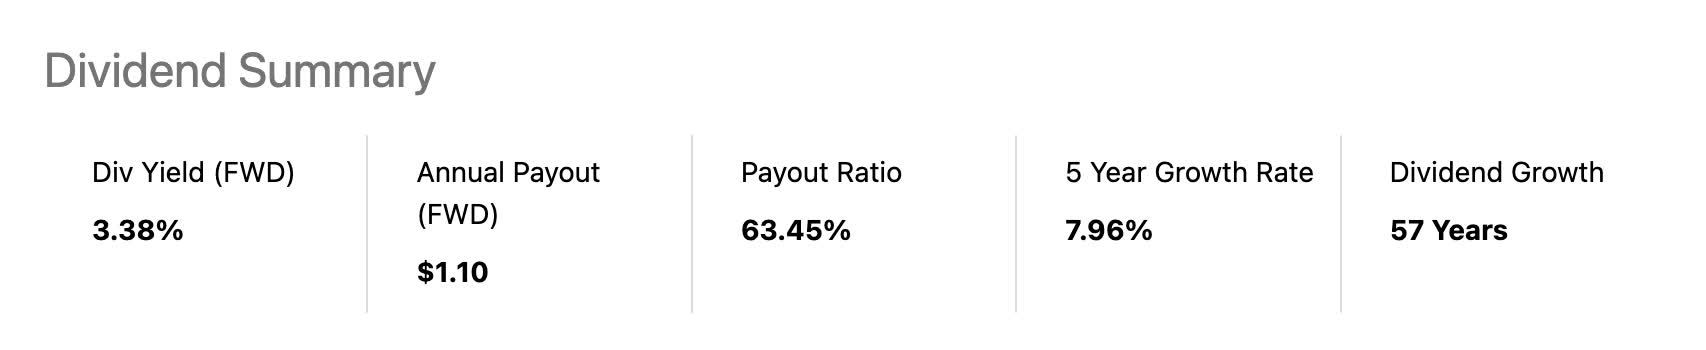
Decade high dividend
What more can you say. In most of these dividend king and aristocrat analysis you see an equivalent spike in yield during the Covid crash. Not here. This is an outlier on my list that stayed resilient even during the darkest days of the market in 2020. Only now due to inventory glut, an increasing risk free rate and some earnings misses do we catch the decade high yield level.
FCF growth trend line
Free cash flow grows at a faster clip than revenue. This is also a typical trait of slow-moving aristocrats and kings. They have higher depreciation and amortization than needed forward CAPEX. This is the benefit of an established brand.
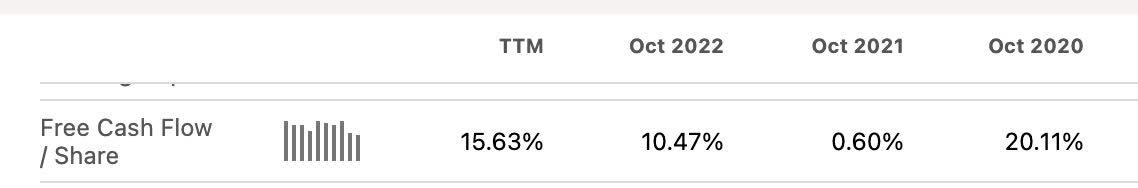
FCF a share to FWD Dividend payout
- FCF/share TTM : $1.54
- FWD Dividend :$1.10
- Payout ratio of FCF TTM : 71 %
- Forward projections of Free Cash Flow growth average at 10.35 %. Trending at 15.63% TTM.
Being that the company has projected some current and forward revisions that were softer than what Wall Street was looking for, we will use the conservative 3-year free cash flow growth average versus TTM trend at 10.35% growth versus 15.63% growth.
With that in consideration, next year's free cash flow per share could be as high as $1.7 a share. This would indicate a payout ratio in the range of 64% conservatively. Growth rates in earnings and revenue are not always indicative for free cash flow growth depending on what levers they pull.
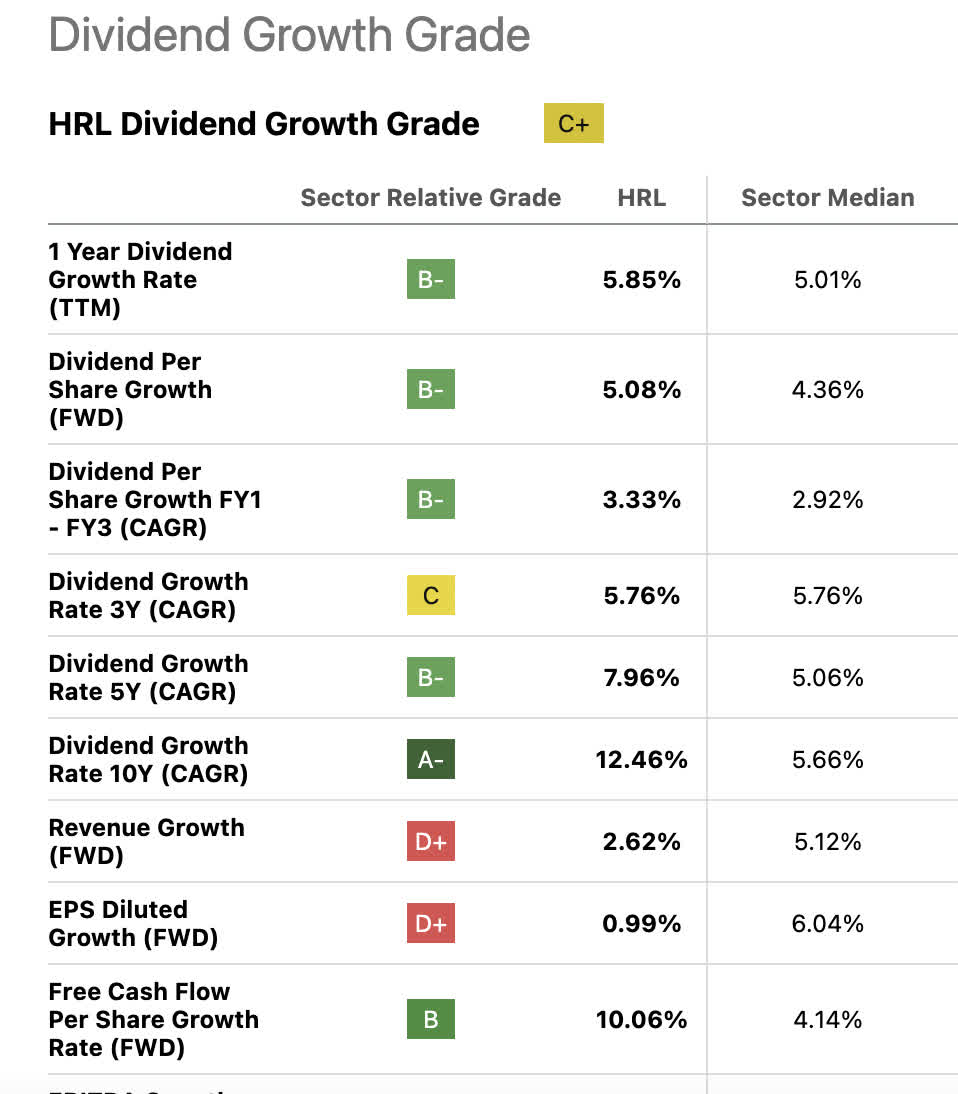
Dividend growth rate scores
Although Hormel Food Corporation has a low expected growth rate in earnings and revenue for next year, the trailing 3, 5, and 10 year CAGR in dividend growth rates are excellent. As the growth rates increase as you go up the ladder in holding periods, this is one of those stocks where the longer you hold it the better.
Yield on cost demonstrations
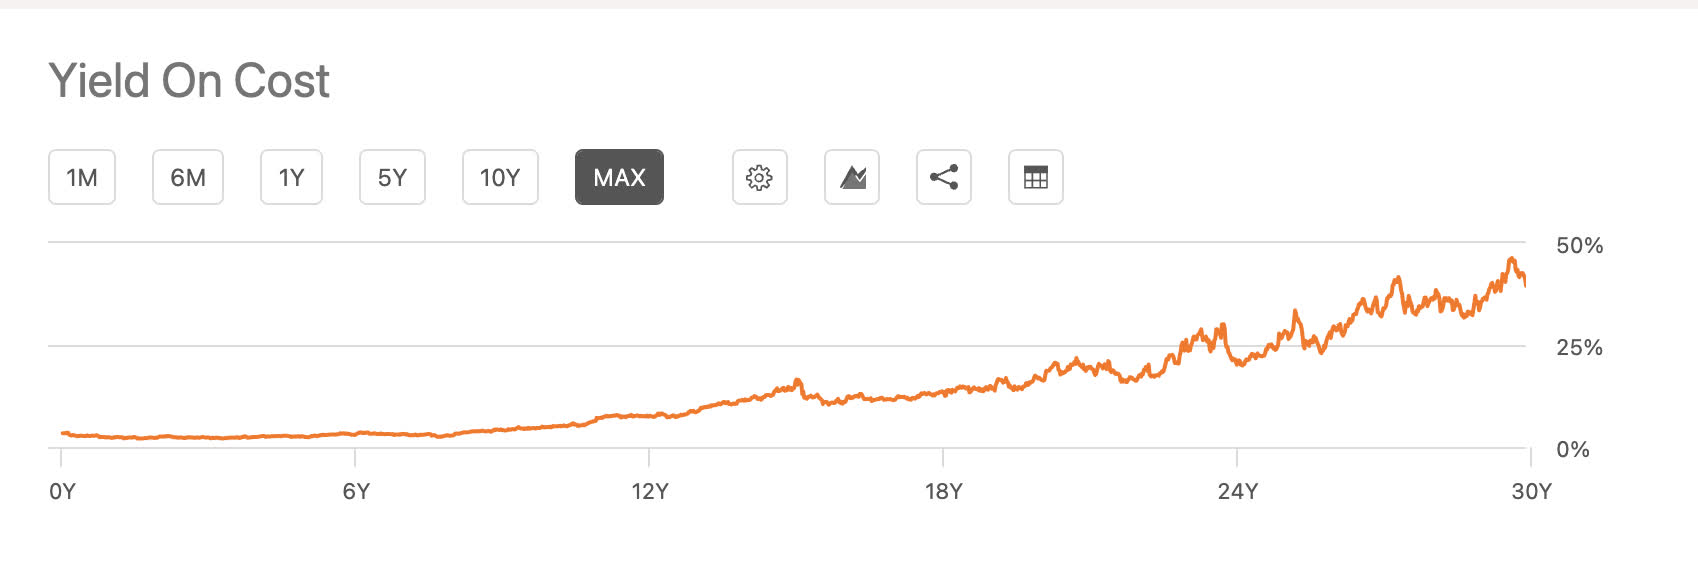
For dividend kings and aristocrats, it's always nice to remember that the longer you hold them, the higher your yield on cost becomes. The 30-year chart for really long-term holders of Hormel Food Corporation now shows a yield on cost in the high 40% range. That's how compound interest works and the reason why time in the market > timing the market. Buy right and hold on.
Forward assumptions
Looking at the 10-year average growth rate in EPS, we can assume a reasonable forward growth rate of 5.6% per annum. That will be our capital appreciation assumption in the forward-decade total return model. The starting yield for the stock is a decade-high at 3.38%. We will also use the 5-year dividend CAGR of 7.96% as our dividend growth rate.
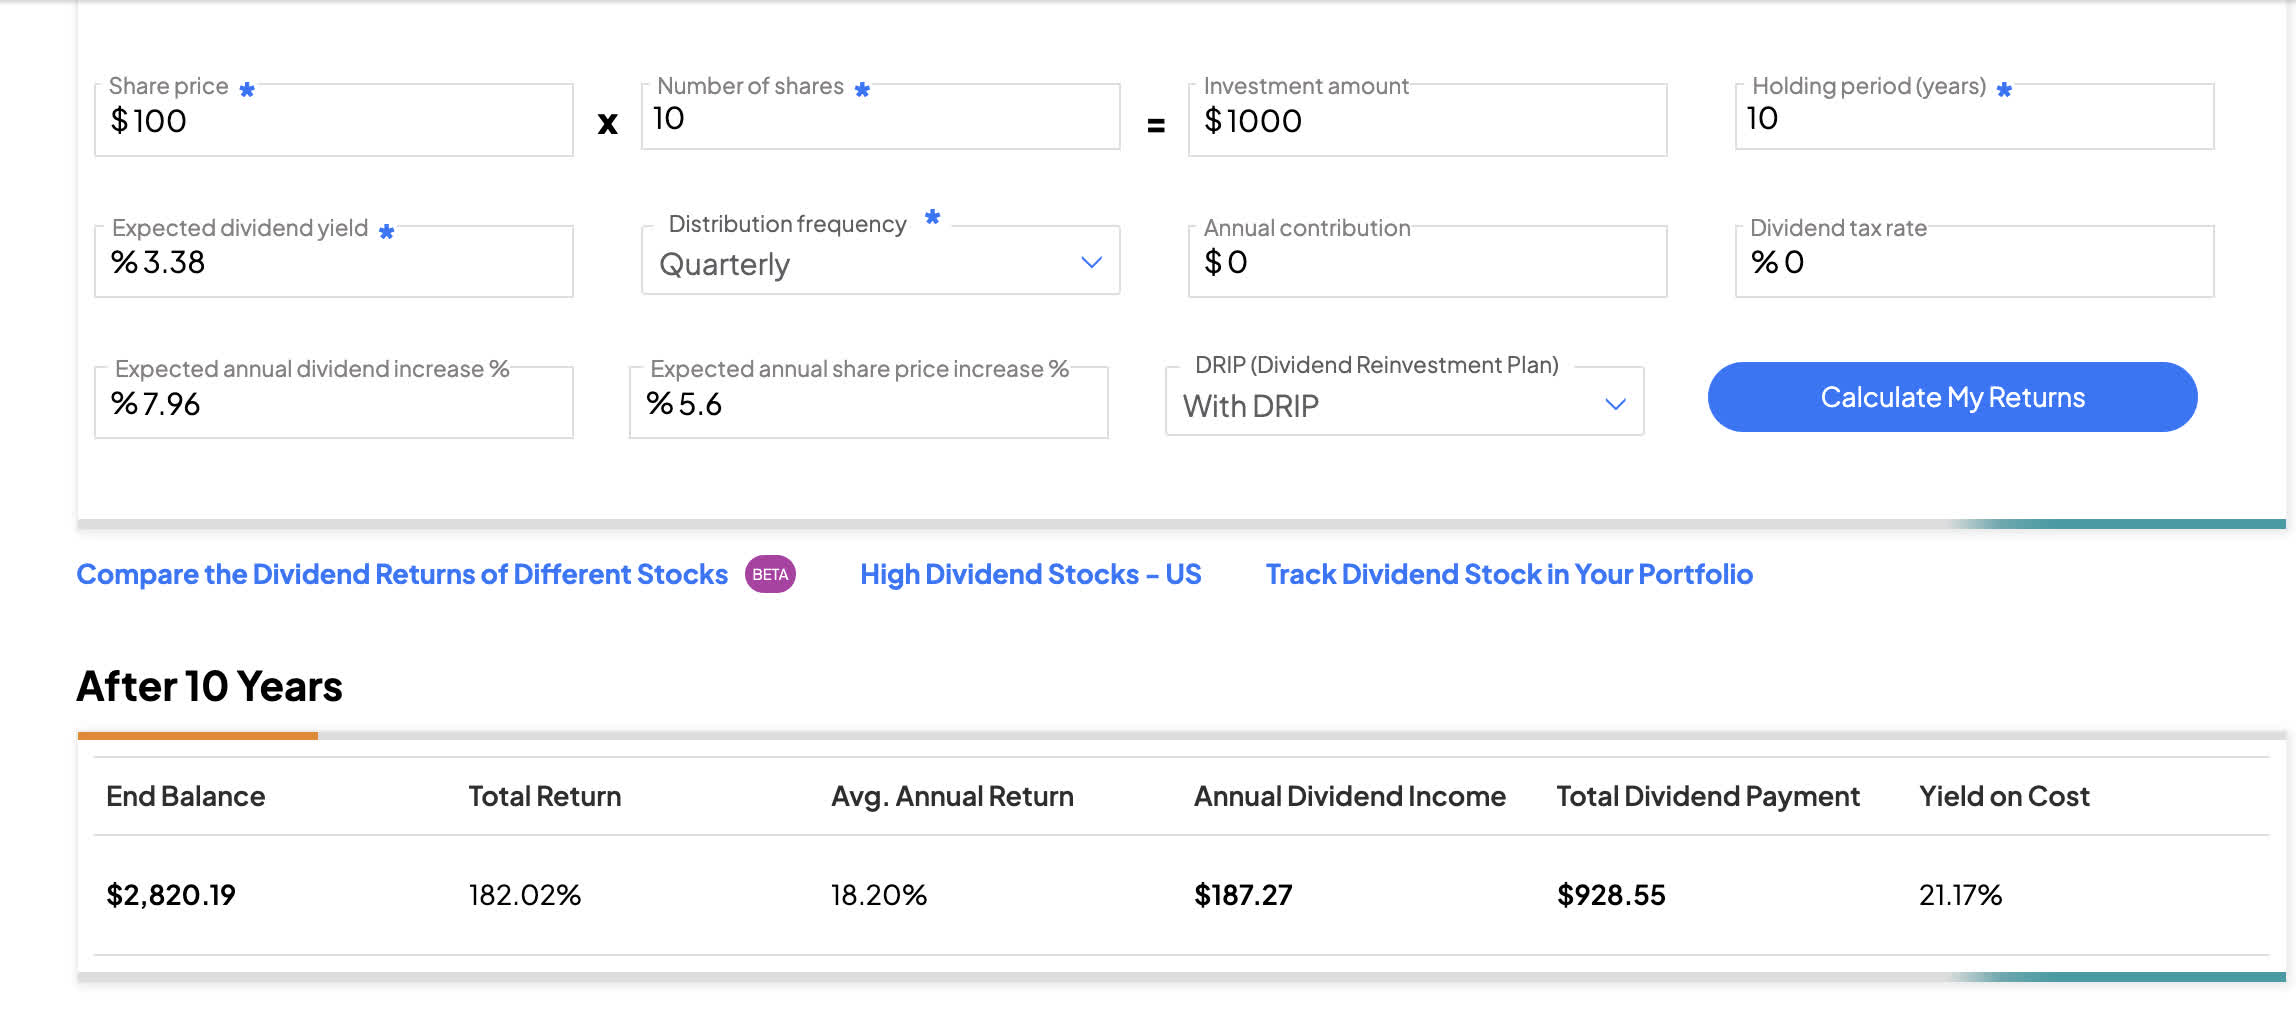
With these factors in mind, the forward assumptions are that an 182% total return with an 18.2% average annual return during the next decade is well within the cards. This is right around the 200% total return that index funds have given us in the previous decade's run-up. If you believe stagflation is in the cards, the return on decade-high-yielding aristocrats and kings could edge the market in the decade to come.
While the above is not world-beating, the model is trying to be as conservative as possible and these types of stocks are a great hedge if growth is slower than normal due to elevated interest rates and inflation.
Valuation
This a stable consumer staple. In these cases I use the Owner Earnings Discount model popularized in Robert Hagstrom's popular books on Warren Buffett. In essence, net income + depreciation and amortization minus capital expenditures. Discounted at the risk free rate. This is typically only used in stabilized businesses where depreciation and amortization are more or less equal to on-going Capital Expenditures.
All numbers TTM courtesy of Seeking Alpha in millions
- TTM Net income : $874 million
- + TTM depreciation and amortization of $287.6 million
- - TTM Capital Expenditures of $258.3 million
- Equals owner earnings of $903 million
- Discounted at the short risk free rate of 5.5%= $16.42 Billion fair market cap
- Divided by shares outstanding TTM [546 million] = $16,423/546= $30 a share
$33 is my estimated intrinsic value once the EPS growth rate returns to average [10%], this would be for a normal non-dividend king. The kings and aristocrats demand a market premium for their ability to return capital to shareholders consistently. While this falls below a normal 15-20% discount to intrinsic value that we would like to see, the advent of upcoming rate cuts next year may put a floor under the stock right here.
Balance sheet
Decent balance sheet. Total current assets are slightly above long-term debt. Cash and cash equivalents are just under the Billion mark. Free cash flow per annum trends right around $1 Billion. Thus debt could be extinguished with around 4 years of free cash flow. 5 years or less is a good baseline for fiscal solvency.
Shares outstanding have increased 3.63% over the last decade which is one negative mark on the company. The spike-up occurred around Covid and has now leveled off. This has certainly dinged the share price, but current forward trends look more positive to start share reduction once again.
As we can see, the company's historical trend is to buyback shares as a part of the return of capital to investors. It's in the company pedigree and should return to normalcy.
Upcoming earnings preview 11/29
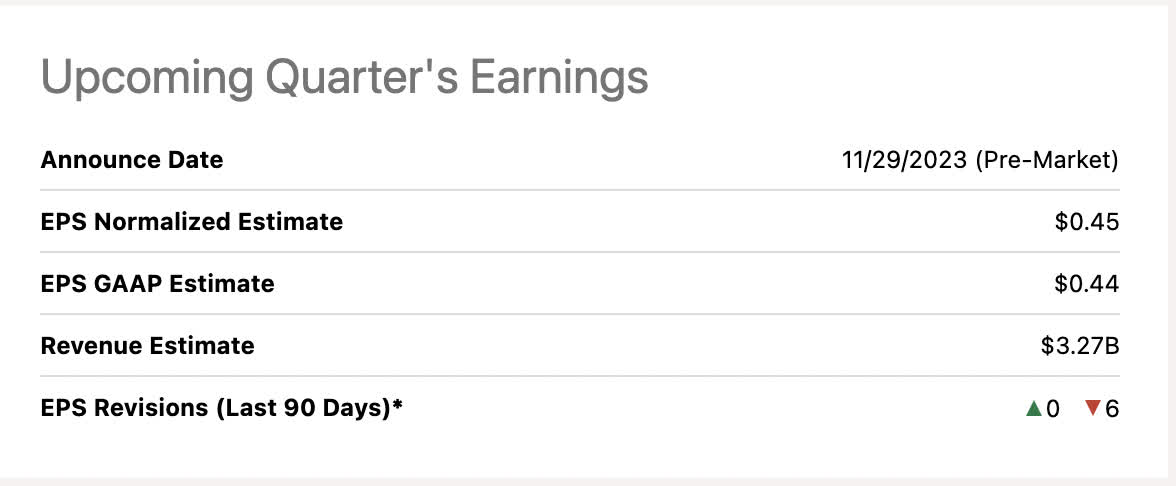
Analysts are expecting a bump to revenue over the previous quarter at $3.27 Billion versus a top-line miss last quarter under $3 Billion. We've had 6 negative revisions in the last 90 days, also creating downward pressure in the stock.
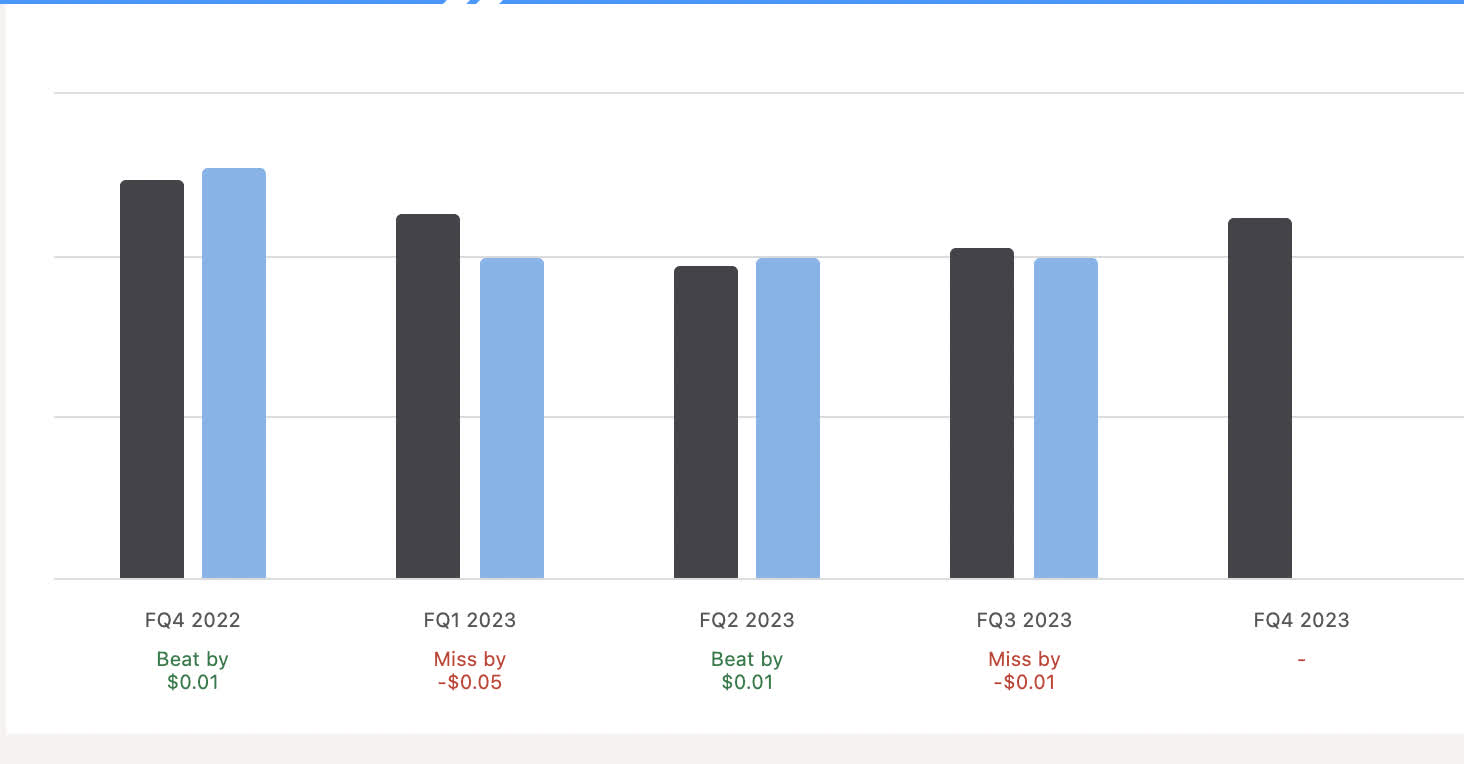
Dating back to Q4 of last year, Hormel has had a pattern of a beat and then a miss. If the pattern repeats, this seems to be a beat quarter. While this quarter will not contain the Thanksgiving sales, we are now in full NFL, college football and MLB baseball mode with Sunday breakfast staples and nut products being consumed more regularly.
Hints From Q3 earnings call
- Momentum continues to build in our snack nuts business as we benefit from regained distribution, investments in innovation and effective promotional support.
- We expect our highest operating margins of the year in the fourth quarter aided by a seasonally strong sales mix and savings from a series of projects aimed at reducing costs and complexity throughout our system.
In essence, Q3 led us to believe that an inventory glut of finished goods was the primary culprit to weak earnings. Gluts oftentimes have to be sold at discounts to decrease inventory. Q4, as Chairman Jim Snee points out, is expected to have the highest operating margins of the year. From an American standpoint, the primary market, part of the holiday season, Baseball playoffs and NFL football should be squarely within this quarter. Colder weather, more hot meals and snack foods. Looks like a good chance to be a good quarter.
Headwinds and risks
The company is working to reduce its finished product inventory. The unexpected glut could either be a management miscalculation or a demand issue. Hormel's products are on the cheaper end of the spectrum. Recent guidance from Walmart ( WMT ) about their consumers, the very consumers that partake in Hormel goods, is not encouraging. Consumers are making tradeoffs in purchases, but food-based staples should not be one of the items compromised. If consumers are just pinched in general and also are going to begin purchasing less food overall, the entire sector will remain depressed.
Conclusion
Whatever negative revisions the company has upcoming, they do not phase me in the long run. I've been collecting dividend growers and income proxies here while the short end of the risk-free curve has been its highest in my investing lifetime. Again, I want a growing versus static yield. I don't play with long-dated Treasuries or corporate bonds, just too much opportunity risk in my opinion unless the yield is significantly higher.
The consensus analyst estimates have now switched from higher for longer with additional periodic FED raises, to cuts starting early next year. Not to put my full faith in institutional analysts, but my premise has always been that the U.S. Government interest payments are now becoming unsustainable. When we last had rates this high, congress used to aim for balanced budgets as much as possible. Now we shoot for higher and higher deficits. Raising taxes will get you creamed in an election. As our elected officials have now entered the highest tax brackets themselves, they may be more concerned about their own bottom lines.
I have a buy rating on Hormel Food Corporation. One of my list of fairly valued dividend Kings and Aristocrats at decade-high covered dividend yields.
For further details see:
Hormel Foods Corporation: Thankful For 57 Years Of Growing Dividends