SBUX - How To Allocate $20000 Among 10 Dividend Income And Growth Stocks And ETFs
Summary
- The investment portfolio I have built for you in this article consists of 2 ETFs and 8 companies which I consider to be attractive in terms of risk and reward.
- I have built this investment portfolio in a way that gives you a Weighted Average Dividend Yield [TTM] of 3.04%.
- At the same time, the picks have shown a Weighted Average Dividend Growth Rate of 9.60% over the past 5 years, indicating that you can expect significant Dividend Growth.
Investment Thesis
When building an investment portfolio, there are many different factors that you need to keep in mind: in my opinion, one of the most important goals you should aim for when building an investment portfolio with a long-investment-horizon is to reach an attractive combination between a relatively high Dividend Yield (which helps you earn an additional extra income) and a relatively high Dividend Growth Rate (which will help this extra income to increase each year).
In today’s article, I will show you how you could reach this goal by allocating $20,000 among 2 ETFs and 8 companies. Each of these picks provides you with Dividend Income and Dividend Growth and I consider them all to be attractive in terms of risk and reward.
Before I show you the ETFs and companies I have selected, I would like to remind you that I aim to achieve a balance in regards to the following factors when I build an investment portfolio. I call these factors, which I will present in the following, the pillars of my investment approach :
- Relatively high Average Dividend Yield of the companies
- Relatively high Average Dividend Growth Rate
- Attractiveness in terms of risk and reward
- Companies with strong competitive advantages that provide an economic moat
- Companies with strong financials
- Companies with a relatively high brand value
- Consumer familiarity with the products of these companies
- Attractive Valuation of the companies
- Aiming to achieve a relatively high Yield on Cost when having a long investment horizon
- Risk diversification across sectors and industries
Here are the companies/ETFs I have selected for you:
- DVY iShares Select Dividend ETF (NASDAQ: DVY )
- Schwab Strategic Trust - Schwab U.S. Dividend Equity ETF (NYSEARCA: SCHD )
- Apple (NASDAQ: AAPL )
- Mastercard (NYSE: MA )
- Realty Income (NYSE: O )
- Axa ( AXAHY )
- British American Tobacco (NYSE: BTI )
- Coca-Cola (NYSE: KO )
- McDonald's (NYSE: MCD )
- Itaú Unibanco (NYSE: ITUB )
When considering which positions to overweight in an investment portfolio, the identification of risk and reward plays a key role. I would overweight the companies that I consider to be particularly attractive in terms of risk and reward.
Due to their broad diversification, which implies a lower level of risk for investors, I would put the following two ETFs at the core of the portfolio: DVY and SCHD are two ETFs that I consider to be particularly appealing for investors, since they both combine Dividend Income and Dividend Growth. This makes them attractive choices for both dividend income and dividend growth investors. Allocating $5000 for each of these ETFs implies that, when combined, they would make up 50% of this investment portfolio.
By having these ETFs as the basis of your investment portfolio, you achieve a broad risk diversification among industries and sectors. This gives you the opportunity to focus on the companies you are more familiar with when selecting additional companies for your portfolio.
When considering risk and reward, some of the companies mentioned above are even more attractive than the others I have selected. For these reasons, I would slightly overweight Apple, Mastercard and Realty Income out of those that I have selected for this portfolio.
Companies such as Axa, British American Tobacco and McDonald’s provide you with an attractive Dividend Yield and some Dividend Growth. However, I consider them to have lower growth prospects than the companies mentioned before (Apple, Mastercard, Realty Income). Therefore, I would slightly underweight these companies in this portfolio.
The smallest position of this portfolio is the Brazilian bank Itaú Unibanco (besides Coca-Cola): I would underweight it in particular because of the macroeconomic and currency risks that come attached to an investment in this bank.
Below you can find an overview of the selected ETFs and companies. From the allocation shown in the table below, you would achieve a Weighted Average Dividend Yield [TTM] of 3.04% and a Weighted Average Dividend Growth Rate of 9.60% (over the past 5 years).
Overview of the selected Companies/ETFs
| Company |
| Sector |
| Industry |
| Country |
| Dividend Yield [TTM] |
| 5 Year Average Dividend Growth |
| Amount |
| Percentage of the total portfolio |
| Apple |
| Information Technology |
| Technology Hardware, Storage and Peripherals |
| U.S. |
| 0.62% |
| 8.15% |
| $2000 |
| 10% |
| Axa |
| Financials |
| Multi-line Insurance |
| FRA |
| 5.21% |
| 5.34% |
| $1000 |
| 5% |
| Itaú Unibanco |
| Financials |
| Diversified Banks |
| BRA |
| 0.81% |
| 18.19% |
| $500 |
| 2.5% |
| British American Tobacco |
| Consumer Staples |
| Tobacco |
| GBR |
| 7.22% |
| 4.94% |
| $1000 |
| 5% |
| Coca-Cola |
| Consumer Staples |
| Soft Drinks |
| U.S. |
| 2.91% |
| 3.62% |
| $500 |
| 2.5% |
| DVY iShares Select Dividend ETF |
| ETF |
| ETF |
| U.S. |
| 3.32% |
| 6.98% |
| $5000 |
| 25% |
| Mastercard |
| Information Technology |
| Data Processing and Outsourced Services |
| U.S. |
| 0.55% |
| 17.58% |
| $2000 |
| 10% |
| McDonald’s |
| Consumer Discretionary |
| Restaurants |
| U.S. |
| 2.08% |
| 7.98% |
| $1000 |
| 5% |
| Realty Income |
| Real Estate |
| Retail REITs |
| U.S. |
| 4.35% |
| 3.93% |
| $2000 |
| 10% |
| Schwab Strategic Trust - Schwab U.S. Dividend Equity ETF |
| ETF |
| ETF |
| U.S. |
| 3.35% |
| 13.74% |
| $5000 |
| 25% |
| Weighted Average |
| 3.04% |
| 9.60% |
| 100% |
Source: The Author, data from Seeking Alpha
DVY iShares Select Dividend ETF
From my point of view, the iShares Select Dividend ETF is an excellent base investment for this portfolio. A range of numbers underline my theory: The ETF currently has a Dividend Yield [TTM] of 3.32%, which is well above the Dividend Yield of the Median of all ETFs which is only 2.00%.
The iShares Select Dividend ETF has shown a Dividend Growth Rate of 6.92% [CAGR] over the last 10 years, which is 16.25% above the Median of all ETFs (5.95%), indicating that it should be a great pick for dividend growth investors.
As mentioned earlier, I would overweight this ETF because of its broad risk diversification and the attractive Dividend Yield and Dividend Growth that it can provide you with.
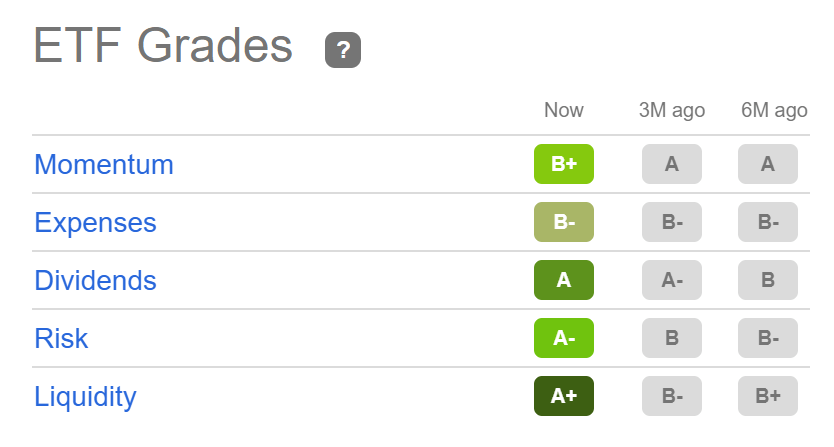
Below you can find the Seeking Alpha ETF Grades, which prove that this ETF is a top pick: for Liquidity, it is rated with an A+, for Dividends, an A and for Risk, it gets an A-. Only for Momentum (B+) and Expenses (B-), is the ETF rated slightly lower.
SCHD Schwab Strategic Trust - Schwab U.S. Dividend Equity ETF
SCHD is among my favorite ETFs, since it provides shareholders with an attractive Dividend Yield [TTM] of 3.35%, Dividend Growth (Dividend Growth Rate 3Y [CAGR] of 14.10%) and a broad risk diversification.
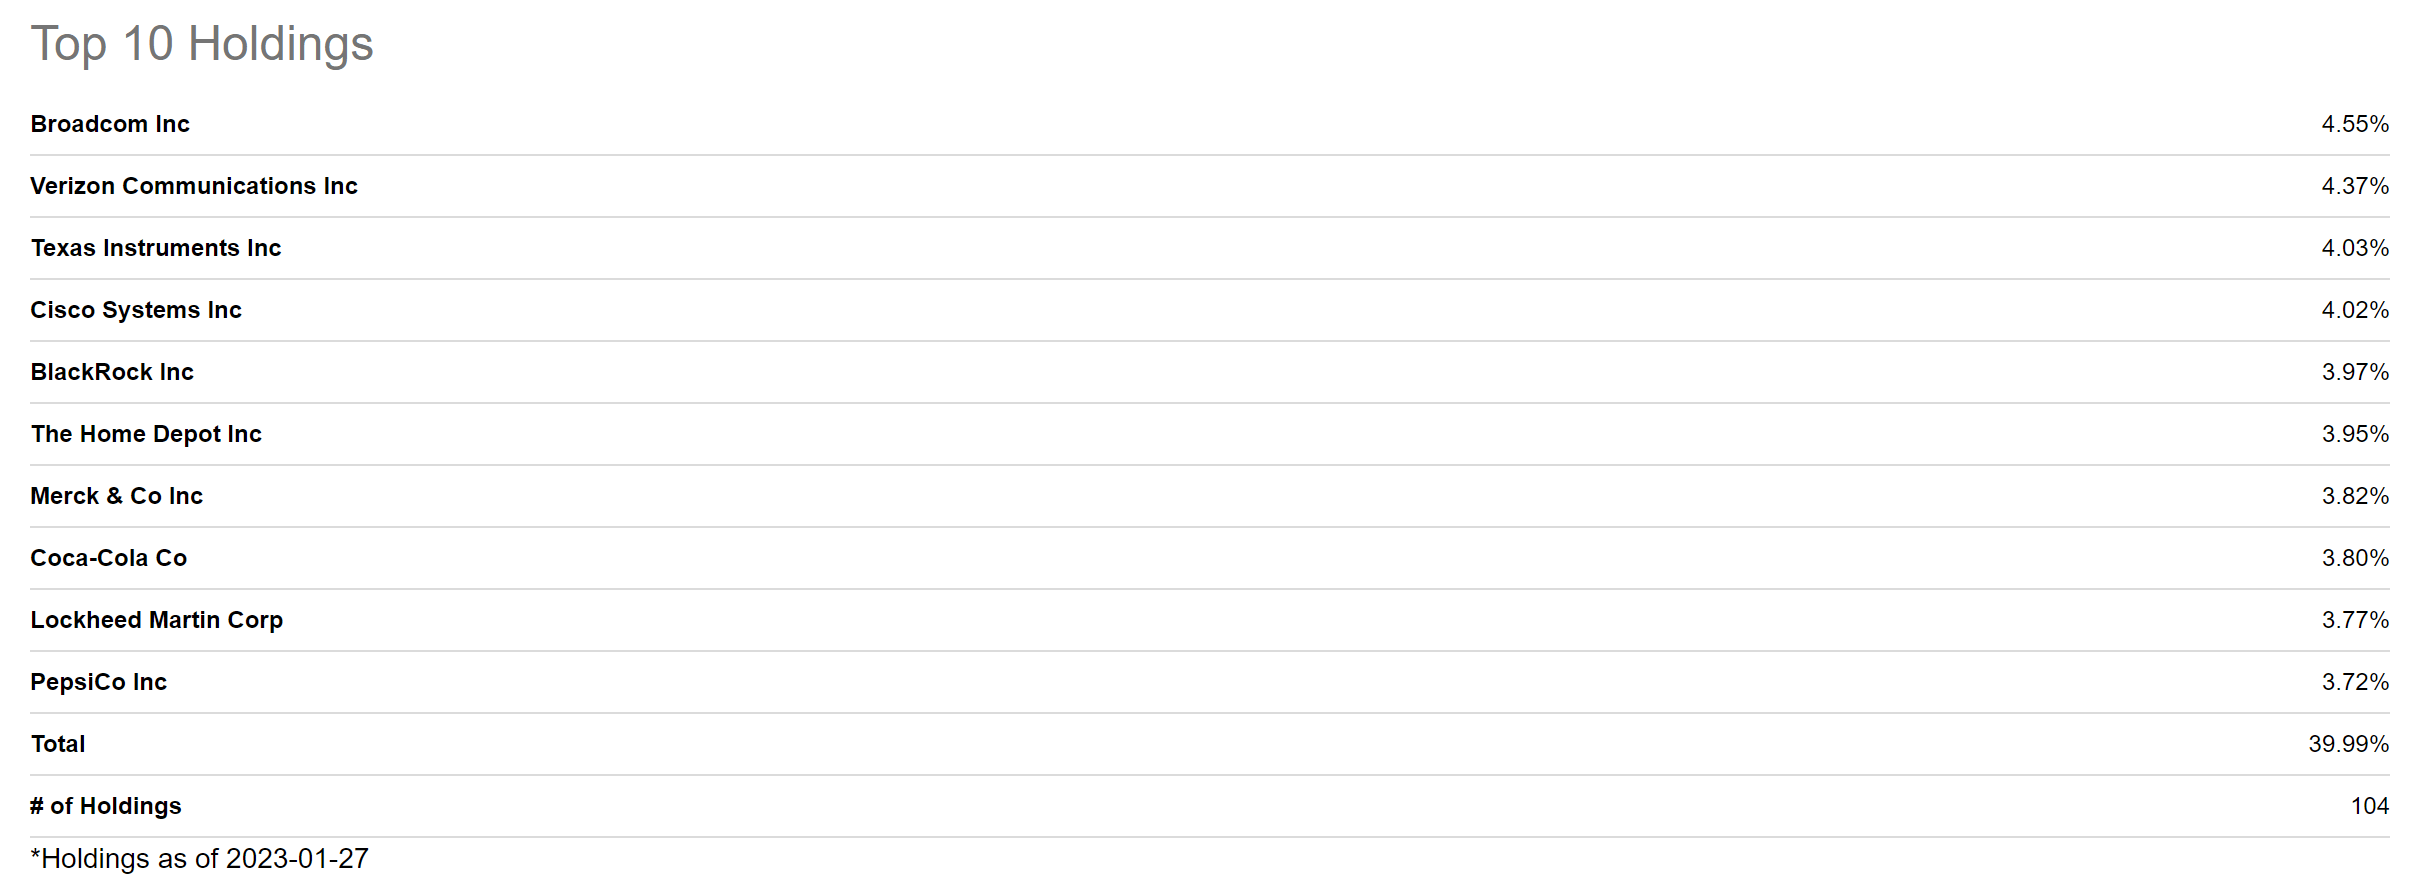
Below, you can find an overview of the Top 10 Holdings that are part of this ETF.
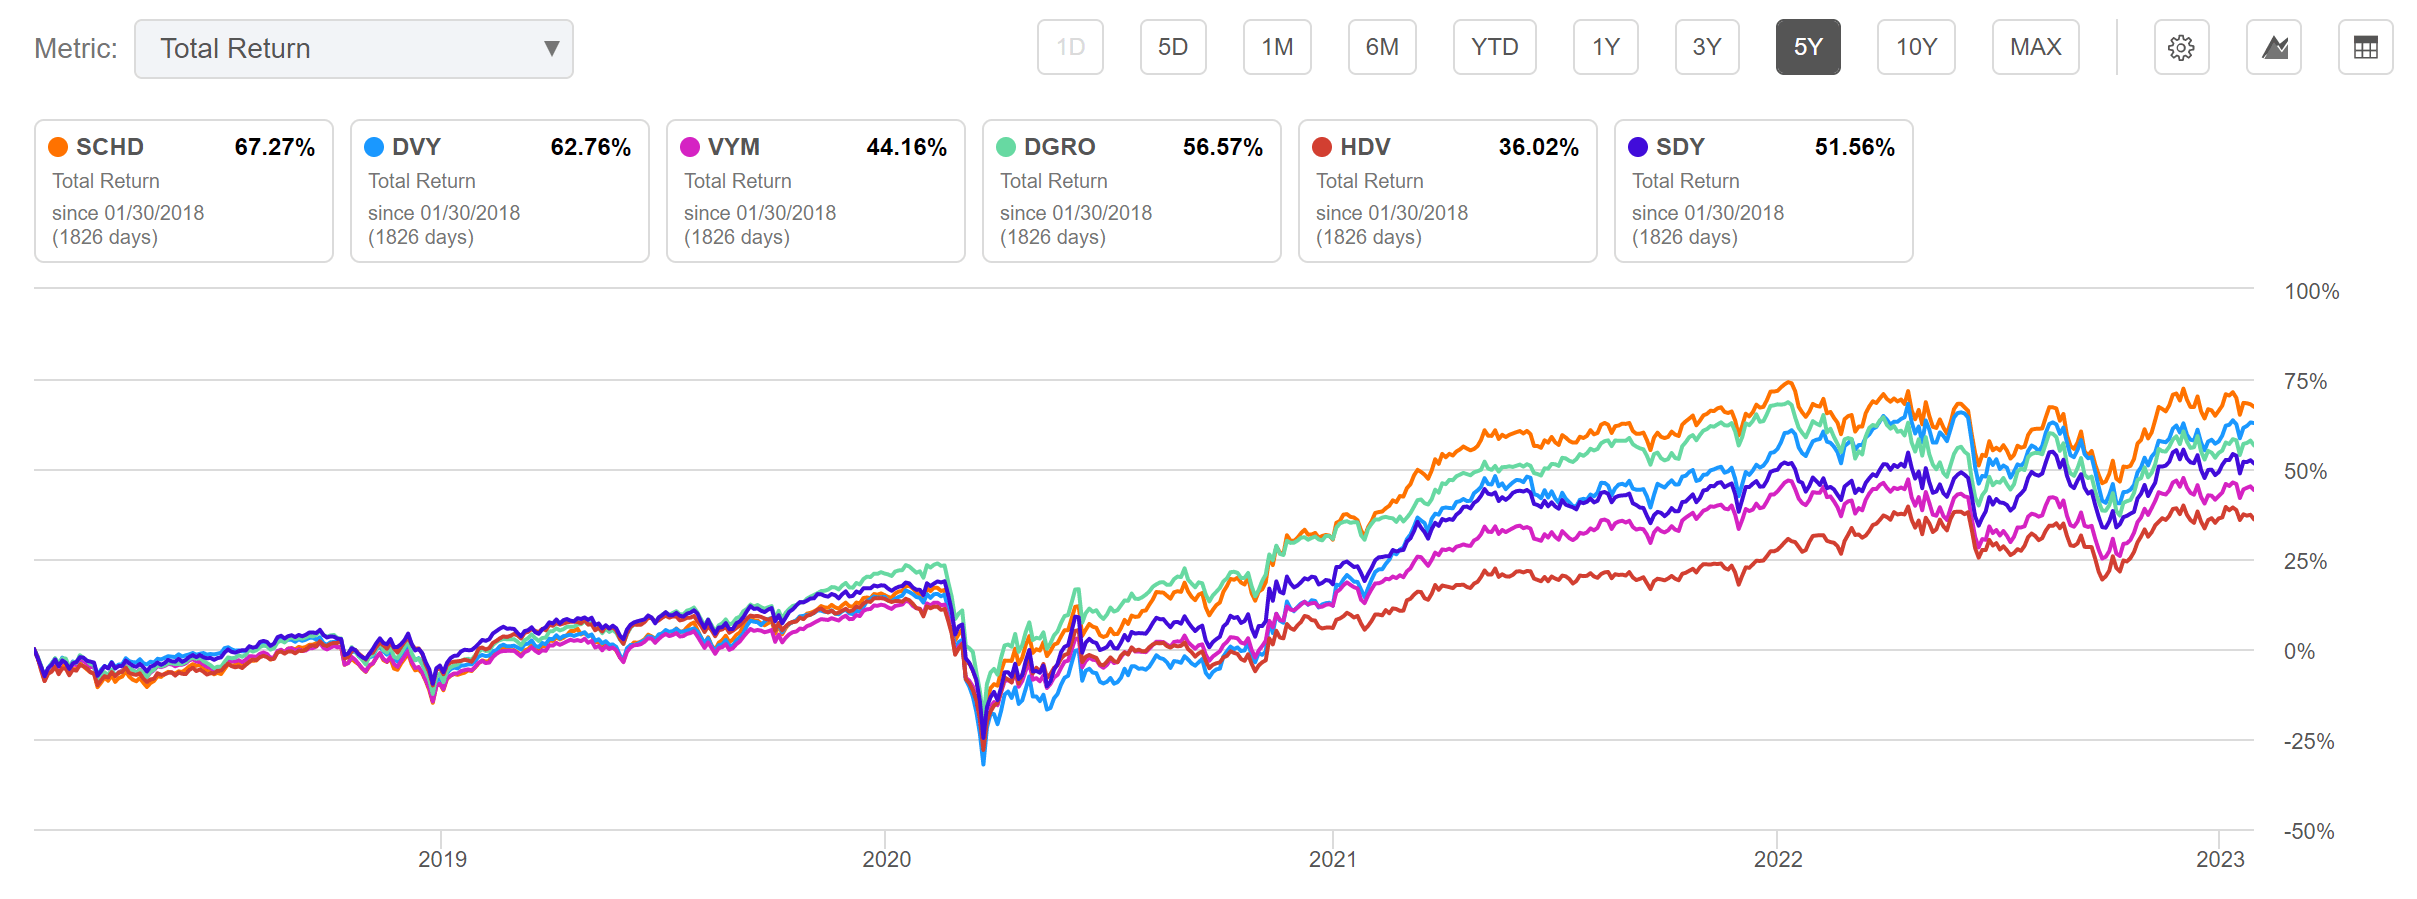
With a Total Return of 67.27%, the ETF has clearly outperformed its peers over a period of the past 5 years, such as the iShares Core Dividend Growth ETF (NYSEARCA: DGRO ) (Total Return of 56.57%), the Vanguard High Dividend Yield ETF (NYSEARCA: VYM ) (44.16%) or the iShares Core High Dividend ETF (NYSEARCA: HDV ) (36.02%). This strengthens my confidence that the ETF is an excellent pick for this portfolio.
Furthermore, SCHD has an attractive rating as according to the Seeking Alpha Quant Ranking: The ETF is ranked 19 th out of 97 in its Sub Class and 86 th out of 505 in its Asset Class.
Source: Seeking Alpha
Apple
In my opinion, Apple should always be part of any investment portfolio that is built with the objective of achieving Dividend Growth.
The company has strong competitive advantages, which are expressed by a wide variety of financial ratios: its Net Income Margin [TTM] of 25.31% is 685.48% above the Sector Median (3.22%). Furthermore, when taking a closer look at Apple’s EBIT Margin [TTM] of 30.29%, we can see that the company has been able to increase its margin over the past years. This is reflected by the fact its current EBIT Margin [TTM] is 12.38% higher than its average from the past 5 years (26.95%).
Apple’s rock solid Dividend is also shown when considering the company’s Seeking Alpha Dividend Grades: for Dividend Growth, Apple receives an A+ rating, which shows that the company’s Dividend Growth is very attractive when compared to its peer group. Apple gets an A- rating for Dividend Safety, which underlines its strong ability to pay its current dividend.
Mastercard
Mastercard is an excellent choice for this type of investment portfolio, because it can help to significantly raise the Average Dividend Growth Rate.
Mastercard has shown a Dividend Growth Rate 10Y [CAGR] of 32.75%, which is 267.20% above the Sector Median (8.92%). The company’s Dividend Growth Rate 5Y [CAGR] of 17.52% is 85.97% above the Sector Median (9.42%). Both Growth Rates heavily underline my investment thesis that Mastercard can significantly contribute to increasing the Average Dividend Growth Rate of your Portfolio.
Furthermore, the company has shown an EBIT Growth Rate [FWD] of 18.20%. This is 30.77% higher than the Sector Median (13.92%), providing evidence that it has been able to raise its profits at higher rates than its rivals.
Mastercard’s current P/E [FWD] Ratio of 30.79 is 18.33% below its Average P/E [FWD] Ratio over the last 5 years, which is 37.69. This suggests that Mastercard is undervalued at this moment in time.
I see Mastercard as being slightly ahead of its competitors Visa (NYSE: V ) and PayPal (NASDAQ: PYPL ) when it comes to Growth: the company has a Revenue Growth Rate [FWD] of 14.83%, while Visa’s is 14.13% and PayPal’s is 12.12%. The same is proven when having a closer look at the companies’ EPS Growth Rate Diluted [FWD]: while Mastercard’s is 20.12%, Visa’s is 17.76% and PayPal’s is 7.03%.
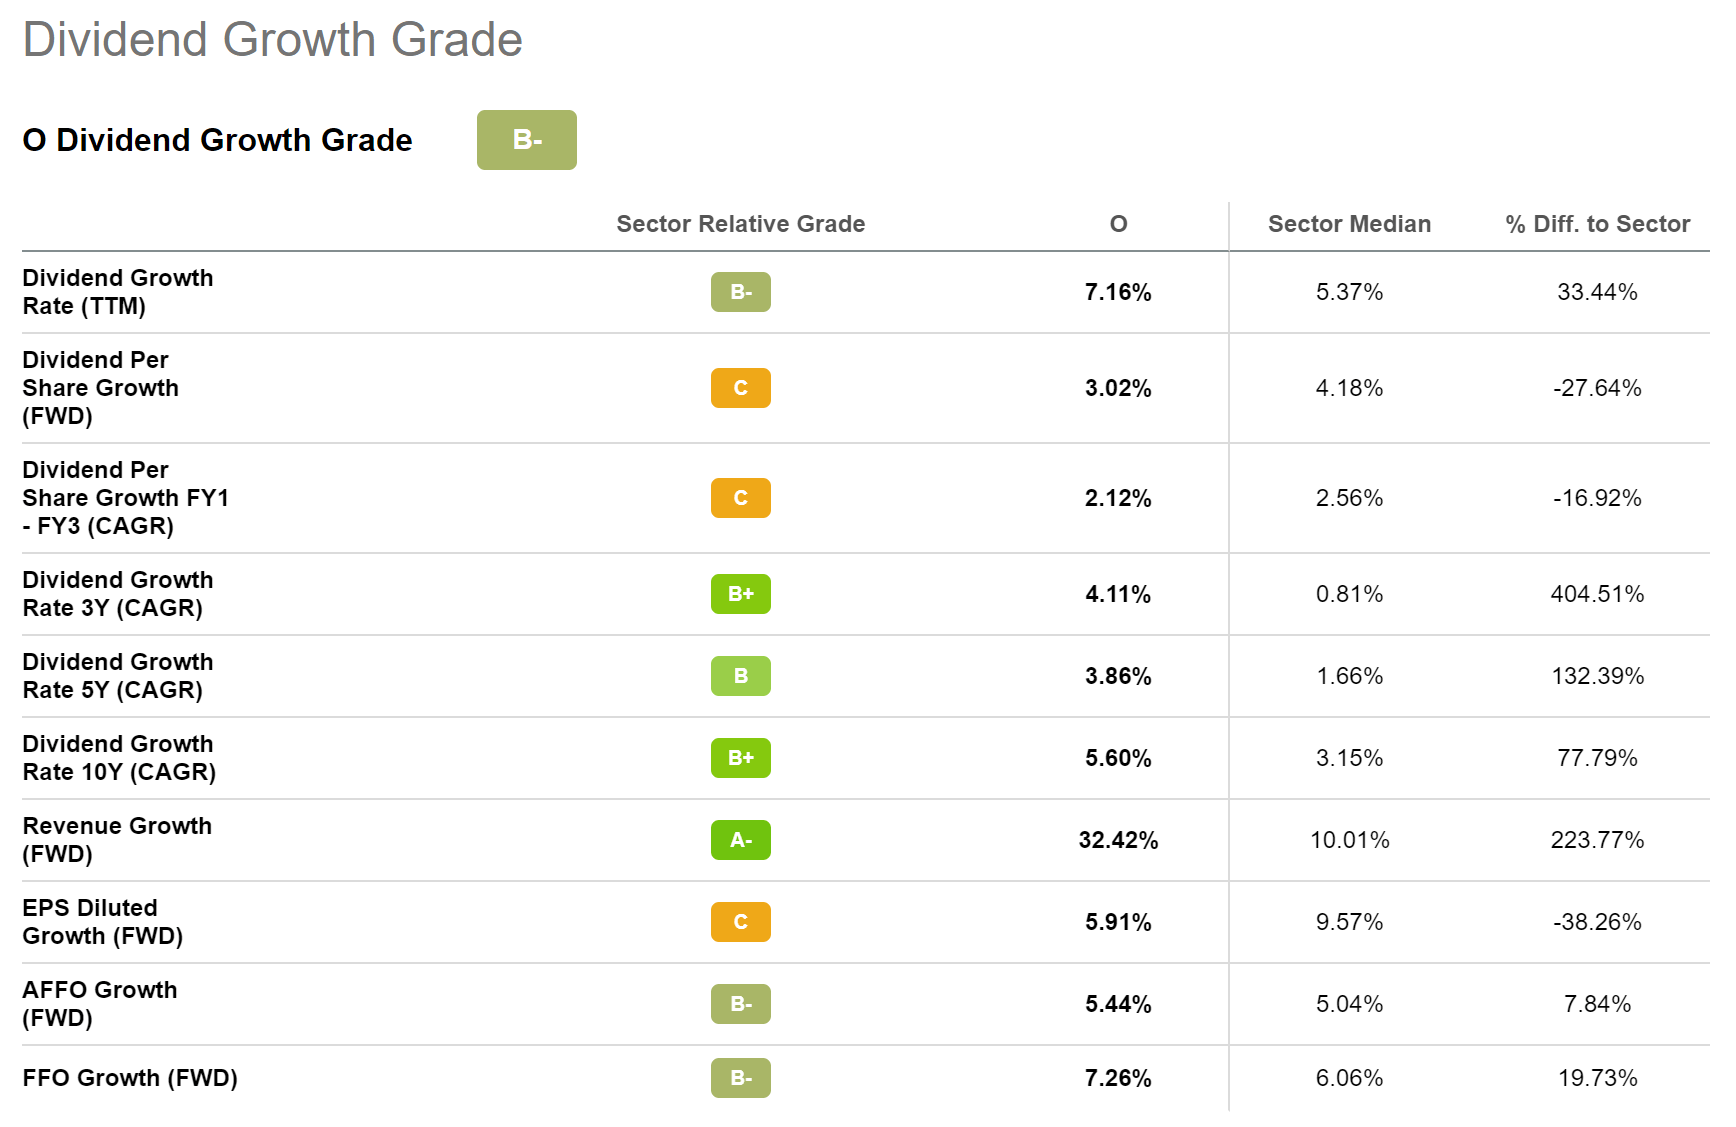
Realty Income
I consider Realty Income to be an excellent pick for any diversified investment portfolio. The reason for this is not only because of the company’s monthly dividend payments. Realty Income currently pays a Dividend Yield [FWD] of 4.37%. But what makes the company so attractive in my opinion is its combination of an attractive Dividend Yield and the Dividend Growth it provides its shareholders with: Realty Income has shown a Dividend Growth Rate [CAGR] of 5.60% over the past 10 years. This Growth Rate is 77.79% above the Sector Median (3.15%), providing evidence of Realty Income’s excellent competitive position and growth prospects. This excellent competitive position is further underlined by the company’s high EBIT Margin of 39.46%, which is 71.14% above the Sector Median (23.06%).
Realty Income’s EBIT Growth Rate [FWD] of 25.92% further underlines that the company is on track when considering Growth, since it is 77.63% above the Sector Median (14.59%).
I consider Realty Income to currently be fairly valued. My opinion is based on the company’s current P/E [FWD] Ratio of 31.36, which is just 2.20% higher than the Sector Median (30.68).
Below you can find the Seeking Alpha Dividend Growth Grade, which confirms that the company is particularly appealing for those investors seeking Dividend Income and Dividend Growth.
Axa
Several numbers demonstrate that the French company from the Multi-line Insurance Industry is a good fit for this portfolio that aims to achieve an attractive Dividend Yield as well as an attractive Dividend Growth Rate.
Axa pays its shareholders a Dividend Yield [FWD] of 5.21%, which is above that of competitors such as Allianz ( ALIZF ) (Dividend Yield [FWD] of 4.72%) or Zurich Insurance Group ( ZURVY ) (Dividend Yield [FWD] of 4.41%).
The company’s currently attractive Valuation is proven by its P/E GAAP [TTM] Ratio of 9.69, which is 11.97% below the Sector Median (11.01) and 32.18% lower than its 5 Year Average P/E GAAP [TTM] Ratio of 14.29. Both serve as indicators that Axa is undervalued at this moment of writing.
Furthermore, the company has a Return on Equity of 11.92%, which is slightly above the Sector Median (11.34%), indicating its relatively strong Profitability.
According to the Seeking Alpha Quant Rating, Axa is currently rated as a strong buy, which supports my own buy rating for the company.
The Seeking Alpha Factor Grades further strengthen my opinion that Axa should be part of this selection of Dividend Income and Dividend Growth companies and ETFs: it is rated with an A for Momentum, an A- for Revisions and a B+ for Valuation. For Profitability, Axa receives a B rating and for Growth, a C.
The Seeking Alpha Quant Ranking once again increases my confidence that Axa is an excellent pick right now: the company is ranked 2 nd out of 10 within the Multi-line Insurance Industry and 8 th out of 665 within the Financials Sector, providing strong evidence that it is well positioned when compared to its peer group.
Source: Seeking Alpha
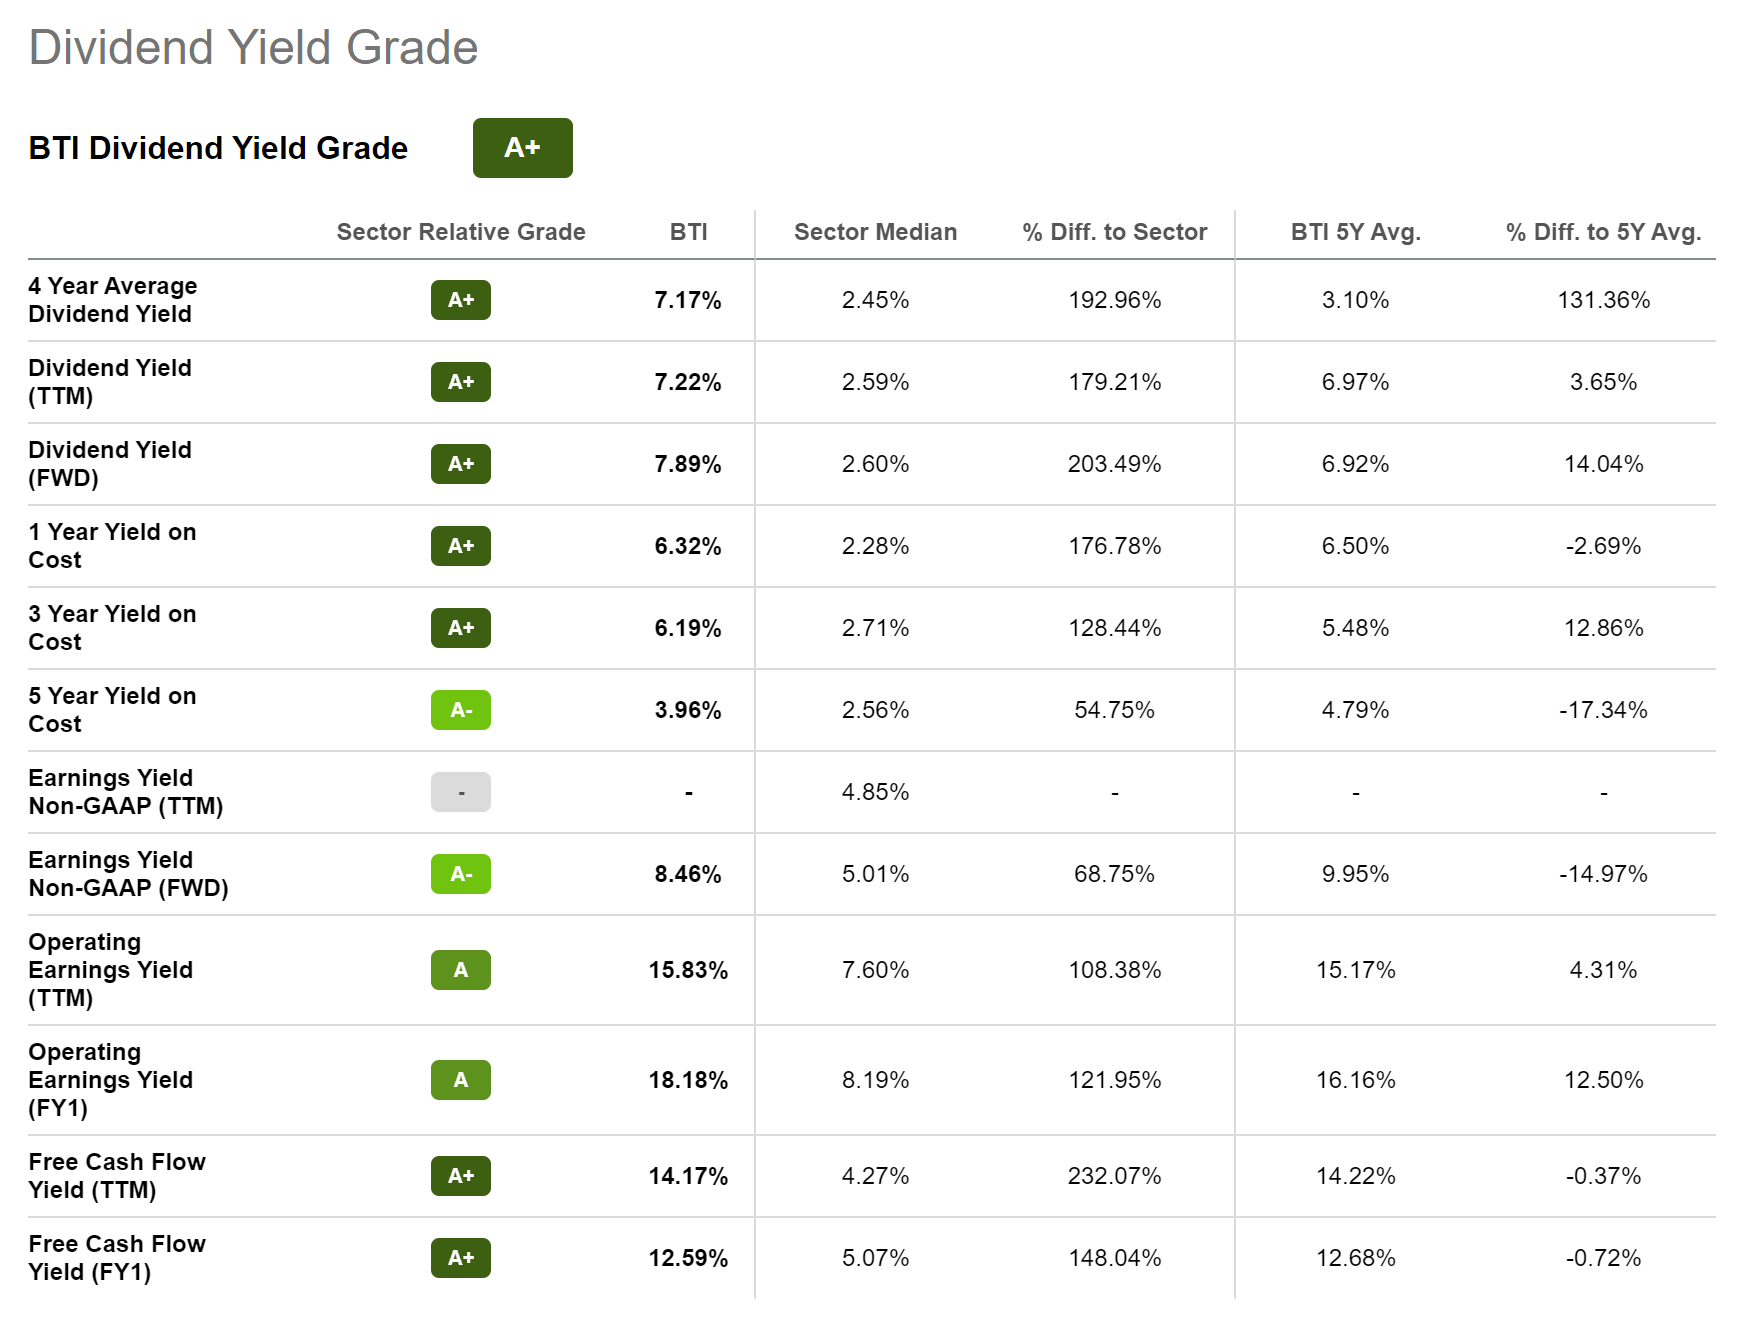
British American Tobacco
British American Tobacco is particularly attractive for this portfolio, since the company can help to increase the Average Dividend Yield. It currently pays a Dividend Yield [FWD] of 7.89%, which is 14.04% above its Average Dividend Yield [FWD] of the past 5 years (6.92%). In addition to that, its Dividend Yield [FWD] is 203.49% above the Dividend Yield of the Sector Median (2.60%).
Furthermore, British American Tobacco currently has a Free Cash Flow Yield [TTM] of 14.17%, indicating that the company not only provides shareholders with an attractive Dividend Yield, but is also a great pick when considering risk and reward.
From taking a closer look at the company’s current P/E [FWD] Ratio, we can further identify that it is attractive in terms of Valuation: its current P/E GAAP [FWD] Ratio is 11.82, which is 41.37% below the Sector Median (20.16).
Additionally, its Price / Cash Flow [TTM] Ratio of 6.45 is 59.20% below the Sector Median, indicating that the price you currently pay for the stock is attractive when compared to the Free Cash Flow that the company generates year over year.
Below you can find an overview of British American Tobacco’s Dividend Yield Grades, which underline, once again, that the company is a great selection for investors seeking Dividend Income.
Coca-Cola
I admit that Coca-Cola is not particularly attractive in terms of Valuation at this moment in time: its P/E [FWD] Ratio of 27.28 is currently 7.96% above its 5 Year Average P/E [FWD] Ratio.
However, the company is still a good choice for this portfolio, since it is able to contribute to reducing portfolio volatility. When observing the company’s 60M Beta, we get confirmation of that statement: Coca-Cola’s 60M Beta is 0.58.
Coca-Cola’s strong competitive advantages are underlined by its high EBIT Margin [TTM] of 28.90%. The company’s EBIT Margin is significantly higher than the one of PepsiCo (NASDAQ: PEP ) (15.05%), for example.
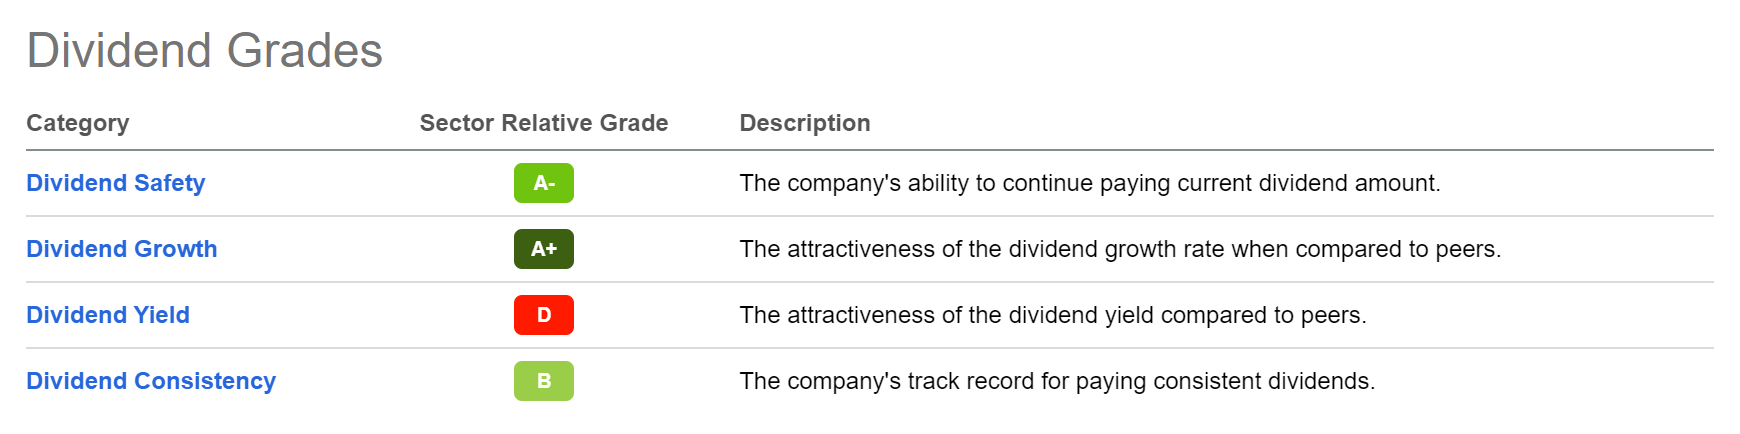
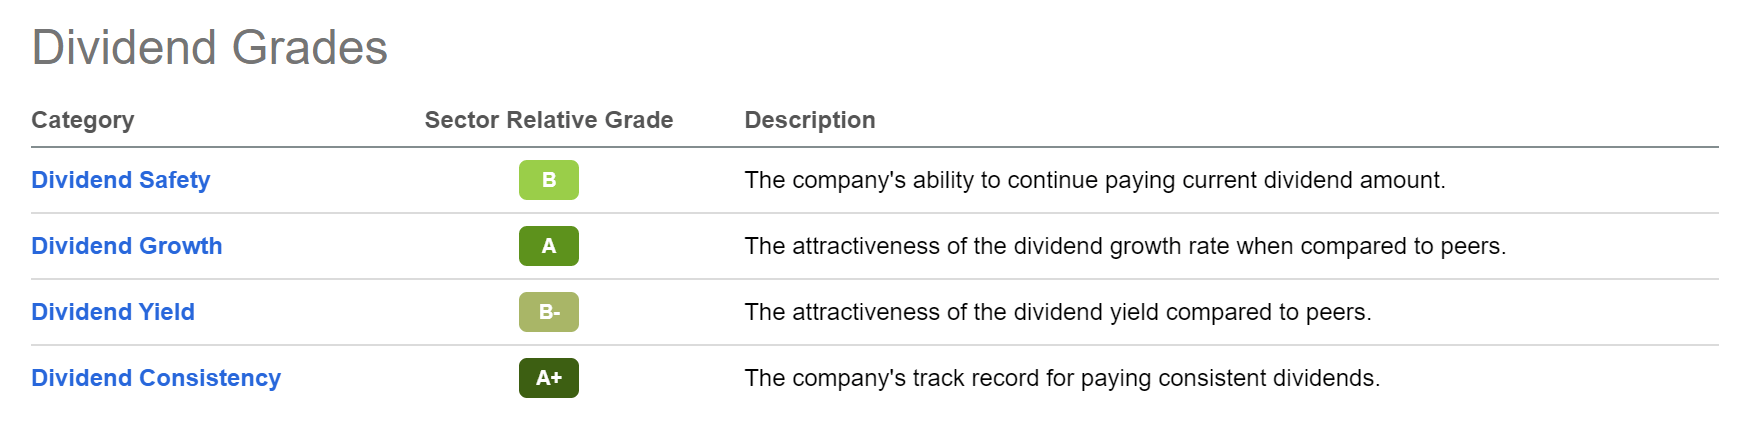
At this moment, Coca-Cola pays its shareholders an attractive Dividend Yield [FWD] of 2.91%. This attractive Dividend is also underlined by the Seeking Alpha Dividend Grades: the company receives an A+ for Dividend Consistency and an A for Dividend Growth. For Dividend Safety, it receives a B while it gets a B- for Dividend Yield.
McDonald’s
McDonald’s is part of this portfolio as it provides its shareholders with not only a relatively attractive Dividend Yield [FWD] of 2.23%, but also an appealing Dividend Growth Rate: the company has shown a Dividend Growth Rate 5Y [CAGR] of 8.12%.
In addition to that, its EPS Diluted Growth Rate [FWD] is 20.69%, which is 59.33% above the Sector Median (12.98%). Moreover, its Free Cash Flow Per Share Growth Rate [FWD] is 17.88%, being significantly above the Sector Median (2.07%). Both are strong indicators that McDonald’s is absolutely on track when it comes to Growth and they also strengthen my confidence that it could be able to contribute to the Dividend Growth of your investment portfolio.
McDonald’s current Dividend Yield [FWD] of 2.23% is slightly higher than the Dividend Yield [FWD] of competitors such as Starbucks (NASDAQ: SBUX ) (1.94%) or Yum! (NYSE: YUM ) (1.78%), indicating that it's currently attractive when compared to its peer group. However, it is slightly lower than the Dividend Yield [FWD] of Restaurants Brands International (NYSE: QSR ) (3.22%).
McDonald’s attractiveness in comparison to its peer group is also confirmed by the Seeking Alpha Quant Ranking, which rates the company 14 th out of 42 in the Restaurant Industry and 142 nd out of 550 in the Consumer Discretionary Sector.
Source: Seeking Alpha
Itaú Unibanco
Itaú Unibanco is the largest bank in Brazil in terms of revenue and at the same time, the largest asset manager not only in the largest country of South America, but also the whole continent. The bank has a Return on Equity that is significantly above the Sector Median; while the Brazilian bank generates a Return on Equity of 18.43%, the ROE of the Sector Median is only 11.34%. These numbers serve as a strong indicator that the bank efficiently uses shareholder’s equity to generate income.
In my opinion, the Brazilian bank currently has an attractive Valuation: its current P/E [FWD] Ratio is 8.61, which is 14.85% below the Sector Median (10.11). At the same time, it is 21.94% below the 5 Year Average P/E [FWD] Ratio of the bank (11.03), both indicating that it is currently undervalued.
Different numbers also show us that Itaú Unibanco is on track in terms of Growth: the company’s Revenue Growth Rate [FWD], for example, is 13.53%, being 74.99% above the Sector Median (7.73%).
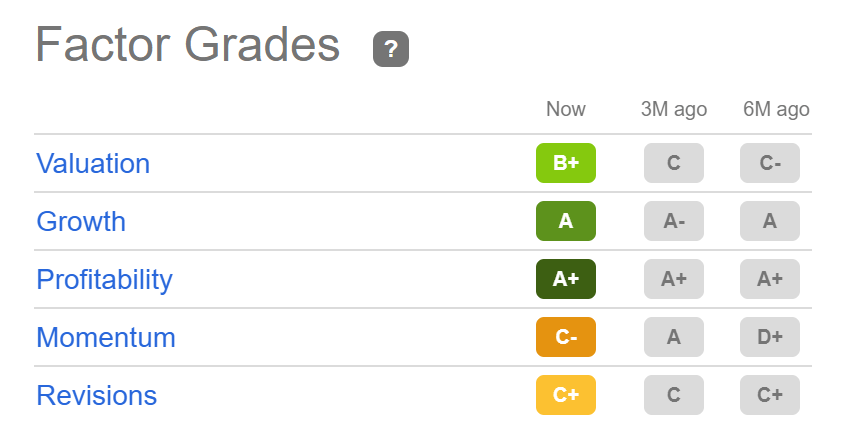
The Seeking Alpha Factor Grades underline that Itaú Unibanco is an attractive pick at this moment in time: The Brazilian bank is rated with an A+ rating for Profitability and with an A for Growth. In terms of Valuation, it receives a B+ rating, underlying my thesis that the bank is currently undervalued.
However, due to both macroeconomic and exchange rate risks, I would underweight the Brazilian Bank in a long-term investment portfolio.
Conclusion
Allocation is critical to the long-term success of an investment portfolio. Therefore, when building one, I suggest overweighting companies that are particularly attractive when it comes to risk and reward.
In this article, I have shown how you could allocate $20,000 between 8 dividend income and dividend growth companies as well as 2 ETFs.
The portfolio I have built for you and which I have presented in this article, provides you as an investor with an attractive Weighted Average Dividend Yield [TTM] of 3.04%. At the same time it gives you a Weighted Average Dividend Growth Rate of 9.60% (over the past 5 years). Building such a portfolio can help you to generate an important additional income that can also increase year over year.
I would love to hear your opinion on this investment portfolio and whether you own any of the selected companies/ETFs that I have presented in this article. Let me know if you have any questions.
For further details see:
How To Allocate $20,000 Among 10 Dividend Income And Growth Stocks And ETFs