SCGLF - How To Allocate $25000 Among 2 ETFs And July's Top 20 Dividend Income Stocks
2023-07-27 18:00:00 ET
Summary
- The investment portfolio I am presenting in today’s article includes 10 carefully selected dividend growth companies and 10 high dividend yield companies in addition to two ETFs.
- This portfolio provides you with a Weighted Average Dividend Yield [TTM] of 3.95% and a Weighted Average Dividend Growth Rate 5 Year [CAGR] of 10.08%.
- In addition to that, the investment portfolio offers extensive diversification over sectors and industries as well as geographical diversification, contributing to reducing its risk level.
Investment Thesis
The allocation of your investment portfolio determines to a significant degree the Total Return that you will achieve over the long term and has a strong impact on the risk level your investment portfolio is exposed to.
Due to the enormous importance of portfolio allocation, in today’s article, I will dive deeper into this topic and present you with a carefully selected number of dividend growth and high dividend yield companies. I will show you how you could allocate the amount of $25,000 among 2 ETFs and 10 dividend growth companies as well as 10 high dividend yield companies that I believe are currently attractive for investors.
This dividend portfolio offers you a Weighted Average Dividend Yield [TTM] of 3.95%, while it shows a Weighted Average Dividend Growth Rate 5 Year [CAGR] of 10.08%. In addition to that, I believe it reaches a broad diversification over sectors and industries, thus contributing to reducing the portfolio’s risk level.
The following are my top 10 dividend growth companies that I have selected for July 2023:
- Apple (AAPL)
- Bank of America (BAC)
- BlackRock (BLK)
- Broadcom (AVGO)
- Mastercard (MA)
- Microsoft (MSFT)
- Steel Dynamics (STLD)
- Tencent (TCEHY)
- The Goldman Sachs Group (GS)
- Visa (V)
The following are my top 10 high dividend yield companies to consider investing in for July:
- Altria (MO)
- AT&T (T)
- BHP Group Limited (BHPLF)
- Energy Transfer (ET)
- Rio Tinto (RIO)
- Société Générale ([[SCGLF]], [[SCGLY]])
- Swiss Re (SSREF)
- The Bank of Nova Scotia ([[BNS]], [[BNS:CA]] )
- United Parcel Service (UPS)
- Verizon Communications Inc. (VZ)
Overview of the 2 ETFs and the 20 selected dividend income stocks for July 2023
| Company Name |
| Sector |
| Industry |
| Country |
| Dividend Yield [TTM] |
| Dividend Yield [FWD] |
| Dividend Growth 5Y |
| P/E [FWD] Ratio |
| Allocation |
| Amount in $ |
| Altria Group |
| Consumer Staples |
| Tobacco |
| United States |
| 8.48% |
| 8.48% |
| 6.69% |
| 9.37 |
| 3.0% |
| 750 |
| Apple |
| Information Technology |
| Technology Hardware, Storage and Peripherals |
| United States |
| 0.49% |
| 0.51% |
| 7.26% |
| 31.8 |
| 4.0% |
| 1000 |
| AT&T |
| Communication Services |
| Integrated Telecommunication Services |
| United States |
| 7.01% |
| 7.01% |
| -5.78% |
| 6.85 |
| 2.0% |
| 500 |
| Bank of America |
| Financials |
| Diversified Banks |
| United States |
| 3.00% |
| 3.00% |
| 12.89% |
| 8.74 |
| 3.0% |
| 750 |
| BHP Group |
| Materials |
| Diversified Metals and Mining |
| Australia |
| 8.77% |
| 5.96% |
| 24.84% |
| 13.86 |
| 2% |
| 500 |
| BlackRock |
| Financials |
| Asset Management and Custody Banks |
| United States |
| 2.72% |
| 2.75% |
| 12.93% |
| 20.78 |
| 4.0% |
| 1000 |
| Broadcom |
| Information Technology |
| Semiconductors |
| United States |
| 2.01% |
| 2.07% |
| 23.34% |
| 21.14 |
| 2.5% |
| 625 |
| Energy Transfer |
| Energy |
| Oil and Gas Storage and Transportation |
| United States |
| 8.76% |
| 9.73% |
| -1.43% |
| 8.95 |
| 2% |
| 500 |
| iShares Core High Dividend ETF |
| ETFs |
| ETFs |
| United States |
| 4.22% |
| 6.32% |
| 22.50% |
| 5625 |
| Mastercard |
| Financials |
| Transaction & Payment Processing Services |
| United States |
| 0.55% |
| 0.57% |
| 17.80% |
| 32.88 |
| 3.0% |
| 750 |
| Microsoft |
| Information Technology |
| Systems Software |
| United States |
| 0.79% |
| 0.81% |
| 10.02% |
| 34.97 |
| 3.0% |
| 750 |
| Rio Tinto |
| Materials |
| Diversified Metals and Mining |
| United Kingdom |
| 7.58% |
| 6.93% |
| 10.99% |
| 7.31 |
| 2% |
| 500 |
| Schwab U.S. Dividend Equity ETF |
| ETFs |
| ETFs |
| United States |
| 3.55% |
| 13.92% |
| 27.50% |
| 6875 |
| Société Générale |
| Financials |
| Diversified Banks |
| France |
| 7.13% |
| 7.13% |
| -6.65% |
| 6.02 |
| 1.0% |
| 250 |
| Steel Dynamics |
| Materials |
| Steel |
| United States |
| 1.43% |
| 1.59% |
| 17.44% |
| 6.67 |
| 1.5% |
| 375 |
| Swiss RE |
| Financials |
| Reinsurance |
| Switzerland |
| 6.54% |
| 6.540% |
| 4.64% |
| 3.48 |
| 1.5% |
| 375 |
| Tencent Holdings |
| Communication Services |
| Interactive Media and Services |
| China |
| 4.35% |
| 0.68% |
| 77.05% |
| 18.28 |
| 1.0% |
| 250 |
| The Bank of Nova Scotia |
| Financials |
| Diversified Banks |
| Canada |
| 6.27% |
| 6.37% |
| 4.48% |
| 9.53 |
| 3% |
| 750 |
| The Goldman Sachs Group |
| Financials |
| Investment Banking and Brokerage |
| United States |
| 3.06% |
| 3.06% |
| 26.81% |
| 11.79 |
| 3.0% |
| 750 |
| United Parcel Service |
| Industrials |
| Air Freight and Logistics |
| United States |
| 3.60% |
| 3.71% |
| 12.53% |
| 16.33 |
| 3% |
| 750 |
| Verizon Communications |
| Communication Services |
| Integrated Telecommunication Services |
| United States |
| 7.11% |
| 7.14% |
| 2.04% |
| 7.96 |
| 2.5% |
| 625 |
| Visa |
| Financials |
| Transaction & Payment Processing Services |
| United States |
| 0.71% |
| 0.74% |
| 17.20% |
| 28.17 |
| 3.0% |
| 750 |
| 3.95% |
| 10.08% |
| 100.00% |
| 25,000 |
Source: The Author, data from Seeking Alpha
Portfolio Allocation per Company/ETF
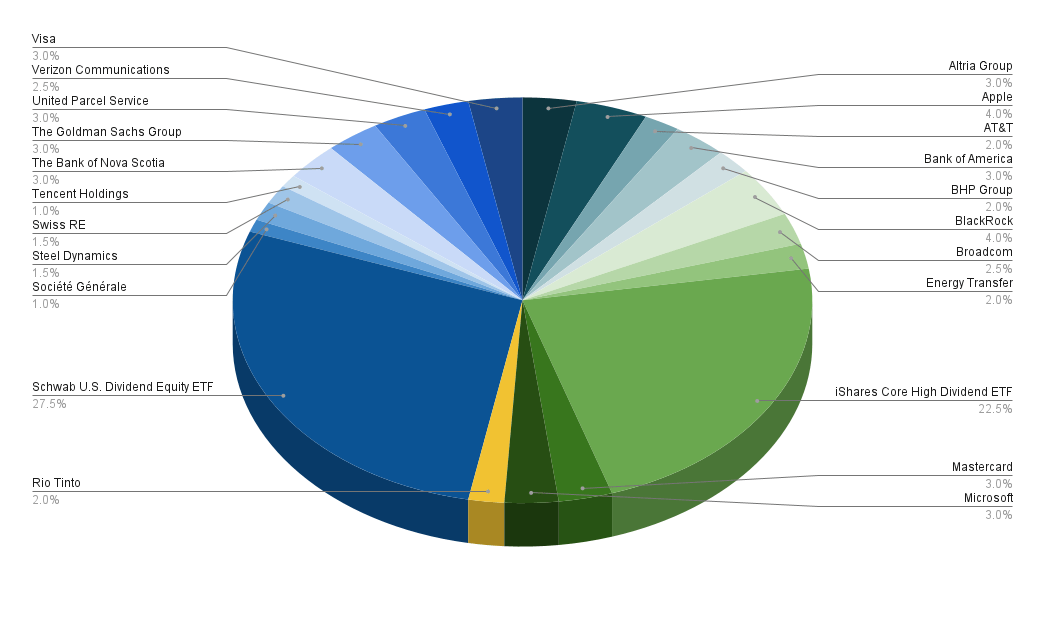
The two picks with the highest percentage of the overall investment portfolio are the Schwab U.S. Dividend Equity ETF (NYSEARCA: SCHD ) (27.5%) and the iShares Core High Dividend ETF (NYSEARCA: HDV ) (22.5%). When combined they represent 50% of the portfolio.
By providing them with the highest proportion of the overall portfolio, we reach a broader diversification, which means that we can reduce the portfolio’s risk level.
At the same time, we achieve the goal that each of the companies has a lower percentage of the overall investment portfolio, thus again reducing the portfolio’s risk level and increasing the probability of obtaining excellent investment results over the long term.
The companies listed below hold the highest percentage of the overall portfolio:
- Apple (4%)
- BlackRock (4%)
- Altria (3%)
- Bank of America (3%)
- Mastercard (3%)
- Microsoft (3%)
- The Goldman Sachs Group (3%)
- The Bank of Nova Scotia (3%)
- United Parcel Service (3%)
- Visa (3%)
Each of the selected companies that have the highest percentage of the overall investment portfolio come with strong competitive advantages and I believe they are excellent choices in terms of risk and reward. This means that they can provide investors with a relatively low risk level while being able to offer an attractive annual rate of return when investing with a long-investment-horizon.
The following four companies hold the smallest proportion of the overall investment portfolio:
- Steel Dynamics (1.5%)
- Swiss RE (1.5%)
- Société Générale (1.0%)
- Tencent (1.0%)
These picks have a lower percentage of the overall investment portfolio due to the fact I consider the risks that come along with an investment to be higher. Therefore, I believe that they provide investors with a lower probability of achieving attractive investment results over the long term. While I believe that a possible dividend cut would be among the highest risk factors for Société Générale and Swiss RE investors, I believe that a Tencent investment comes attached to relatively high macroeconomic risk factors.
When underweighting these companies in a portfolio, we ensure that a possible decline in any of these companies’ stock prices would only have a minor effect on the Total Return of your overall investment portfolio. This helps us to reduce the risk level and to increase the probability of obtaining an attractive Total Return over the long term.
Illustration of the Portfolio Allocation per Company/ETF
In the graphic below you can see the portfolio allocation per company/ETF. The graphic shows that each of the selected companies has a proportion between 1.0% and 4.0% of the overall investment portfolio. Due to this allocation, we reach a broader diversification and therefore a reduced risk level.
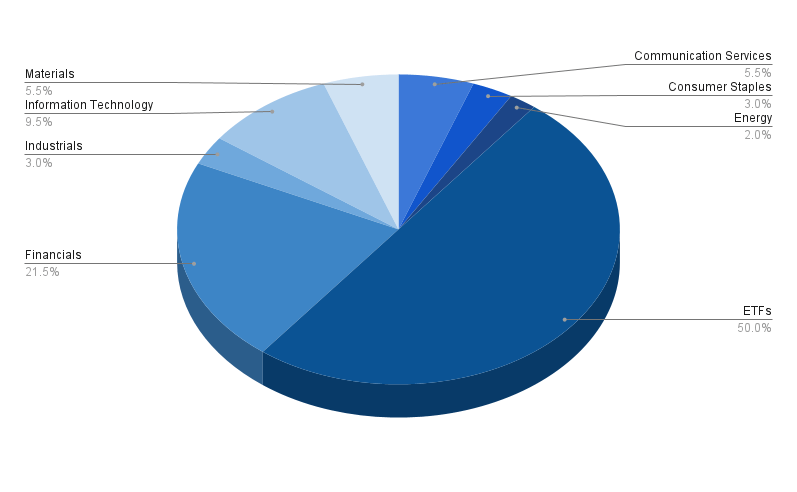
Portfolio Allocation per Sector
Below is an illustration of the portfolio allocation when allocating the Schwab U.S. Dividend Equity ETF and the iShares Core High Dividend ETF to the ETF sector. This graphic demonstrates that besides the ETF Sector, the Financials Sector holds the highest percentage of the overall portfolio (representing 21.5%).
The companies from the Financials Sector are Bank of America (making up 3.0% of the overall investment portfolio), BlackRock (4.0%), Mastercard (3.0%), Société Générale (1.0%), Swiss RE (1.5%), The Bank of Nova Scotia (3%), The Goldman Sachs Group (3.0%), and Visa (3.0%).
The Information Technology Sector makes up 9.5% of the overall investment portfolio. The companies that represent the Technology Sector are Apple (4%), Broadcom (2.5%), and Microsoft (3%).
The Communication Services Sector, represented by AT&T (2%), Tencent (1%) and Verizon (2.5%) and the Materials Sector, represented by BHP Group (2%), Rio Tinto (2%) and Steel Dynamics (1.5%) each make up 5.5% of the overall investment portfolio.
The Industrials Sector (represented by United Parcel Service) and the Consumer Staples Sector (represented by Altria) each have a proportion of 3% of the overall portfolio.
The Energy Sector (with Energy Transfer) represents 2% of the overall investment portfolio.
This allocation provides investors with a broad diversification and therefore a reduced risk level.
Illustration of the Portfolio Allocation per Sector when allocating SCHD and HDV to the ETF Sector
Below is an overview of the Sectors and their corresponding companies/ETFs.
ETFs (50%)
- Schwab U.S. Dividend Equity ETF (27.5%)
- iShares Core High Dividend ETF (22.5%)
Financials (21.5%)
- Bank of America (3.0%)
- BlackRock (4.0%)
- Mastercard (3.0%)
- Société Générale (1.0%)
- Swiss RE (1.5%)
- The Bank of Nova Scotia (3%)
- The Goldman Sachs Group (3.0%)
- Visa (3.0%)
Information Technology (9.5%)
- Apple (4%)
- Broadcom (2.5%)
- Microsoft (3%)
Communication Services (5.5%)
- AT&T (2.0%)
- Tencent (1%)
- Verizon (2.5%)
Materials (5.5%)
- BHP Group (2%)
- Rio Tinto (2%)
- Steel Dynamics (1.5%)
Consumer Staples (3%)
- Altria (3%)
Industrials (3%)
- United Parcel Service (3%)
Energy (2%)
- Energy Transfer (2%)
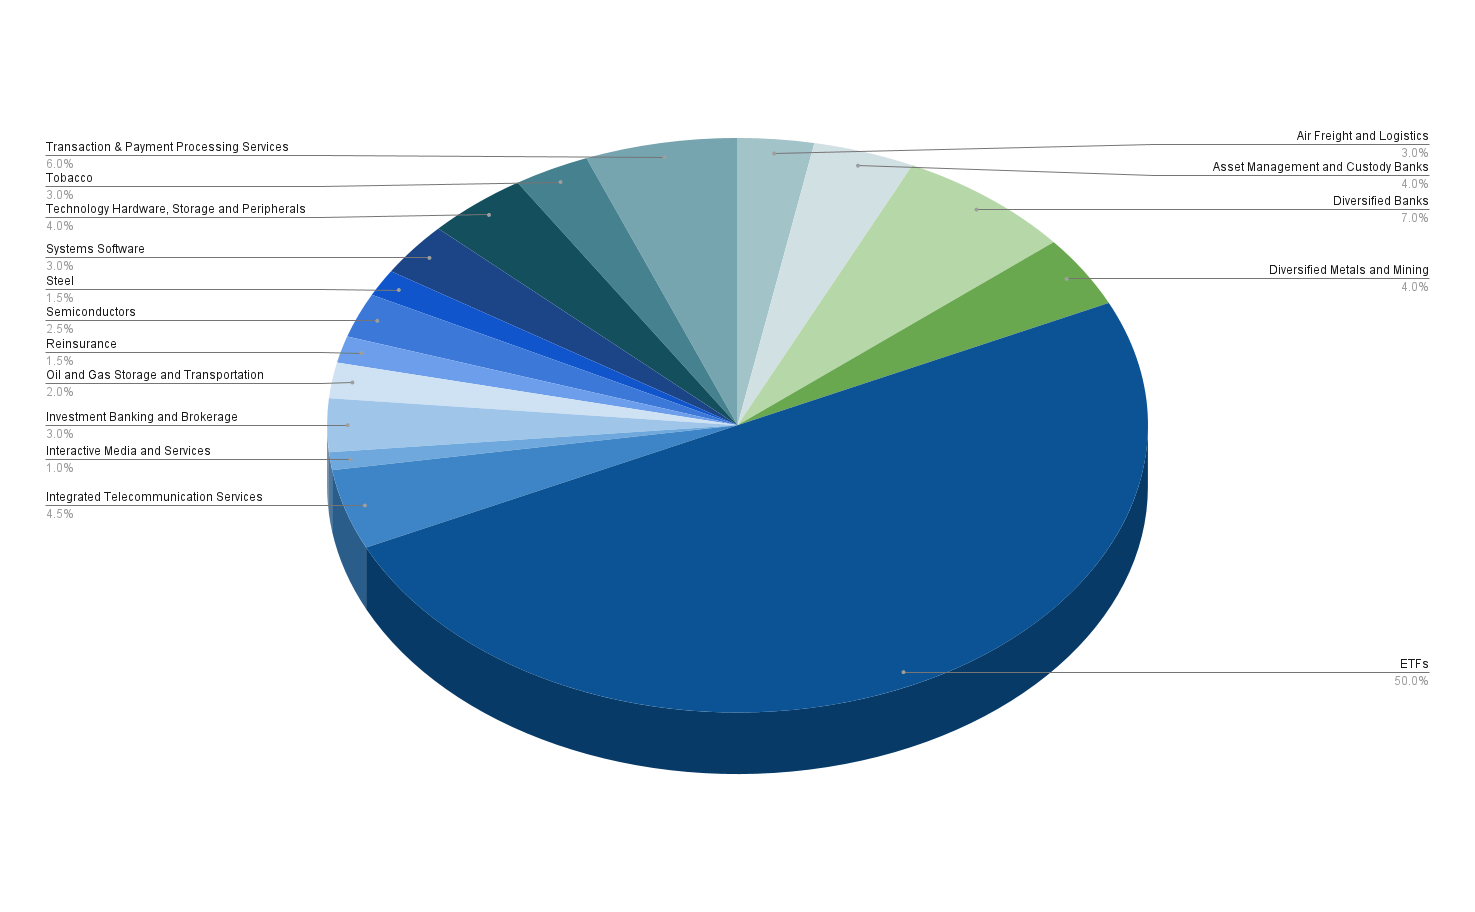
Portfolio Allocation per Industry
When allocating the Schwab U.S. Dividend Equity ETF and the iShares Core High Dividend ETF to the ETF Industry, the Diversified Banks Industry (7%) and the Transaction & Payment Processing Services Industry (6%) are the industries with the highest proportion of the portfolio besides the ETF Industry.
The Diversified Banks Industry is represented by The Goldman Sachs Group (3% of the overall portfolio), The Bank of Nova Scotia (3%) and Société Générale (1%). The Transaction & Payment Processing Services Industry is represented by Mastercard (3%) and Visa (3%).
The Integrated Telecommunication Services Industry (with Verizon representing 2.5% and AT&T 2%) has a proportion of 4.5% of the overall portfolio.
The Technology Hardware, Storage and Peripherals Industry (with Apple), the Asset Management and Custody Banks Industry (with BlackRock) and the Diversified Metals and Mining Industry (with BHP Group and Rio Tinto both making up 2%) each represent 4% of the overall portfolio.
All other industries represent 3% or less of the overall portfolio, indicating that we have reached a broad diversification. This broad diversification is also shown by the fact that no industry has a proportion of more than 7% of the overall investment portfolio (excluding the ETF Industry).
Illustration of the Portfolio Allocation per Industry when allocating SCHD and HDV to the ETF Industry
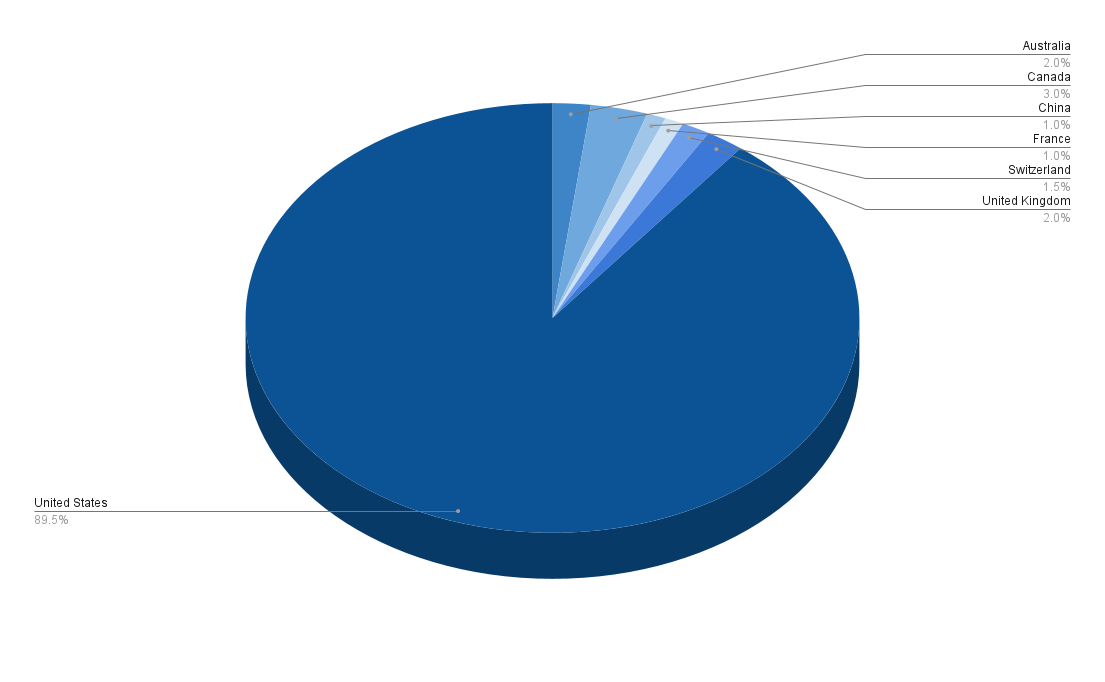
Portfolio Allocation per Country
The graphic below shows us that this investment portfolio not only offers a broad diversification over sectors and industries, but also a relatively broad geographical diversification. This is the case since companies from the United States represent 89.5% of the portfolio while 10.5% are companies based outside of the United States.
These countries are Australia (with BHP Group representing 2% of the overall portfolio), Canada (with The Bank of Nova Scotia making up 3%), China (with Tencent representing 1%), France (with Société Générale making up 1%), Switzerland (with Swiss RE accounting for 1.5%) and the United Kingdom (with Rio Tinto representing 2%).
Illustration of the Portfolio Allocation per Country
How to achieve an even Broader Diversification
If you would like to achieve an even broader diversification than this investment portfolio offers, you might consider invest ing in an additional ETF: you could take a closer look at the iShares Core Dividend Growth ETF (NYSEARCA: DGRO ), since it provides you with a relatively attractive Dividend Yield [TTM] of 3.37% and a Dividend Growth Rate [CAGR] of 10.32% over the past 5 years.
In case you ask yourself if it makes sense to only invest in SCHD, I would like to highlight some advantages of picking stocks individually over only investing in ETFs:
- It provides your portfolio with more individuality and flexibility
- You can protect your investment portfolio against the next stock market crash by adding companies with a low Beta Factor
- You can overweight industries with which you are more familiar and you can avoid others you do n’t want to invest in
- You can select stocks which you think are able to beat the market or you can select ones to raise the Weighted Average Dividend Yield or Weighted Dividend Growth Rate of your investment portfolio
- You can also achieve an even broader geographical diversification of your portfolio
In my article 10 Dividend Stocks To Show The Advantages Of Investing In Individual Stocks Over ETFs I discuss the advantages of the selection of stocks over ETFs in greater detail.
Conclusion
The goal of today’s article was to introduce you to a dividend income portfolio which includes 10 dividend growth and 10 high dividend yield companies which I currently consider to be attractive for investors.
This investment portfolio provides investors with a Weighted Average Dividend Yield [TTM] of 3.95%. Furthermore, it is worth noting that the companies/ETFs that are part of this investment portfolio have shown a Weighted Average Dividend Growth Rate [CAGR] of 10.08%. This attractive growth rate makes me believe that the portfolio should help you to increase your additional income in the form of dividends to a significant amount every year.
Furthermore, I would like to highlight that this dividend income portfolio provides you with a broad diversification over sectors and industries in addition to a geographical diversification, thus helping you to decrease the risk level of your investment portfolio.
I believe that this investment portfolio is an adequate choice to implement my investment strategy which prioritizes the achievement of an attractive Total Return while, at the same time, providing you with an attractive Dividend Yield in addition to Dividend Growth.
This is the case because companies that I consider to be particularly attractive in terms of risk and reward have the highest proportion of the overall investment portfolio, raising the probability of obtaining attractive investment results over the long term.
This approach helps you to increase your annual extra income through dividend payments and, at the same time, it contributes to you steadily increasing your wealth while benefiting from a broadly diversified investment portfolio with a decreased risk level.
Author’s Note: Thank you very much for reading and I would appreciate hear ing your opinion on this investment portfolio and its allocation! Do you own or plan to acquire one of the selected picks? Which are currently your favorite high dividend yield and dividend growth companies?
For further details see:
How To Allocate $25,000 Among 2 ETFs And July's Top 20 Dividend Income Stocks