NDAQ - How To Allocate $25000 Among My Top 20 Dividend Income Stocks For June 2023
2023-06-08 18:00:00 ET
Summary
- In today’s article, I will demonstrate how to allocate $25,000 among one ETF, 10 high dividend yield companies and 10 dividend growth companies.
- As I will demonstrate in this article, the investment portfolio reaches a broad diversification over sectors, industries, and countries.
- The portfolio provides you with a Weighted Average Dividend Yield [TTM] of 3.69% and the selected picks have shown a Weighted Average Dividend Growth Rate [CAGR] of 11.60%.
Investment Thesis
The goal of today's article is to show you how you could allocate $25,000 among one ETF as well as 10 high dividend yield companies and 10 dividend growth companies that I have selected for this month of June.
Through the allocation of these companies and the ETF, this investment portfolio provides you with a Weighted Average Dividend Yield [TTM] of 3.69%. Moreover, the selected picks have shown a Weighted Average Dividend Growth Rate [CAGR] of 11.60% over the last 5 years.
Therefore, I expect this portfolio to not only provide you with a relatively high additional income via dividends from today onwards, but I also believe this dividend income can increase to a significant amount year over year. This will help you to achieve greater independence from the price fluctuations of the stock market.
The following are my top 10 high dividen d yield companies that I have selected for June 2023:
- Allianz ( OTCPK:ALIZF , OTCPK:ALIZY ).
- Altria (NYSE: MO ).
- AT&T (NYSE: T ).
- BB Seguridade Participações ( OTCPK:BBSEY ).
- Johnson & Johnson (NYSE: JNJ ).
- Kinder Morgan (NYSE: KMI ).
- The Bank of Nova Scotia (NYSE: BNS ).
- United Parcel Service (NYSE: UPS ).
- U.S. Bancorp (NYSE: USB ).
- Verizon Communications Inc. (NYSE: VZ ).
The following are my top 10 dividend growth companies for June 2023:
- Apple (NASDAQ: AAPL ).
- BlackRock (NYSE: BLK ).
- Canadian Natural Resources Limited (NYSE: CNQ ).
- Goldman Sachs (NYSE: GS ).
- JPMorgan (NYSE: JPM ).
- Mastercard (NYSE: MA ).
- Microsoft (NASDAQ: MSFT ).
- Nasdaq (NASDAQ: NDAQ ).
- The Charles Schwab Corporation (NYSE: SCHW ).
- Union Pacific Corporation (NYSE: UNP ).
Overview of the 20 selected Dividend Income Picks for June 2023, the selected ETF and the Portfolio Allocation
| Company Name |
| Sector |
| Industry |
| Country |
| Dividend Yield [TTM] |
| Dividend Growth 5Y |
| Allocation |
| Amount in $ |
| Allianz |
| Financials |
| Multi-line Insurance |
| Germany |
| 5.45% |
| 5.72% |
| 4% |
| 1000 |
| Altria Group |
| Consumer Staples |
| Tobacco |
| United States |
| 8.21% |
| 7.18% |
| 3.5% |
| 875 |
| Apple |
| Information Technology |
| Technology Hardware, Storage and Peripherals |
| United States |
| 0.54% |
| 7.26% |
| 5% |
| 1250 |
| AT&T |
| Communication Services |
| Integrated Telecommunication Services |
| United States |
| 6.81% |
| -5.78% |
| 4% |
| 1000 |
| BB Seguridade Participações S.A. |
| Financials |
| Multi-line Insurance |
| Brazil |
| 9.19% |
| 13.89% |
| 2% |
| 500 |
| BlackRock |
| Financials |
| Asset Management and Custody Banks |
| United States |
| 2.97% |
| 13.60% |
| 3.5% |
| 875 |
| Canadian Natural Resources Limited |
| Energy |
| Oil and Gas Exploration and Production |
| Canada |
| 4.12% |
| 21.83% |
| 3% |
| 750 |
| Johnson & Johnson |
| Health Care |
| Pharmaceuticals |
| United States |
| 2.84% |
| 6.11% |
| 5% |
| 1250 |
| JPMorgan Chase & Co. |
| Financials |
| Diversified Banks |
| United States |
| 2.93% |
| 12.91% |
| 3% |
| 750 |
| Kinder Morgan |
| Energy |
| Oil and Gas Storage and Transportation |
| United States |
| 6.75% |
| 14.16% |
| 2% |
| 500 |
| Mastercard |
| Financials |
| Transaction & Payment Processing Services |
| United States |
| 0.57% |
| 17.66% |
| 2% |
| 500 |
| Microsoft |
| Information Technology |
| Systems Software |
| United States |
| 0.84% |
| 10.02% |
| 5% |
| 1250 |
| Nasdaq |
| Financials |
| Financial Exchanges and Data |
| United States |
| 1.47% |
| 9.57% |
| 1% |
| 250 |
| Schwab U.S. Dividend Equity ETF |
| ETFs |
| ETFs |
| United States |
| 3.75% |
| 15.56% |
| 40% |
| 10000 |
| The Bank of Nova Scotia |
| Financials |
| Diversified Banks |
| Canada |
| 6.24% |
| 4.38% |
| 3% |
| 750 |
| The Charles Schwab Corporation |
| Financials |
| Investment Banking and Brokerage |
| United States |
| 1.78% |
| 21.16% |
| 1% |
| 250 |
| The Goldman Sachs Group |
| Financials |
| Investment Banking and Brokerage |
| United States |
| 2.94% |
| 25.93% |
| 3% |
| 750 |
| U.S. Bancorp |
| Financials |
| Diversified Banks |
| United States |
| 6.31% |
| 10.00% |
| 1% |
| 250 |
| Union Pacific Corporation |
| Industrials |
| Rail Transportation |
| United States |
| 2.65% |
| 14.83% |
| 3% |
| 750 |
| United Parcel Service |
| Industrials |
| Air Freight and Logistics |
| United States |
| 3.67% |
| 12.53% |
| 3% |
| 750 |
| Verizon Communications |
| Communication Services |
| Integrated Telecommunication Services |
| United States |
| 7.21% |
| 2.04% |
| 3% |
| 750 |
| 3.69% |
| 11.60% |
| 100% |
| 25000 |
Source: The Author, data from Seeking Alpha
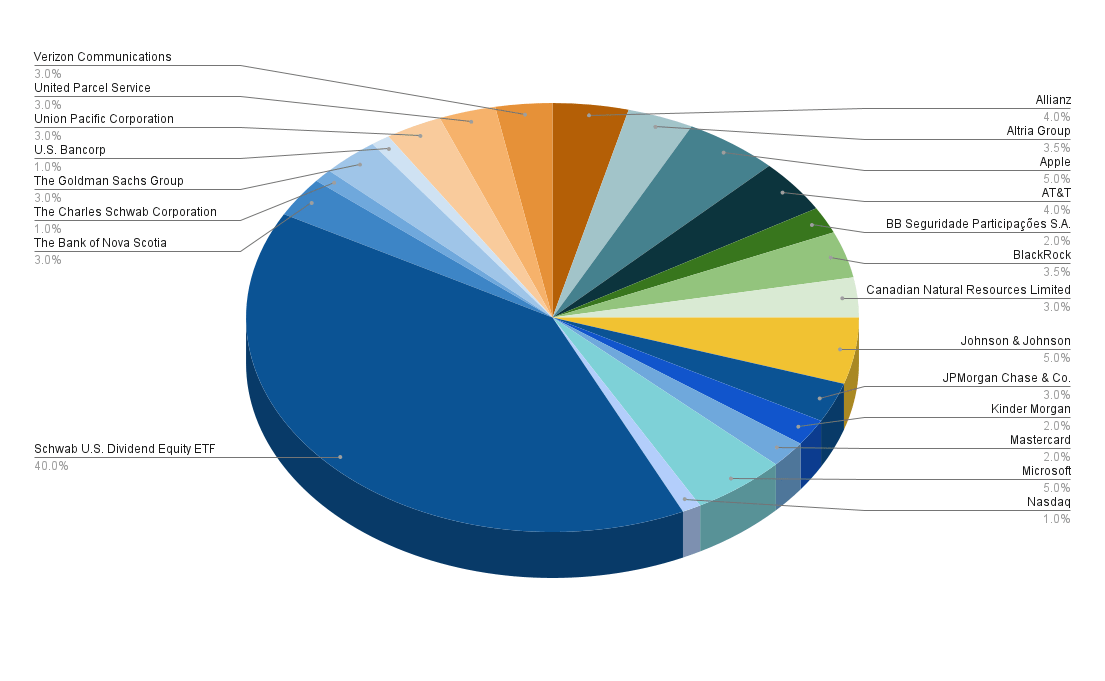
Portfolio Allocation per Company/ETF
The Schwab U.S. Dividend Equity ETF receives the highest overall proportion of this portfolio (40%).
Giving the ETF the highest percentage of this portfolio contributes to raising its Weighted Average Dividend Yield [TTM]. At the same time, it helps us to implement our dividend income strategy with the goal of achieving a significant extra income in the form of dividends, while increasing this Dividend Yield at an attractive growth rate from year to year. Furthermore, it helps us to reach an even broader risk diversification.
The following companies have the highest proportion of this investment portfolio:
- Apple (5%).
- Johnson & Johnson (5%).
- Microsoft (5%).
- Allianz (4%).
- AT&T (4%).
- Altria (3.5%).
- BlackRock (3.5%).
For each company that is overweighted in this investment portfolio, I consider the expected compound annual rate of return to be relatively high and the risks that come attached to an investment to be relatively low.
In addition to that, it can be stated that some of the picks (such as Allianz, Altria and AT&T) help you to raise the Weighted Average Dividend Yield [TTM] of your portfolio. This is another reason why I have given them a higher percentage of the overall portfolio.
The following companies each have a proportion of 3% of the overall portfolio:
- Canadian Natural Resources (3%).
- JPMorgan (3%).
- The Bank of Nova Scotia (3%).
- The Goldman Sachs Group (3%).
- Union Pacific Corporation (3%).
- United Parcel Service (3%).
- Verizon (3%).
The companies below are underweighted in this portfolio, with an overall proportion of 2% or less:
- BB Seguridade Participações S.A. (2%).
- Kinder Morgan (2%).
- Mastercard (2%).
- Nasdaq (1%).
- The Charles Schwab Corporation (1%).
- U.S. Bancorp (1%).
I consider the risk factors that come attached to the companies underweighted in this portfolio to be higher. By giving these companies a smaller percentage of the overall portfolio, a decline in the stock price of one of these picks would have a lower negative impact on the Total Return of your portfolio.
However, I would like to highlight that Mastercard is a company that I generally suggest to overweight in an investment portfolio due to the fact that it can help you to significantly raise the Weighted Average Dividend Growth Rate of your portfolio. In this case, the reason for giving Mastercard a relatively low percentage of the overall portfolio is so that the proportion of companies from the Financials Sector doesn't get too high (since a relatively high percentage of the selected dividend growth companies for the month of June is from the Financials Sector). Due to this allocation, I have ensured a broader diversification over Sectors.
Illustration of the Portfolio Allocation per Company/ETF
The graphic below shows the portfolio allocation per company/ETF.
The Portfolio Allocation per Company when allocating the ETF among the companies it is invested in
Below you can find the portfolio allocation per company when allocating the ETF among the companies it is actually invested in. I would like to explain this with the following example: I have given BlackRock a percentage of 3.5% of the overall portfolio. In addition to that, 3.25% of the Schwab U.S. Dividend Equity ETF is invested in BlackRock. Since this ETF represents 40% of this investment portfolio, an additional percentage of 1.3% (3.25% multiplied by 40%) is allocated to BlackRock, which means that 4.80% of this portfolio is represented by BlackRock.
| Company |
| Portfolio Allocation |
| Apple |
| 5.00% |
| Johnson & Johnson |
| 5.00% |
| Microsoft |
| 5.00% |
| BlackRock |
| 4.80% |
| Verizon |
| 4.60% |
| Altria |
| 4.55% |
| United Parcel Service |
| 4.53% |
| Allianz |
| 4.00% |
| AT&T |
| 4.00% |
| Canadian Natural Resources Limited |
| 3.00% |
| JPMorgan Chase & Co. |
| 3.00% |
| The Bank of Nova Scotia |
| 3.00% |
| The Goldman Sachs Group |
| 3.00% |
| Union Pacific Corporation |
| 3.00% |
| Broadcom |
| 2.15% |
Source: The Author
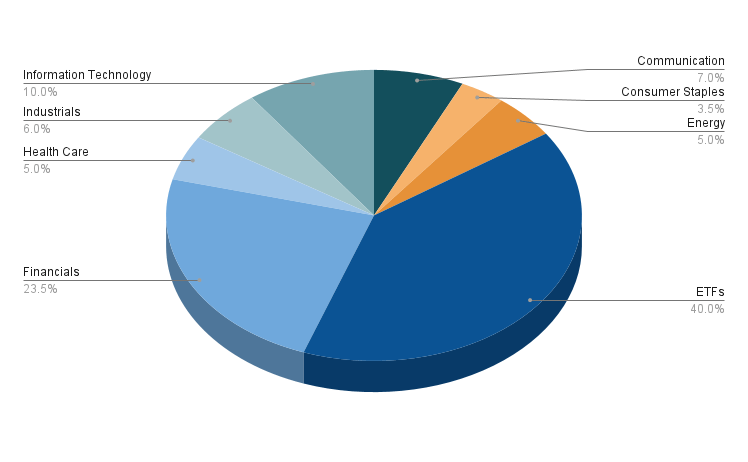
Portfolio Allocation per Sector
Besides the ETF Sector, the Financials Sector has the highest percentage of the overall portfolio with 23.5%.
The Financials Sector is represented by the following companies: Allianz (4%), BB Seguridade Participações S.A. (2%), BlackRock (3.5%), JPMorgan Chase & Co. (3%), Mastercard (2%), Nasdaq (1%), The Bank of Nova Scotia (3%), The Charles Schwab Corporation (1%), The Goldman Sachs Group (3%), and U.S. Bancorp (1%).
The second largest is the Information Technology Sector with 10% (represented by Apple and Microsoft with 5% each).
The Communication Sector represents 7% of the overall portfolio (Verizon makes up 3% and AT&T 4%).
The Industrials Sector makes up 6% of the overall portfolio (Union Pacific Corporation and United Parcel Service represent 3% each), while the Energy Sector (Canadian Natural Resources makes up 3% and Kinder Morgan 2%) and the Health Care Sector (represented by Johnson & Johnson) have a proportion of 5% each of the overall portfolio.
The Consumer Staples Sector (represented by Altria) makes up 3.5% of the overall portfolio.
Illustration of the Portfolio Allocation per Sector when allocating SCHD to the ETF Sector
Below you can find a graphic that shows the portfolio allocation when allocating SCHD to the ETF Sector.
Here you can find the list of companies/ETFs that belong to each sector.
ETFs (40%)
- Schwab U.S. Dividend Equity ETF (40%).
Financials (23.5%)
- Allianz (4%).
- BB Seguridade Participações S.A. (2%).
- BlackRock (3.5%).
- JPMorgan Chase & Co. (3%).
- Mastercard (2%).
- Nasdaq (1%).
- The Bank of Nova Scotia (3%).
- The Charles Schwab Corporation (1%).
- The Goldman Sachs Group (3%).
- U.S. Bancorp (1%).
Information Technology (10%)
- Apple (5%).
- Microsoft (5%).
Communication (7%)
- AT&T (4%).
- Verizon (3%).
Industrials (6%)
- Union Pacific Corporation (3%).
- United Parcel Service (3%).
Energy (5%)
- Canadian Natural Resources Limited (3%).
- Kinder Morgan (2%).
Health Care (5%)
- Johnson & Johnson (5%).
Consumer Staples (3.5%)
- Altria (3.5%).
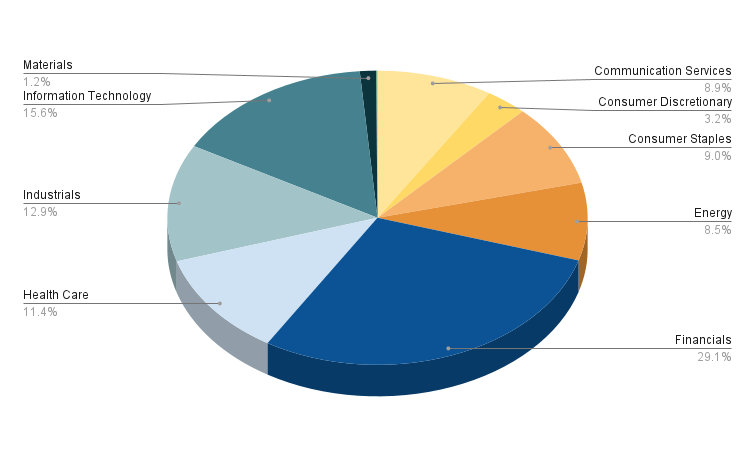
Illustration of the Portfolio Allocation per Sector when allocating the ETF among the Sectors it is invested in
Below you can find the portfolio allocation per sector when allocating the ETF among the Sectors it is actually invested in.
We can see that the Financials Sector has the highest percentage of the overall portfolio (29.1%), followed by the Information Technology Sector (15.6%), the Industrials Sector (12.9%), and the Health Care Sector (11.4%).
The Consumer Staples Sector represents 9% of the overall portfolio, the Communication Services Sector 8.9%, and the Energy Sector 8.5%.
It can also be seen that the Consumer Discretionary Sector (3.2%) and the Materials Sector (1.2%) have a relatively low percentage of the overall portfolio.
By providing some companies from the Financials Sector with a lower proportion of the overall portfolio, we have achieved the aim of having the Financials Sector make up less than 30% of the overall portfolio (even when allocating the Schwab U.S. Dividend Equity ETF to the Sectors it is actually invested in). This has helped us to achieve a broader diversification for this investment portfolio.
Portfolio Allocation per Industry
When allocating the Schwab U.S. Dividend Equity ETF to the ETF Industry, we can see that (besides the ETF Industry) the Diversified Banks Industry (7%) and the Telecommunication Services Industry (7%) represent the highest percentage of the overall portfolio.
The Multi-line Insurance Industry represents 6% of the overall portfolio, while the Pharmaceuticals Industry, the Systems Software Industry, and the Technology Hardware, Storage and Peripherals Industry represent 5% each. All other Industries make up less than 5% of the overall portfolio.
Since no Industry (besides the ETF Industry) has a proportion of more than 7% of the overall portfolio, it can be stated that we have reached a broad diversification over Industries.
Illustration of the Portfolio Allocation per Industry when allocating SCHD to the ETF Industry
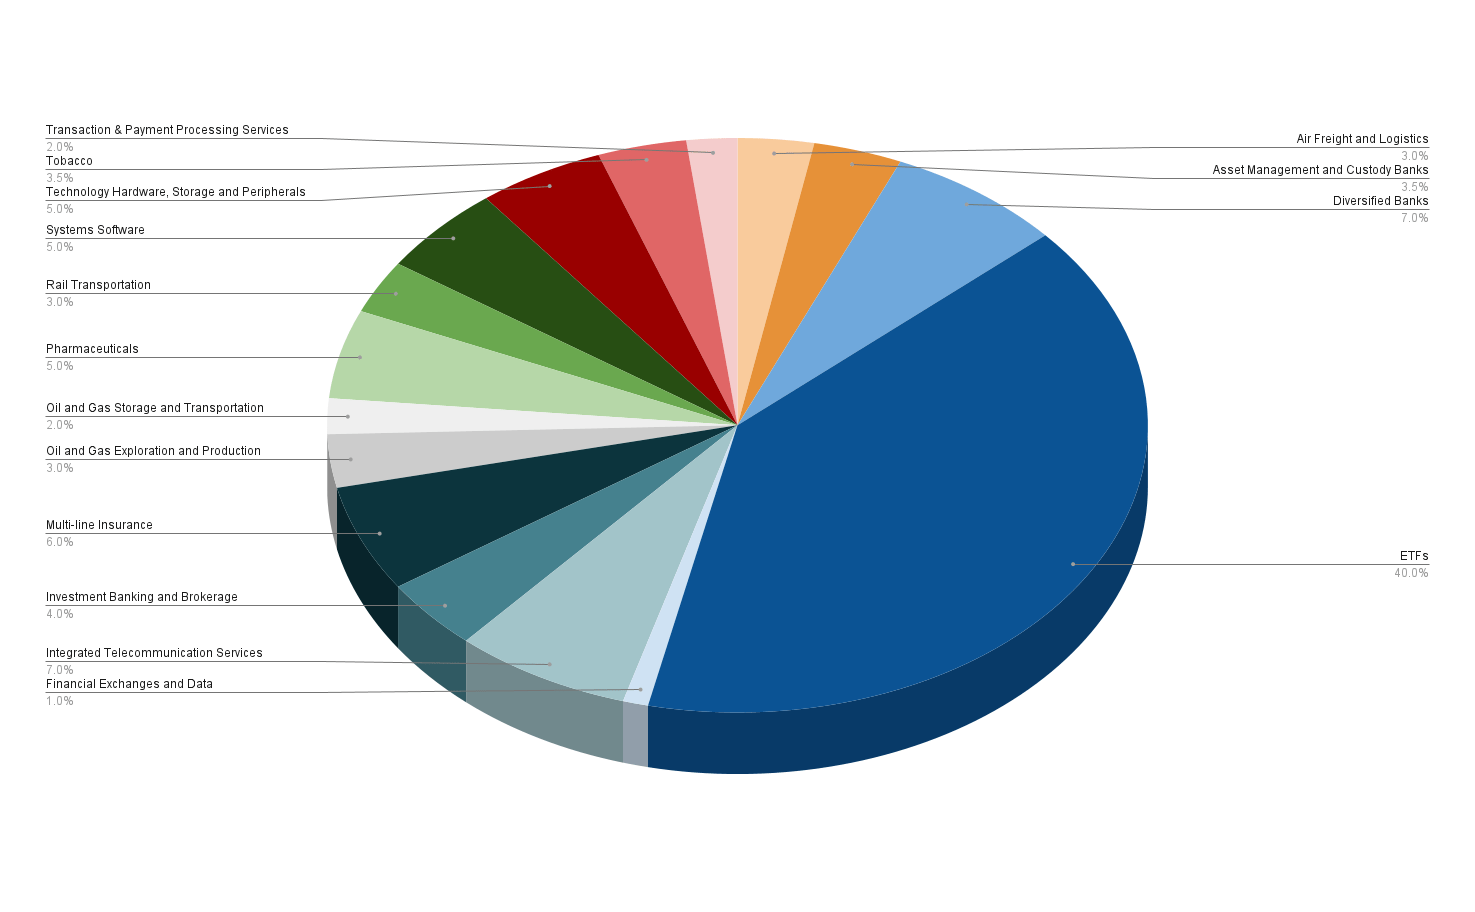
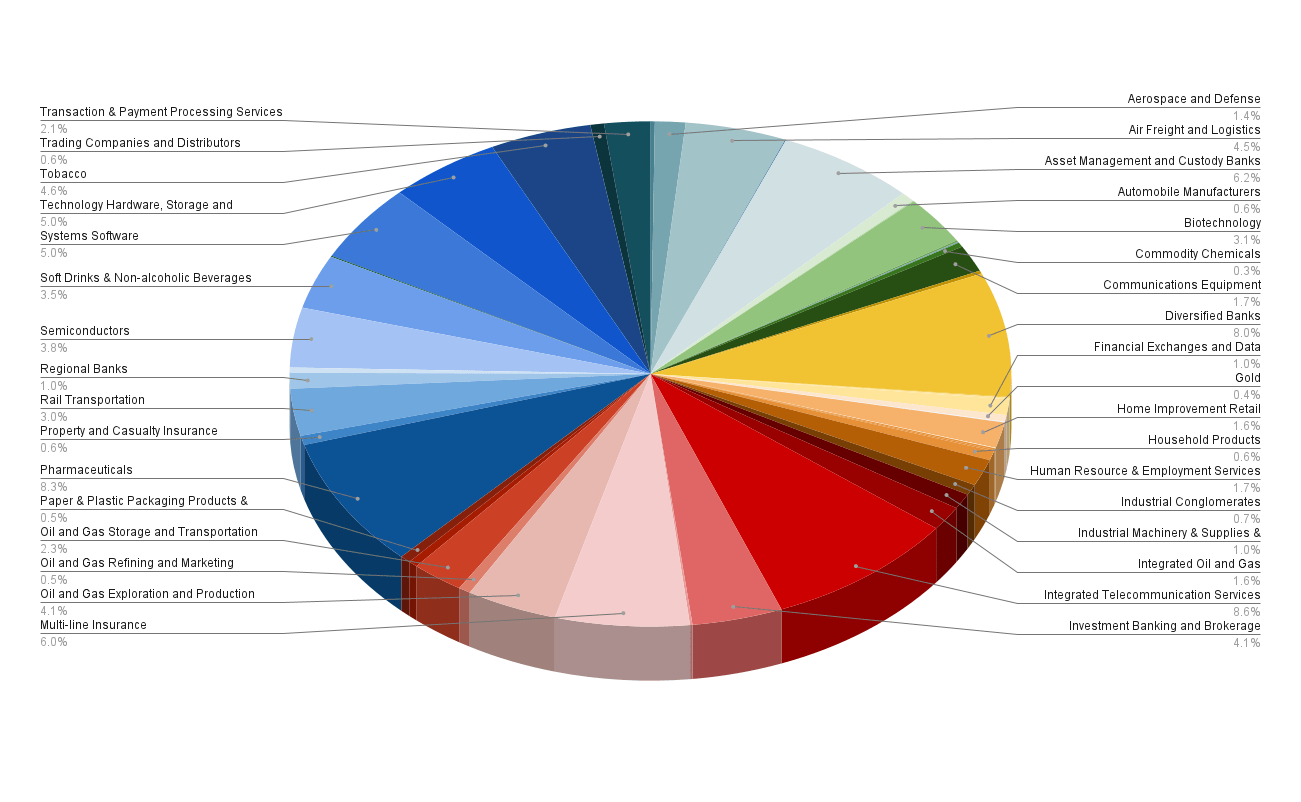
Illustration of the Portfolio Allocation per Industry when allocating the ETF among the Industries it is invested in
In the graphic below you can see the portfolio allocation per Industry when allocating the ETF among the Industries in which it is actually invested in.
It can be highlighted that the Integrated Telecommunication Services Industry represents the highest proportion of the overall portfolio (8.6%), followed by the Pharmaceuticals Industry (8.31%), the Diversified Banks Industry (7.93%), the Asset Management and Custody Banks Industry (6.19%), and the Multi-line Insurance Industry (6%).
The Systems Software Industry and the Technology Hardware, Storage and Peripherals Industry represent 5% each of the overall portfolio.
The graphic, which you can find below, once again underlines the broad diversification over industries that this investment portfolio offers.
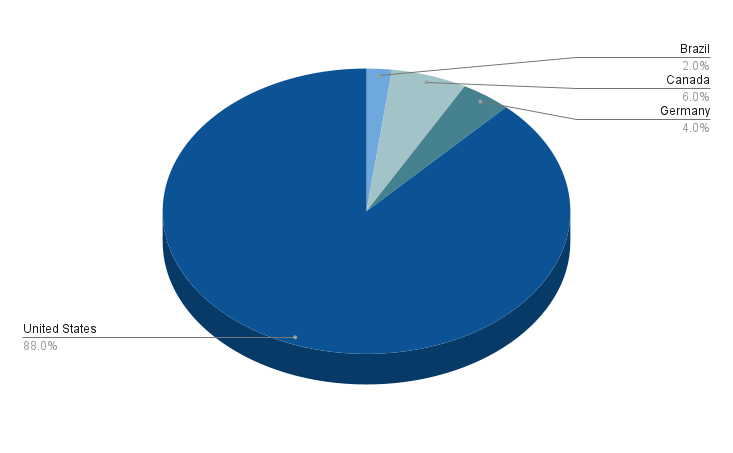
Portfolio Allocation per Country
In addition to a broad diversification over sectors and industries, this investment portfolio also shows a broad diversification over countries. The United States is the country where most of the companies come from (88%).
The remaining 12% are from companies outside the United States: 6% are from Canada (Canadian Natural Resources and The Bank of Nova Scotia each representing 3% of the overall portfolio), 4% are from Germany (Allianz), and 2% are from Brazil (BB Seguridade Participações S.A.).
Illustration of the Portfolio Allocation per Country
How to achieve an even Broader Diversification
If you would like to achieve an even broader diversification than this investment portfolio offers , you might consider invest ing in an additional ETF: you could take a closer look at the iShares Core Dividend Growth ETF (NYSEARCA: DGRO ), since it provides you with a relatively attractive Dividend Yield [TTM] of 3.37% and a Dividend Growth Rate [CAGR] of 10.32% over the past 5 years.
In case you ask yourself if it makes sense to only invest in SCHD, I would like to highlight some advantages of picking stocks individually over only investing in ETFs:
- It provides your portfolio with more individuality and flexibility.
- You can protect your investment portfolio against the next stock market crash by adding companies with a low Beta Factor (an example of a company with a low Beta Factor would be Johnson & Johnson, which is part of this portfolio).
- You can overweight industries with which you are more familiar and you can avoid others you do n't want to invest in.
- You can select stocks which you think are able to beat the market or you can select ones to raise the Weighted Average Dividend Yield or Weighted Dividend Growth Rate of your investment portfolio.
- You can also achieve an even broader geographical diversification of your portfolio.
In my article 10 Dividend Stocks To Show The Advantages Of Investing In Individual Stocks Over ETFs I discuss the advantages of the selection of stocks over ETFs in greater detail.
Conclusion
In this article I have shown how you could build an investment portfolio by combining one ETF (the Schwab U.S. Dividend Equity ETF) with high dividend yield and dividend growth companies.
Through the allocation of this investment portfolio, the goal of achieving a broad diversification over countries, sectors and industries was reached.
Furthermore, this investment portfolio provides you with a Weighted Average Dividend Yield [TTM] of 3.69%, and the selected picks have shown a Weighted Average Dividend Growth Rate [CAGR] of 11.60% over the past 5 years.
These metrics indicate that this portfolio can provide you with a significant additional income via dividends from today, while it should be able to increase this amount year over year.
Implementing this investment strategy that combines dividend income and dividend growth allows you to be more independent from strong price fluctuations of the stock market while, at the same time, helping you to steadily increase your wealth.
Author's Note: Thank you very much for reading and I would appreciate hear ing your opinion on this investment portfolio and its allocation! Do you own or plan to acquire one of the selected picks? Any suggestion to improve my analyses is much appreciated! Thank you!
For further details see:
How To Allocate $25,000 Among My Top 20 Dividend Income Stocks For June 2023