KSA - How To Beat The Market With 2022's Inflation-Resistant Portfolio - Inspired By Aswath Damodaran
Summary
- Aswath Damodaran is an investing and finance authority on valuation, among many other things.
- In a 2022 podcast, he provides a masterclass in inflation, some lessons in history, and potential ways to protect your portfolio this time around.
- In this piece, I highlight some of his key points, add some commentary, and test them to see how/if they have provided inflation protection this year.
- I designed and share an ETF strategy with several of Damodaran's inflation protection points.
One of my favourite podcasts of 2022 was Patrick O’Shaughnessy’s “Invest Like the Best”, when he interviewed Aswath Damodaran on the episode entitled “Making Sense of the Market” , released 31 May 2022. Damodaran covers his thoughts on inflation, of course valuation and ESG.
Damodaran is a household name in finance. As a Professor of Finance at NYU’s Stern School of Business, he is best known for detailing his approach to valuation, and his very direct communication style.
In the podcast, Damodaran offers many insights into inflation, what it is, how to potentially position one’s portfolio, and many other thoughts on ESG and of course valuation.
For this piece, I wanted to focus on his different takes on the new inflationary environment we are currently in. It has been 6 months since the interview, and I’ve tested some of his insights to see if they have materialized, or if they even apply to the current regime.
I was so captivated by Damodaran’s points that I designed a simple ETF strategy that capture his main points, which has beaten the market in 2022.
As noted above, Damodaran is a very succinct thinker, and communicates with such precision that I will quote him directly from the interview, and follow up with some stats on how the market has behaved on the given point.
I would encourage readers to listen to the entire podcast – there are many nuggets here, not only on just inflation, but history of the market, and some very forward thinking tips.
Inflation – An Overview
Damodaran explains how inflation impacts markets:
To understand inflation, I think we've got to break it down into two components. Now, one is what I call expected inflation . Expected inflation is something that we can build into our financial assets. So, if you're buying a bond, if you expect inflation to be 5%, you set the coupon rate at seven or 8% to cover inflation. Expected inflation to me is the more benign part of inflation. The part of inflation that's deadly is unexpected inflation , which is inflation coming in higher or lower than expected.
Source, and for all quotes
He continues:
When inflation comes in below expectations, as a bondholder, you're happy because you set coupon rates at 7%, and inflation is now at 2 or 3%. That actually spreads across all financial assets. When inflation comes in above expectations , it's devastating, because you never had a chance to build it into prices, you have a mad scramble going on adjusting prices to reflect the new inflation. What does that mean with bonds? You got to mark down the price of the bond because a coupon rate is not high enough. With stocks, the same phenomenon plays out in a more subtle way. With stocks, at least you get a chance to adjust your cash flows, unlike bonds, so the effect can vary across stocks. It's unexpected inflation that is so deadly .
This theme of expected vs unexpected is an underlying force in many aspects of finance. A company unexpectedly beating earnings, an unexpected deal, unexpected news event, etc. can move a stock abruptly both positively or negatively.
Here he describes the similarities and differences in inflation between the 1970s & 1980s to today:
We talk about the seventies as a high inflation period, and it was. The eighties were also a high inflation period if you look at the average inflation rate. But here's the difference. In the seventies, unexpected inflation was always positive, which meant inflation came in consistently above expectations. In the eighties, inflation was high, but towards the second half of the decade, inflation came in lower than expectations.
Damodaran continues that most investors today have very little real experience with inflation, and have not lived through it, but rather, “the only inflation they've known is low and stable inflation”, and for this reason the “unexpected inflation” described above can be so potentially damaging.
As he continues later in the interview:
I think the that the lesson from the seventies and the eighties is there’s really no safe spot among financial assets, but among financial assets, there are relatively less damaged vs more damaged assets.
Inflation – Portfolio Considerations
Damodaran discusses several types of assets and industries that have traditionally been less impacted by inflation in the past. I will summarize 6 of these points here.
1. On Small Cap and “Low ‘P’” stocks:
In the 70’s for instance, you found low ‘P’ stocks, small cap stocks did much better than high P stocks. So, in a sense, if you think about this as a very lazy categorization of value vs growth and the small cap premium, much of the small cap premium that people keep talking about in valuation was earned in the 1970s.
Let’s see how this parallel has panned out this year. The equity curves below compare both the S&P 500 ( SPY ) and the small cap value ETF IJS :
Where SPY has returned nearly -18% to date, IJS has limited the damage to -11.2%. Not too bad; it will be important to watch how this pans out in 2023, but so far there may be some edge in small cap value in our current inflationary period.
2. On Smaller & Younger Companies
So, for whatever reason, small cap companies had more flexibility to adjust inflation, and there’s a reason why the more established you are as a company, the more your business model has already been set, the more adjustment is involved when inflation hits you, because you got to change the way you do business. I think the that the lesson from the seventies and the eighties is there’s really no safe spot among financial assets, but among financial assets, there are relatively less damaged vs more damaged assets.
For this test, we’ll use the Russell 3000 ( IWV ) universe as it contains a greater number of stocks than SPY. We’ll look at this group of stocks from two angles, both in term of age (years being public), and market cap.
In terms of age, we’ll classify young companies as 5 years being public or less, middle age as 5-20 years, and mature as greater than 20 years.
Over the last year, the R3000 has returned -19%. In comparison, our various age groups have performed as follows in the last year. To check for any skew based on tech sell-off and concentration, the number of tech stocks per group is included in parentheses.
- <5 years, 565 stocks (93 tech, 16%), -42%
- 5-20 years, 784 stocks (115 tech, 15%) -26%
- >20 years, 1450 stocks (143 tech, 10%), -9.8%
Using these age groups, we actually see the opposite of what Damodaran suggested; it has been those older mature companies that have been able to weather the inflationary storm better than the younger companies. Arguably the younger stocks could have a higher concentration in tech (which has suffered -40% in the last year), however only 16% of the 565 stocks are tech, compared to 15% & 10% for the mid and mature companies, respectively.
In terms of market cap, we’ll break down the R3000 into small and microcap (less than $1B market cap), midcaps $1B to $10B, and large caps greater than $10B. Latest 1 year returns are as follows:
- Small caps, <$1B, -28.7%
- Mid caps, >$1B <$10B, – 19.8%
- Large caps, >$10B, -16%
We see a similar trend with those larger stocks suffering less than the smaller stocks, as we saw above with more mature versus younger companies.
Let’s see if this trend continues into 2023.
3. On Company Pricing Power and Adjusting for Inflation
Damodaran offers two suggestions here:
…you need pricing around the sense of not just setting prices, but being able to adjust prices quickly. Very few companies have that degree of pricing power, because that requires that your product be incredibly non-discretionary , that people buy it no matter what the price you charge , that the competition behaves the way you do, because you can’t unilaterally just adjust prices if you’re in an environment.
And specifically for utilities:
I’ll give you the example, utilities should be relatively protected against inflation. The reason is that there regulatory commissions that should allow you to set prices that incorporate inflation because you’re supposed to earn a return equity roughly equal to your cost of equity. The problem is regulatory commissions are composed of people appointed by politicians. So inflation is 12%, you know the right thing to do is pass on that 12%. “Well, why don’t’ we set it at 4 or 6%? People can’t afford the 12%” So, during high inflationary periods, even though in theory, your prices should keep up with inflation as a regulated company, in practice, they don’t.
First, let's look at the broad sector group of Consumer Non-Cyclicals as a proxy for non-discretionary stocks. As a group, this sector has more or less matched the R3000:
A much different picture emerges when you look at the underlying subsectors however. Below are the 4 subsectors, with the number of stocks per group and 1 year returns:
- Food and Staples Retail, 46 stocks, -26%
- Food and Tobacco Production, 65 stocks, -8%
- Household Products, 35 stocks, -31%
- Household Services, 19 stocks, -15%
Of these groups, which product(s) are “incredibly non-discretionary, that people buy it no matter what the price you charge” as Damodaran describes? Cigarettes and alcohol seem to fit that description, so while still a negative return, is the highest performing group “Food and Tobacco Production” of the entire sector by a wide margin. For those that wish to maintain an ESG component to their portfolio, this may not be acceptable, however they fit well into Damodaran's point above.
To Damodaran’s 2 nd point above regarding utilities, these businesses have “regulatory commissions that should allow you [the utility] to set prices that incorporate inflation because you’re supposed to earn a return equity roughly equal to your cost of equity”. He notes that this only happens in theory, as if prices get too high politicians get involved and reduce to a cost acceptable to society (not necessarily in line with inflation).
Still, let’s check this assumption. This is a smaller group, only 65 utility stocks in the R3000 universe, most of which are energy related (electric, natural gas and others) and the minority being water utilities.
All utility stocks in the R3000 universe have performed as follows in the last year:
This group has outperformed to the greatest degree of all of the groups so far, not only beating the broader R3000 index, but also achieving positive returns over the year.
4. Today’s potentially most inflation-proof stocks
In my portfolio, this is the first time I have 5 of the 6 [ FANGAM ] stocks, everything but Netflix. One of the reasons for that is when I look at those companies, I see the capacity to that their products and services, they’re actually done a very good job of making the products and services less discretionary , the have cost structures that are incredibly flexible, their investments tend to be short term and reversible . In terms of risk, they’re low debt and very little failure risk , things that you worry about with inflation, because if you’re a heavy indebted company and there’s big failure risk, swings and inflation can very quickly put you under.
He continues:
…So, when I look for my list of “Hey , these are the things I want in a company”, I find them more in technology companies than I do in old time, brand name, consumer product companies. It’s kind of a shift away from what you might have seen in the early 80s as to where do I go for companies that are best protected against inflation. I think the places you go now are very different than 40 years ago.
These points make a great deal of sense, but if you’ve been following financial headlines at all then it shouldn’t be a surprise that this thesis has not yet played out, nowhere close in fact, as these tech giants have taken the brunt of the sell-off.
The combined 1-year return for holding Facebook ( META ), Apple (AAPL), Google ( GOOG ), Amazon ( AMZN ) and Microsoft ( MSFT ) is shown below:
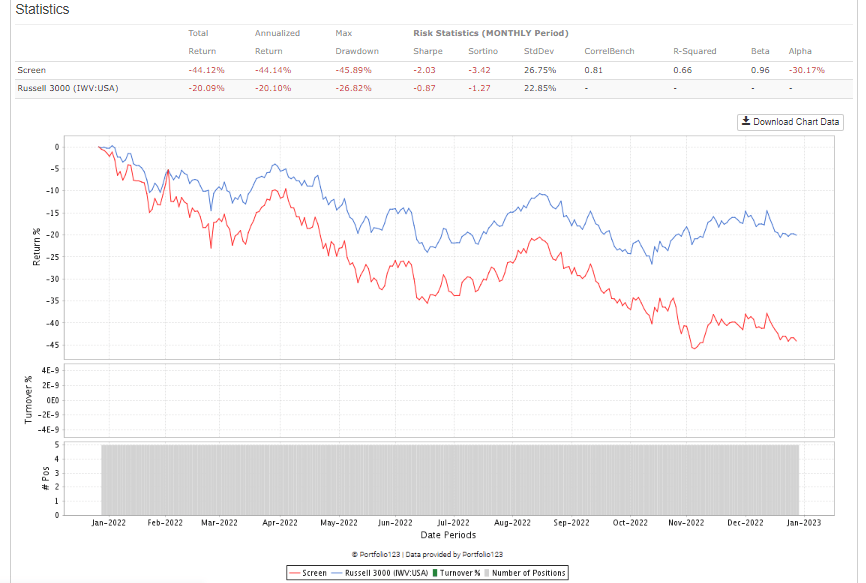
Damodaran’s points on why FANGAM stocks may defy inflation make fundamental sense, however it may take some time for their multiples to normalize before we see this. Let’s see.
5. On Margins & Return on Invested Capital:
To many investors, return on invested capital (or ROIC) is the gold standard for measuring quality and profitability. Conventional wisdom states that ROIC is only effective if it is greater than a company’s cost of capital. In my own experience (and I share this view with many), cost of capital is notoriously difficult to estimate, and requires many assumptions.
Damodaran’s thoughts (although not specifically in context of inflation, but I’ve included here):
The problem with return on invested capital as a metric, it’s designed for mature or declining companies…You can be a great growth company. Its return on invested capital can be [utterly] meaningless. The ROIC if you take Apple is negative. Why? Because the cash actually exceeds a book value of equity and debt. If you take that to mean, hey, the ROI is that Apple takes terrible projects, you’re completely mistreating the number. It’s the denominator that’s negative, not the numerator.
He continues:
For young companies, the ROIC becomes almost meaningless…if you have an investment strategy built around ROIC…this is going to leave you with a portfolio of older and declining firms , and some of them will be value traps, because what you’re capturing with the ROIC is your past , that this company used to have great investments…ROIC is a backward looking accounting number to keep that in perspective when your investment strategy is driven entirely by ROIC.
On managing cost of capital:
It tells me that you’re growing old as a company. You’re a young company and your projects make 35%, who cares what your cost of capital is?...When you see a focus on capital structure, you’re already conceding that your best days are behind you. Nothing wrong with that.
To sum up, the point is that margins really do matter here; if you’re a younger growth company, provided you have high margins, ROIIC has little relevance. For older mature companies, ROIIC may be more appropriate.
Let’s test to see if any of these measures have stood out over the last year. We’ll take the top 20% ranked stocks by different profitability/margin measures (the higher the better):
- Gross margin, TTM, -28%
- Net profit margin, TTM, -16%
- Free Cash Flow Margin, TTM, -17%
- ROIIC, TTM, -21%
At least over the past year, none of these measures have offered any protection from drawdown. ROIIC essentially matches the broad R3000 index, where there has been some negligible protection from high net margin and free cash flow margins. High gross margins have been a terrible bet this year.
Should quality not count for something, especially in this environment? Damodaran hit the nail on the head with his comment that ROIC (and other quality measures) are “backward looking accounting numbers”. It could very well be that these high margin firms of the last year have had their margins most impacted by inflation, and are therefore hard hit by inflationary pressures.
6. On Geography
Spread your bets across geographies. European stocks might not have done as well as US stocks in the last decade, but they might be the place to be if inflation is coming back more in the US than in Europe.
This last point could be applied to more than just Europe, but rather any country experiencing lower inflation than the US or Canada.
According to the World Population Review , as of January 2022 the countries with the lowest inflation were as follows:
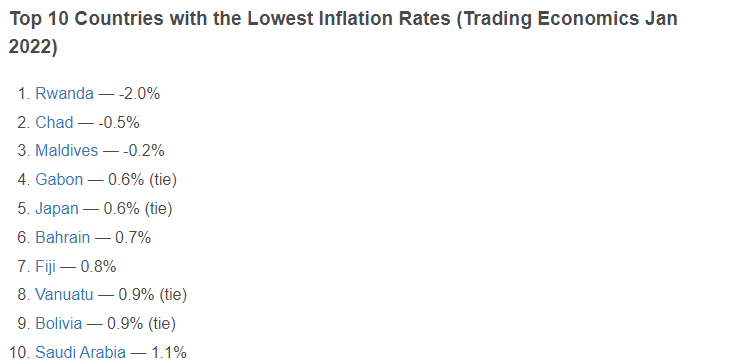
While some of these rock bottom inflation rates may make your proverbial investing mouth water, some of these countries are tiny, and can be difficult to invest in directly. Of course, while inflation may be low, there may be countless other risks to consider. Fortunately, there are many ETFs available on the market to get some exposure to said countries.
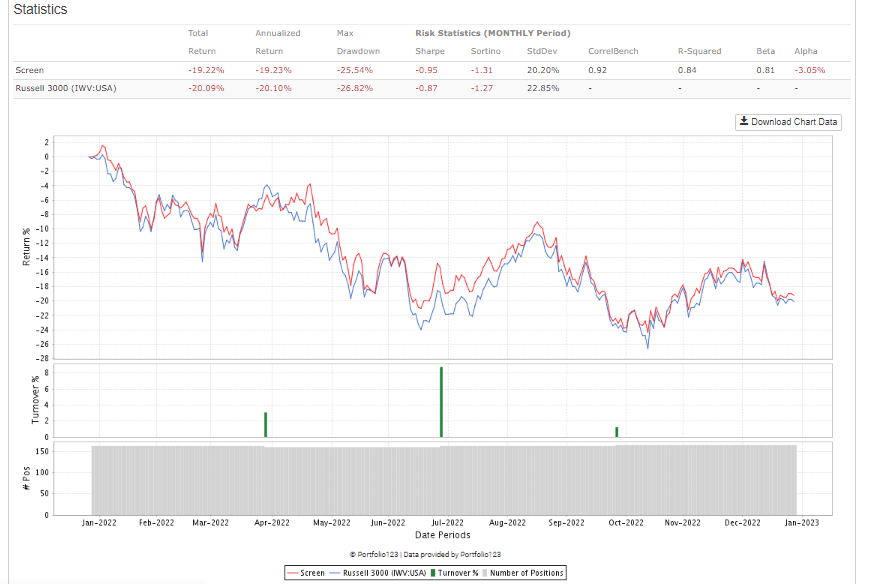
Below are some country ETFs for the listed nations (or their continent or broader geography), and their 1 year returns:
- EWJ – Japan, -19%
- KSA – Saudi Arabia, -9%
- EMFM – Next Emerging & Frontier ETF, -10.3%
- AFK – Africa (Rwanda, Chad, Gabon), -18.5%
- ILF - Latin America (Bolivia), -1.8%
- EWA – Australia (Fiji, Vanuatu), -11%
- EWQ – France (also reporting less inflation than US), -14.3%
To simply take all of the above ETFs at equal weight, quarterly rebalance over the last year, the equity curve is as follows:
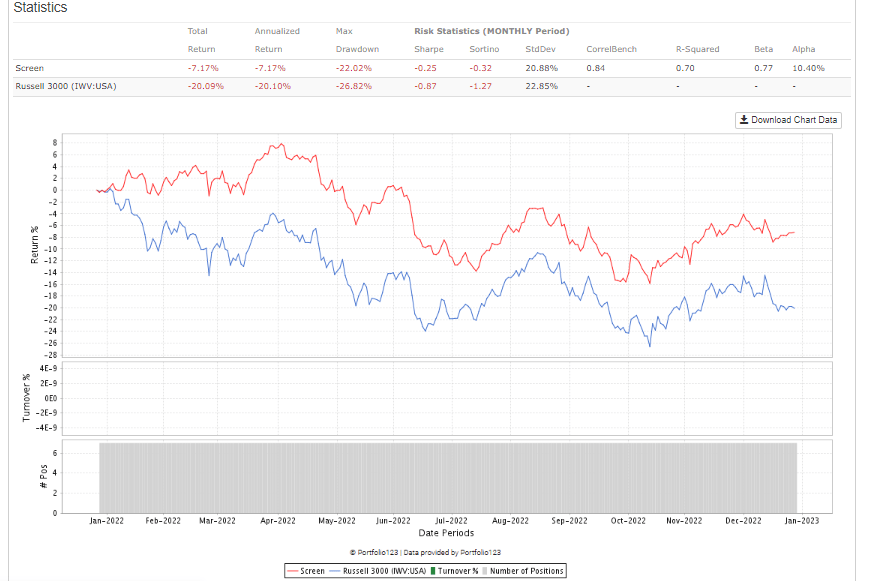
Still negative return, but significantly improved over the US based R3000 index with positive alpha.
This is a very interesting trend, and something to monitor going forward.
Putting it All Together
Damodaran has provided some interesting tips on how to navigate high inflationary periods.
To sum up our findings on the inflationary year of 2022:
- Small cap and low ‘P’ stocks should perform – in play
- Younger companies should be more agile to navigate – the opposite is happening, at this point the older and larger, the better
- Very non-discretionary and regulated utilities should outperform – in play
- FANGAM stocks should be well positioned for inflation – not yet
- ROIIC is only relevant for older, mature companies – younger companies should focus on higher margins – not playing out for inflation yet
- Consider other countries with lower inflation – in play
Of the 6 tips offered, 3 appear to be playing out, while the others have not, at least not yet.
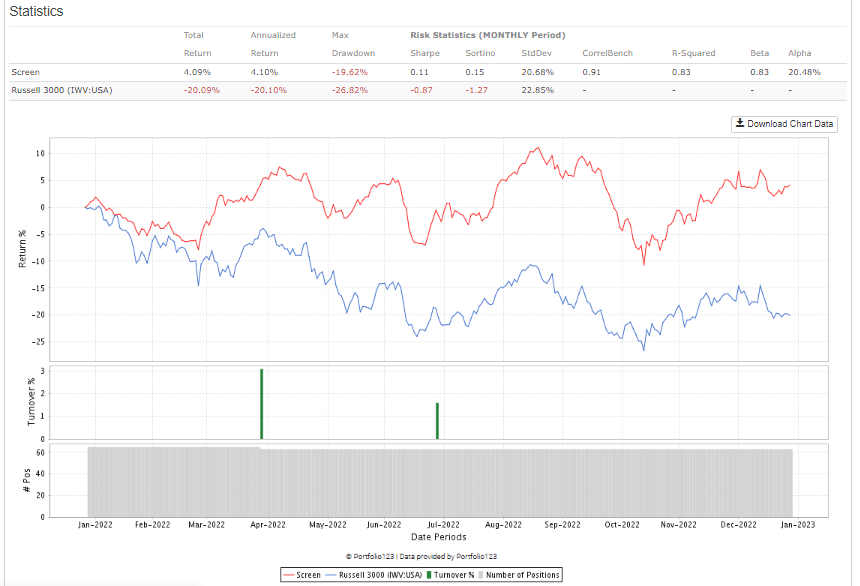
We can combine some of these tips into a simple ETF strategy. Let’s weight the winning strategies (to date) as follows:
- Small cap value, ticker IJS, 33%
- Non-discretionary & regulated utilities ( XLU only, a non-discretionary ETF does not exist), 33%
- Lower inflation geographies, 33%
- EWJ – Japan
- KSA – Saudi Arabia
- EMFM – Next Emerging & Frontier ETF
- AFK – Africa (Rwanda, Chad, Gabon)
- ILF - Latin America (Bolivia)
- EWA – Australia (Fiji, Vanuatu)
- EWQ – France
Holding these ETFs, with quarterly rebalance has resulted in the following equity curve over the past year:
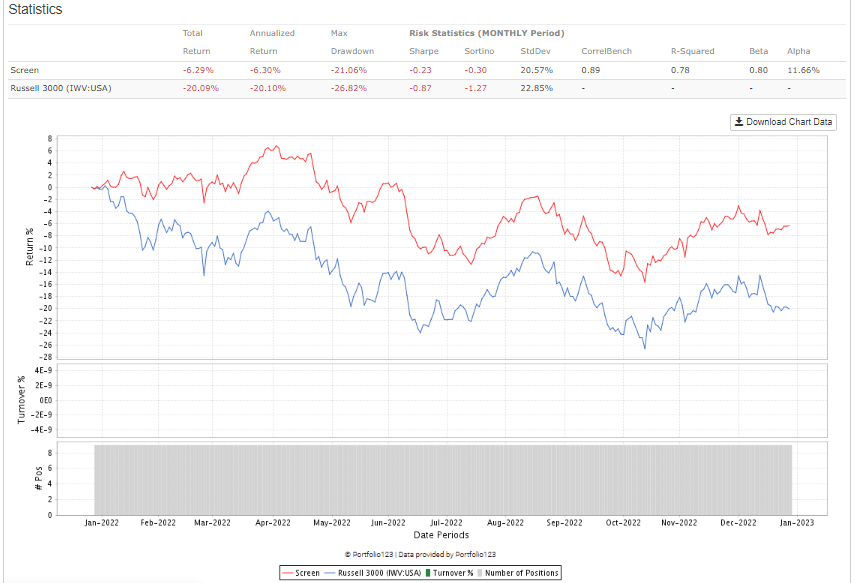
While a negative overall return, but this strategy has significantly improved performance over the broader R3000 index, with much higher Sharpe Ratio and positive alpha.
It will be interesting to see how this plays out in 2023, or if some of Damodaran’s other tips start working out. I’ll provide an update in the first quarter of ’23.
Until then, Happy Investing!
For further details see:
How To Beat The Market With 2022's Inflation-Resistant Portfolio - Inspired By Aswath Damodaran