TSLA - How To Build A Dividend Portfolio Allocating $100000 Among November's Top 20 Dividend Companies
2023-11-23 18:00:00 ET
Summary
- I will show you how you can build a dividend portfolio by allocating $100,000 among November’s top 20 dividend companies as well as one ETF.
- I will conduct a deep risk analysis to demonstrate the reduced risk level of this portfolio and the elevated likelihood of it achieving attractive investment outcomes over the long term.
- This dividend portfolio provides you with a weighted average dividend yield [TTM] of 4.05% and a weighted average dividend growth rate [CAGR] of 10.58%, combining dividend income and dividend growth.
Investment Thesis
In today’s article, I will guide you through the construction of a dividend portfolio by allocating the amount of $100,000 among November’s top 20 dividend income companies.
I will conduct a comprehensive risk analysis to show you the portfolio’s extensive diversification over companies, sectors, and industries, in addition to its geographical diversification, ensuring a reduced risk level.
Achieving a reduced portfolio risk level is crucial for any type of investor, since it significantly increases the likelihood of achieving attractive investment outcomes.
I have selected Schwab U.S. Dividend Equity ETF (NYSEARCA: SCHD ) as a key position of this carefully selected and well-balanced dividend portfolio, accounting for 35% of the overall investment portfolio.
By allocating SCHD across the companies, sectors, and industries it is invested in, I will demonstrate that this portfolio provides you with an extensive diversification, and a reduced company-specific, sector-specific, industry-specific, and geographical-specific concentration risk.
I will further show you strategies to reduce the portfolio’s risk level even more. In addition to that, I will demonstrate how you could integrate a company such as Tesla (NASDAQ: TSLA ) (which comes attached to a higher risk level) into this dividend portfolio while still maintaining an optimized risk/reward profile.
The portfolio I am presenting today shows an attractive Weighted Average Dividend Yield [TTM] of 4.05%, and a Weighted Average Dividend Growth Rate [CAGR] of 10.58% over the past 5 years, blending dividend income and dividend growth.
The following are the 10 high dividend yield companies I have selected for the month of November:
- Altria Group ( MO )
- United Parcel Service ( UPS )
- Verizon Communications ( VZ )
- Pfizer ( PFE )
- Canadian Imperial Bank of Commerce ( CM )
- Axa (AXAHY) (AXAHF)
- Morgan Stanley ( MS )
- Iberdrola (IBDSF)
- Ares Capital ( ARCC )
- Suncor Energy ( SU )
I have selected the following 10 dividend growth companies for the month of November:
- Nike (NYSE: NKE )
- BlackRock (NYSE: BLK )
- Apple (NASDAQ: AAPL )
- Visa (NYSE: V )
- Bank of America (NYSE: BAC )
- American Express (NYSE: AXP )
- Microsoft (NASDAQ: MSFT )
- Itaú Unibanco (NYSE: ITUB )
- AbbVie (NYSE: ABBV )
- Crown Castle (NYSE: CCI )
Overview of the Selected Companies/ETFs for the Month of November
| Symbol |
| Company Name |
| Sector |
| Industry |
| Country |
| Market Cap |
| Dividend Yield [TTM] |
| Payout Ratio |
| Dividend Growth 5 Yr [CAGR] |
| P/E GAAP [FWD] |
| Net Income Margin |
| Allocation |
| Amount in $ |
| PFE |
| Pfizer |
| Health Care |
| Pharmaceuticals |
| United States |
| 166.46B |
| 5.43% |
| 56.79% |
| 4.95% |
| 18 |
| 15.29% |
| 3% |
| 3,000.00 |
| VZ |
| Verizon |
| Communication Services |
| Integrated Telecommunication Services |
| United States |
| 150.13B |
| 7.28% |
| 54.41% |
| 2.02% |
| 7.98 |
| 15.58% |
| 3% |
| 3,000.00 |
| UPS |
| United Parcel Service |
| Industrials |
| Air Freight and Logistics |
| United States |
| 117.66B |
| 4.40% |
| 64.25% |
| 12.23% |
| 16.37 |
| 9.19% |
| 3% |
| 3,000.00 |
| MO |
| Altria |
| Consumer Staples |
| Tobacco |
| United States |
| 70.78B |
| 9.33% |
| 76.77% |
| 5.85% |
| 8.69 |
| 42.60% |
| 4% |
| 4,000.00 |
| CM |
| Canadian Imperial Bank of Commerce |
| Financials |
| Diversified Banks |
| Canada |
| 34.83B |
| 6.53% |
| 53.36% |
| 4.48% |
| 9.67 |
| 22.51% |
| 4% |
| 4,000.00 |
| AXAHY |
| AXA |
| Financials |
| Multi-line Insurance |
| France |
| 64.73B |
| 6.14% |
| - |
| 8.03% |
| - |
| 6.52% |
| 2% |
| 2,000.00 |
| MS |
| Morgan Stanley |
| Financials |
| Investment Banking and Brokerage |
| United States |
| 123.64B |
| 4.08% |
| 55.11% |
| 24.19% |
| 13.37 |
| 18.37% |
| 3% |
| 3,000.00 |
| IBDSF |
| Iberdrola |
| Utilities |
| Electric Utilities |
| Spain |
| 71.00B |
| 4.57% |
| - |
| 0% |
| 15.53 |
| 8.58% |
| 2% |
| 2,000.00 |
| ARCC |
| Ares Capital |
| Financials |
| Asset Management and Custody Banks |
| United States |
| $11.17B |
| 9.75% |
| 80.67% |
| 4.65% |
| 7.66 |
| 50.37% |
| 4% |
| 4,000.00 |
| SU |
| Suncor Energy |
| Energy |
| Integrated Oil and Gas |
| Canada |
| 42.97B |
| 4.62% |
| 36.58% |
| 7.33% |
| 8.25 |
| 16.26% |
| 3% |
| 3,000.00 |
| AAPL |
| Apple |
| Information Technology |
| Technology Hardware, Storage and Peripherals |
| United States |
| 2.90T |
| 0.51% |
| 15.36% |
| 6.15% |
| 28.52 |
| 25.31% |
| 5% |
| 5,000.00 |
| MSFT |
| Microsoft |
| Information Technology |
| Systems Software |
| United States |
| 2.75T |
| 0.75% |
| 26.70% |
| 10.12% |
| 33.17 |
| 35.31% |
| 4% |
| 4,000.00 |
| NKE |
| Nike |
| Consumer Discretionary |
| Footwear |
| United States |
| 161.49B |
| 1.26% |
| 41.98% |
| 11.20% |
| 28.42 |
| 9.82% |
| 3% |
| 3,000.00 |
| BAC |
| Bank of America |
| Financials |
| Diversified Banks |
| United States |
| 219.05B |
| 3.04% |
| 25.21% |
| 12.03% |
| 8.18 |
| 31.52% |
| 4% |
| 4,000.00 |
| V |
| Visa |
| Financials |
| Transaction & Payment Processing Services |
| United States |
| 496.04B |
| 0.75% |
| 21.35% |
| 16.27% |
| 25.16 |
| 52.90% |
| 3% |
| 3,000.00 |
| AXP |
| American Express |
| Financials |
| Consumer Finance |
| United States |
| 112.50B |
| 1.46% |
| 21.76% |
| 10.01% |
| 13.72 |
| 14.74% |
| 3% |
| 3,000.00 |
| BLK |
| BlackRock |
| Financials |
| Asset Management and Custody Banks |
| United States |
| 98.93B |
| 2.80% |
| 53.66% |
| 11.78% |
| 18.4 |
| 30.66% |
| 4% |
| 4,000.00 |
| ITUB |
| Itaú Unibanco |
| Financials |
| Diversified Banks |
| Brazil |
| 54.46B |
| 2.20% |
| - |
| 12.83% |
| 8.59 |
| 26.66% |
| 2% |
| 2,000.00 |
| ABBV |
| AbbVie |
| Health Care |
| Biotechnology |
| United States |
| 244.69B |
| 4.30% |
| 49.66% |
| 10.52% |
| 26.43 |
| 11.81% |
| 3% |
| 3,000.00 |
| CCI |
| Crown Castle |
| Real Estate |
| Telecom Tower REITs |
| United States |
| 41.48B |
| 6.06% |
| 84.92% |
| 8.31% |
| 28.2 |
| 21.96% |
| 3% |
| 3,000.00 |
| SCHD |
| Schwab U.S. Dividend Equity ETF |
| ETF |
| ETF |
| United States |
| 3.67% |
| 13.39% |
| 35% |
| 35,000.00 |
| 4.05% |
| 10.58% |
| 100% |
| 100,000.00 |
Source: The Author, data from Seeking Alpha
Risk Analysis
Risk Analysis of the Portfolio Allocation per Company/ETF
Primary Objective: To Demonstrate That the Portfolio Is Attractive in Terms of Risk and Reward
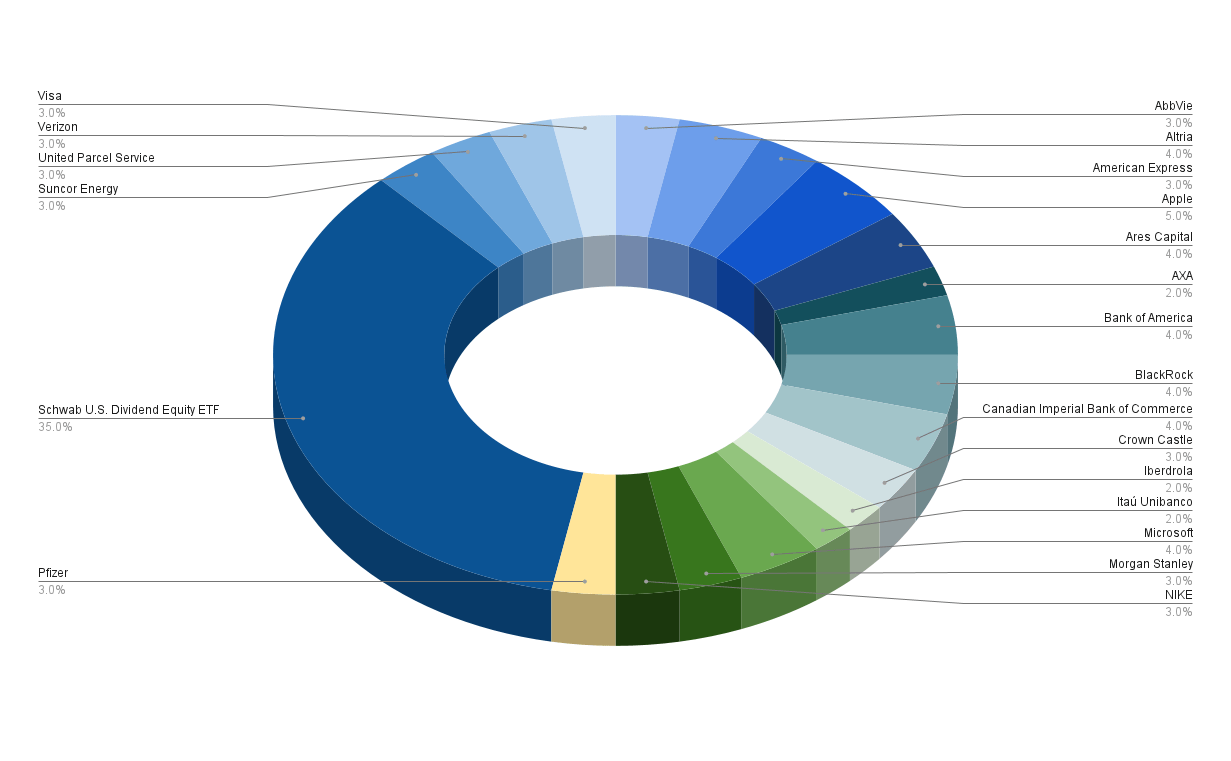
At 35%, SCHD constitutes the largest overall proportion of this dividend portfolio.
The reason for including SCHD is to achieve a desirable portfolio mix of dividend income and dividend growth, while, at the same time, contributing to the portfolio’s attractive risk/reward balance.
The following companies represent the highest individual positions of the overall portfolio:
- Apple (5%)
- Altria (4%)
- Ares Capital (4%)
- Bank of America (4%)
- BlackRock (4%)
- Canadian Imperial Bank of Commerce (4%)
- Microsoft (4%)
These companies account for the largest proportion of this portfolio due to the fact they provide investors with an attractive risk/reward profile.
This means the risk associated with them is comparatively low, while the potential for an attractive Total Return is relatively high. A low risk level implies that investors can obtain attractive investment outcomes with a greater likelihood. Therefore, it is essential to persistently minimize the risk level of your investment portfolio.
I would like to highlight what I mentioned in one of my previous portfolio allocation articles :
In my opinion, the main reason for people losing money when investing is a lack of awareness of the risk factors that come attached to an investment. Companies with a high risk-level often dominate their overall portfolio, which implies a high level of risk for investors.
For the reasons mentioned above, we should continuously ensure that the companies with the highest proportion of our overall portfolio are the most attractive in terms of risk/reward. This strategy allows us to achieve an attractive Total Return with a high probability while continuously decreasing the probability of losing our invested money.
The composition of this investment portfolio, in which no single company accounts for more than 5%, highlights its reduced risk level. This strategic diversification further ensures to enhance the likelihood of achieving attractive investment outcomes.
The following companies represent the lowest proportion of the overall portfolio:
- Axa (2%)
- Iberdrola (2%)
- Itaú Unibanco (2%)
These companies come attached to a significantly higher risk level than those that have the highest proportion of the overall portfolio (of which were listed earlier). The elevated risk level of these companies implies the existence of a greater number of uncontrollable factors, which can potentially have a negative effect on our investment results. This implies that the likelihood of achieving favorable investment outcomes is lower when compared to the companies with the highest proportion of this portfolio.
Companies such as Axa, Iberdrola and Itaú Unibanco are subject to additional risk factors, such as currency fluctuations or macroeconomic factors, which could have a negative impact on our investment outcomes. By allocating a smaller proportion of our portfolio to those with a higher risk level, we ensure to mitigate the impact that could be caused by one of these companies underperforming.
This strategy helps us to safeguard the Total Return of this dividend portfolio from negative impacts, once again increasing the probability of excellent investment results.
The graphic below illustrates the portfolio allocation per Company/ETF:
Source: The Author, data from Seeking Alpha
Risk Analysis of the Company Allocation When Allocating SCHD to the Companies It Is Invested In
Primary Objective: To Show That the Portfolio Has a Reduced Company Specific Concentration Risk
The dividend portfolio is extensively diversified, even when allocating SCHD to the companies it is invested in, thus ensuring a reduced company specific concentration risk. This means that we are once again increasing the likelihood of achieving attractive investment outcomes.
The graphic below shows the company allocation of this dividend portfolio when allocating SCHD to the companies it is invested in: only one company (BlackRock) exceeds a 5% share of the overall investment, accounting for 5.17%.
Apple is the second largest individual position, accounting for 5% of the overall portfolio.
It is worth noting that both BlackRock and Apple, the two companies that account for the largest proportion of this portfolio, have favorable risk/reward profiles from my perspective.
All other companies represent less than 5% of the overall portfolio. Altria is the third largest position (representing 4.88%), followed by Verizon (4.55%), AbbVie (4.42%), Pfizer (4.30%), and United Parcel Service (4.23%).
Source: The Author, data from Seeking Alpha and Morningstar
The graphic highlights that I have carefully chosen the selected investments, taking into consideration both direct investments in individual companies and indirect investments through SCHD. This careful selection ensures that no single positions account for a disproportionally large share of the overall investment portfolio, even when considering the allocation within SCHD. My selection process helps us to reduce the portfolio's company specific concentration risk, while increasing the probability of positive investment results.
Risk Analysis of the Portfolio Allocation per Sector
Primary Objective: Demonstrate that the Portfolio Has a Reduced Sector Specific Concentration Risk
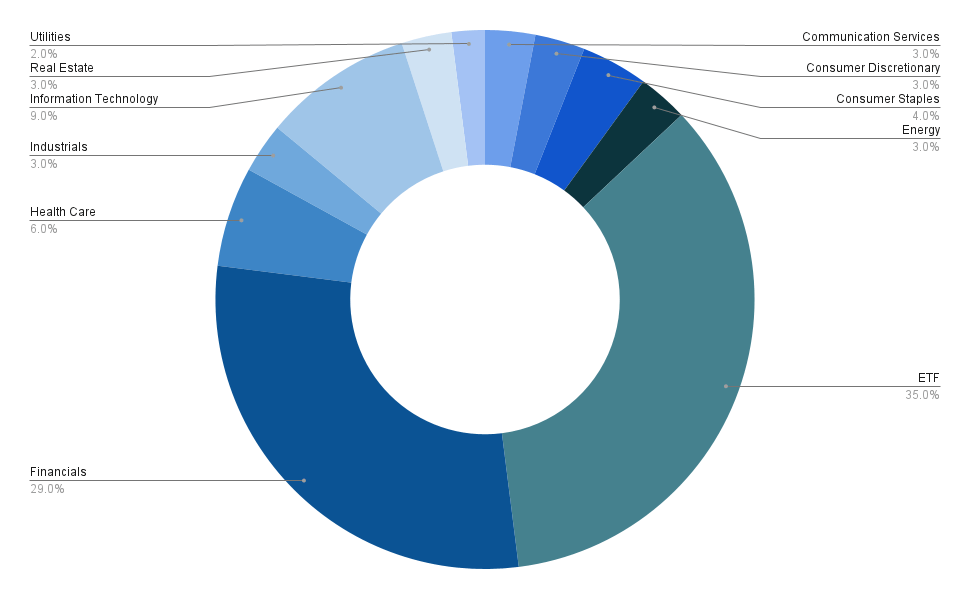
The graphic below shows the portfolio allocation per Sector. The ETF Sector is the largest: SCHD represents 35% of the overall investment portfolio.
Source: The Author, data from Seeking Alpha
The second largest sector is the Financials Sector, which accounts for 29% of the overall portfolio. The Financials Sector is represented by Ares Capital (4%), Bank of America (4%), BlackRock (4%), Canadian Imperial Bank of Commerce (4%), American Express (3%), Morgan Stanley (3%), Visa (3%), Axa (2%), and Itaú Unibanco (2%).
The third largest sector is the Information Technology Sector (with 9%), represented by Apple (5%), and Microsoft (4%).
The fourth largest is the Health Care Sector, accounting for 6% of the overall portfolio. This sector is represented by AbbVie (3%), and Pfizer (3%).
All other sectors each account for less than 5% of the overall portfolio, highlighting the reduced sector specific concentration risk of this dividend portfolio.
While I acknowledge that the relatively large allocation to the Financials Sector may imply an increased risk-level for investors in the short-term, I am confident that this allocation offers investors an appealing risk/reward profile over the long-term. I believe that possible negative impacts on the stock price of any of these companies within the Financials Sector are likely to be temporary and have a reduced impact over the long-term. However, investors that do not aim to invest over the long-term should be aware of this existing sector specific concentration risk evidenced by the large proportion of the Financials Sector.
Below you can find an overview of the different sectors, companies and ETFs that are part of this investment portfolio.
ETFs (35%)
- Schwab U.S. Dividend Equity ETF (35%)
Financials Sector (29%)
- Ares Capital (4%)
- Bank of America (4%)
- BlackRock (4%)
- Canadian Imperial Bank of Commerce (4%)
- American Express (3%)
- Morgan Stanley (3%)
- Visa (3%)
- Axa (2%)
- Itaú Unibanco (2%)
Information Technology (9%)
- Apple (5%)
- Microsoft (4%)
Health Care (6%)
- AbbVie (3%)
- Pfizer (3%)
Consumer Staples (4%)
- Altria (4%)
Communication Services (3%)
- Verizon (3%)
Consumer Discretionary (3%)
- Nike (3%)
Energy (3%)
- Suncor Energy (3%)
Industrials (3%)
- United Parcel Service (3%)
Real Estate (3%)
- Crown Castle (3%)
Utilities (2%)
- Iberdrola (2%)
Risk Analysis of the Portfolio Allocation per Sector When Allocating SCHD to the Sectors It Is Invested In
Primary Objective: Demonstrate that the Portfolio Has a Reduced Sector Specific Concentration Risk Even When Allocating SCHD Across Sectors
In the graphic below you can see the portfolio allocation per sector when allocating SCHD to the sectors it is invested in. Through this allocation, the Financials Sector represents 34.52% of the overall portfolio, while the Information Technology Sector accounts for 13.23%, and the Health Care Sector represents 11.59%.
All other sectors represent less than 10% of the overall portfolio: the Industrials Sector accounts for 9.27%, the Consumer Staples Sector 8.44%, the Energy Sector 6.22%, while the Consumer Discretionary Sector makes up 6.18%.
The Communication Services Sector (4.73%), the Real Estate Sector (2.99%), the Utilities Sector (2.15%), and the Basis Materials Sector (0.68%), account for an even smaller proportion of the overall portfolio.
Source: The Author, data from Seeking Alpha and Morningstar
Since no sector other than the Financials Sector represents more than 15% of the overall portfolio, it can be stated that the portfolio provides investors with a broad diversification over sectors, indicating a reduced sector specific concentration risk.
However, the elevated proportion of the Financials Sector (34.52%) does represent a higher risk level for investors, particularly for those that do not have a long-term investment horizon.
Over the long term, I believe that the Financials Sector, the Information Technology Sector and the Health Care Sector, which account for the highest proportion of the overall portfolio, will provide investors with excellent risk/reward profiles, underscoring my theory to overweight these sectors in a long-term investment portfolio.
Risk Analysis of the Portfolio Allocation per Industry
Primary Objective: To Demonstrate That the Portfolio Has a Reduced Industry Specific Concentration Risk
The graphic below shows the portfolio allocation per industry. Besides the ETF Industry (which accounts for 35% of the overall portfolio), no industry represents more than 10%, once again underscoring the portfolio’s broad diversification and reduced industry specific concentration risk, which in turn ensures a lower risk level.
Source: The Author, data from Seeking Alpha
Besides the ETF Industry, the Diversified Banks Industry (10%), and the Asset Management and Custody Banks (8%) have the largest proportions of the overall investment portfolio.
The Technology Hardware, Storage and Peripherals Industry accounts for 5% of the overall portfolio. The fact that all other industries account for less than 5%, further underscores the portfolio’s extensive diversification and reduced industry specific concentration risk, which implies a reduced risk level of the overall portfolio.
Risk Analysis of the Portfolio Allocation per Country
Primary Objective: To Demonstrate a Reduced Geographic Concentration Risk
The portfolio shows some degree of geographical diversification, thus reducing the geographical concentration risk. At the same time, it maintains its focus to prioritize companies from the United States.
At 87%, the highest proportion of this dividend portfolio is invested in companies located within the United States. Companies from outside account for 13%.
Source: The Author, data from Seeking Alpha
7% of this portfolio is invested in companies from Canada (Canadian Imperial Bank of Commerce accounts for 4% and Suncor Energy 3%).
2% of the portfolio is invested in Brazil, which is represented by Itaú Unibanco. Both France (represented by Axa with 2%), and Spain (represented by Iberdrola, which makes up 2%) account for 2% of the portfolio each.
Source: The Author, data from Seeking Alpha
These metrics confirm that the portfolio aligns with my investment approach of investing the highest proportion into companies from the U.S. while providing investors with geographical diversification, thus ensuring to decrease geographic concentration risk.
Risk Analysis of The Equity Style of This Dividend Portfolio
Primary Objective: To Demonstrate the Portfolio’s Predominant Composition of Large-Cap Companies with Value Focus
The largest proportion of the overall investment portfolio is represented by large-cap companies with a focus on value. This ensures a reduced risk level for the portfolio, highlighting an increased probability of attractive investment outcomes.
The illustration below demonstrates the equity style of this dividend portfolio. 85% of the companies included are large-cap companies, while 14% are mid-cap companies and 1% are small-cap companies.
Source: The Author, data from Seeking Alpha and Morningstar
These metrics further indicate the reduced risk level of this investment portfolio, since large-cap companies tend to come attached to a lower risk level than mid-cap and small-cap companies.
60% of the companies have a focus on value, while 15% have a focus on growth, and 25% combine value and growth (core company).
51% of the overall portfolio is represented by large-cap companies with a focus on value. 19% are large-cap companies that combine value and growth. 15% are large-cap companies with a focus on growth.
The portfolio’s predominant composition of large-cap value-focused companies (accounting for 51% of the portfolio) further demonstrates the portfolio’s reduced risk-level, providing its investors with a high likelihood of achieving attractive investment results.
Resume of The Key Factors of the Risk Analysis of This Portfolio
This investment portfolio has some sector specific concentration risk, evidenced through the fact that 29% is represented by companies from the Financials Sector (and even 34.52% when allocating SCHD to the sectors it is invested in), which could have a significant impact on the Total Return of this portfolio over the short term.
However, when investing over the long term (having an investment-horizon of at least 7 years), I am convinced that this investment portfolio will then come attached to a relatively low risk level. This is indicated through the following characteristics:
- The companies with the highest proportion of the overall portfolio are particularly attractive in terms of Risk and Reward
- Inclusion of companies with a Beta Factor below 1
- Reduced Company Specific Concentration Risk
- Reduced Sector Specific Concentration Risk
- Reduced Industry Specific Concentration Risk
- Reduced Geographical Concentration Risk
- Portfolio-Focus on Large-Cap Value Stocks
- Limited Exposure to Small-Cap-Companies
I would like to highlight again that the principal objective of this detailed risk analysis is to provide you with a portfolio that has an increased likelihood of delivering attractive investment outcomes.
How to Further Reduce the Risk Level of This Dividend Portfolio
This portfolio provides investors with several options to further decrease its risk level. Here I will highlight some of them:
- Providing Companies that have a Low Beta Factor with a Higher Proportion of the Overall Portfolio: You could provide companies that come attached to a relatively low risk level (and have a Beta Factor below 1) with an even higher proportion of the overall investment portfolio.
- Incorporating Additional Companies that have a low Beta Factor: You could add additional companies to the portfolio that come with lower risk. For example, Johnson & Johnson (NYSE: JNJ ) could be an excellent pick that could further decrease the risk level of this portfolio. The company’s 24M Beta Factor of 0.34 and its relatively low Payout Ratio of 44.23%, in combination with its broad and diversified product portfolio, indicate that you can further reduce portfolio volatility and its risk level with the inclusion of Johnson & Johnson.
- Diversification over Asset Classes: Investing in Fixed Income : This portfolio is not invested in fixed income. Through the inclusion of government bonds, corporate bonds or CDs into this portfolio, you could further decrease its risk level.
- Including an Additional ETF to Decrease Sector Specific Concentration Risk: You could buy an additional ETF for this portfolio that increases diversification over sectors and industries. By doing so you could decrease concentration risk, thus avoiding such a high percentage of the overall investment portfolio being invested in the Financials Sector.
- Incorporate Additional Companies From Outside the United States to Increase Geographical Diversification: You could incorporate into the portfolio an additional company from outside the United States to further increase geographical diversification.
The Similarities and Differences between this Dividend Portfolio and The Dividend Income Accelerator Portfolio
At the beginning of September, I started constructing, implementing and documenting The Dividend Income Accelerator Portfolio .
The investment portfolio which I have presented in today’s article reflects the investment approach of The Dividend Income Accelerator Portfolio for different reasons:
- Attractive Weighted Average Dividend Yield: The dividend portfolio I have presented in today’s article provides investors with an attractive Weighted Average Dividend Yield [TTM] of 4.05%, aligning with the investment approach of The Dividend Income Accelerator Portfolio to offer investors an additional income stream.
- Attractive Weighted Average Dividend Growth Rate: The portfolio provides investors with a Weighted Average Dividend Growth Rate [CAGR] of 10.58%, aligning with The Dividend Income Accelerator Portfolio’s aim of annually increasing dividend payments.
- Broad Diversification across Sectors and Industries: This portfolio provides investors with a broad diversification over sectors and industries as well as geographical diversification, thus offering reduced risk.
Additional benefits for investors of The Dividend Income Accelerator Portfolio:
- Stronger Focus on Dividend Income: The Dividend Income Accelerator Portfolio strives to obtain an even higher Weighted Average Dividend Yield [TTM] than the portfolio presented here in this article.
- Broader Diversification Over Sectors, and Industries, Providing Investors with a Lower Concentration Risk: The Dividend Income Accelerator Portfolio provides investors with an even broader diversification over sectors and industries, offering a reduced level of concentration risks.
- Risk/Reward Optimization: The Dividend Income Accelerator Portfolio has an even higher optimization when it comes to risk/reward.
How Can a Company with a High Level of Risk Fit into this Dividend Portfolio? The Example of Integrating the Tesla Stock into this Portfolio
The dividend portfolio I have presented in today’s article aims to provide you with a reduced risk level, implying a high probability of achieving attractive investment outcomes. However, this does not mean that companies, which come attached to a higher risk level, cannot be part of such an investment portfolio.
Providing Companies with a High Risk Level with a Limited Proportion of the Overall Investment Portfolio
Companies that come attached to a higher risk level can indeed be part of this investment portfolio. However, to maintain a reduced risk level, I suggest that they only account for a small proportion of the overall investment portfolio.
The Example of Tesla – The integration of the Tesla Stock into this Dividend Portfolio
For instance, if you're particularly enthusiastic about Tesla (NASDAQ: TSLA ), and you wish to include its stock into your investment portfolio, you can certainly do so. However, I suggest to initially not allocate more than 2.5% to this company, allowing for a continued reduced risk level of your portfolio.
Tesla currently has a P/E [FWD] Ratio of 88.22, which lies 471.27% above the Sector Median. The company’s high Valuation indicates that its current stock price is based on high growth expectations. This also implies that the company’s stock price could drop significantly if growth targets were not met in the future, implying a high risk factor for you as an investor.
By providing Tesla with a smaller proportion of the overall investment portfolio, you ensure that a possible drop of its stock price would have a less significant negative impact on your investment portfolio’s Total Return. At the same time, by including it, you ensure that you can benefit from the growth prospects and enormous potential of the company.
Managing Your Portfolio When the Proportion of the Tesla Stocks Becomes Disproportionally Large When Compared to the Overall Portfolio
In the case that the stock price of Tesla was raising significantly in the years to come, it would naturally become a larger part of your overall investment portfolio, resulting in an increasing company specific concentration risk.
In such a scenario, you could sell some of your Tesla stocks (in order to reach its initial proportion of 2.5%), ensuring a reduced share of the Tesla position compared to your overall portfolio.
This strategy allows you to continuously reduce the risk level of your portfolio while still being able to benefit from the company’s growth perspectives. Another strategy would be to buy additional shares of other companies that come attached to a significantly lower risk level than Tesla.
I would like to highlight that I only took the Tesla stock as an example, and that you can adopt this strategy (underweighting companies with a particularly high risk level and selling some of their shares in case their proportion of the overall portfolio becomes disproportionally high) with any other stock that has a high risk-profile.
Conclusion
The Principal Objective of this Portfolio Allocation Analysis
The aim of today’s article was to show you how to build a dividend portfolio by allocating the amount of $100,000 among my top 20 dividend income stocks that I have selected for the month of November.
It is important to note that you are not limited to investing $100,000. You can choose any other amount, but maintaining similar proportions is key when aiming to achieve a similar risk/reward profile and investment outcomes.
The Main Characteristics of This Dividend Portfolio
This dividend portfolio provides you with a Weighted Average Dividend Yield [TTM] of 4.05%, meaning that you would receive $4,050 in dividend payments per year if you invested $100,000 (no withholding taxes included in this calculation), while increasing this amount continuously. The companies’ Weighted Average Dividend Growth Rate [CAGR] of 10.58%, indicates that they should be able to increase their dividends significantly in the years ahead.
The investment portfolio I have presented today offers investors a reduced risk level due to its broad diversification over sectors and industries in combination with its geographical diversification and inclusion of companies with a low Beta Factor. This strategy ensures a high likelihood of achieving attractive investment outcomes.
Strategies to Additionally Minimize the Risk Level of This Dividend Portfolio
By incorporating another ETF, adding companies with a low Beta Factor, or including other asset classes such as fixed income (like government bonds, corporate bonds or CDs) you can further lower the risk level of this dividend portfolio.
How to Incorporate a Company with a High Risk Level Into This Portfolio While Maintaining Its Optimization in Terms of Risk and Reward
In this article I have further shown that you can incorporate an investment that comes attached to a relatively high risk level (such as Tesla) while maintaining the portfolio’s attractive risk/reward profile. This is achieved by providing the company with a relatively low proportion of the overall portfolio. In the case of Tesla, for example, I suggest providing it with a maximum of 2.5% of the overall portfolio.
The Differences Between This Dividend Portfolio and The Dividend Income Accelerator Portfolio
The portfolio I have presented today reflects the investment approach of The Dividend Income Accelerator Portfolio. However, The Dividend Income Accelerator Portfolio provides you with a lower risk level due to its even broader diversification over sectors and industries. Furthermore, it provides investors with an optimized risk/reward profile, aiming for an attractive Total Return.
The Dividend Income Accelerator Portfolio also generates a superior amount of extra income via dividends (because it strives for a higher Weighted Average Dividend Yield). At the same time, it aims to steadily increase dividend payments due to carefully selected companies that pay sustainable dividends.
The Benefits of Implementing the Investment Approach of The Dividend Income Accelerator Portfolio
By implementing the portfolio strategy that I have presented today, or by adopting the investment approach of The Dividend Income Accelerator Portfolio, you can actively benefit from the dividend payments of companies such as Apple, Altria, BlackRock or Bank of America.
An investment portfolio that is characterized by a reduced risk level, the generation of extra income via dividend payments, and a well-balanced combination of dividend income and dividend growth, offers significant advantages for you as an investor: it not only helps you to steadily grow your wealth, it also provides additional financial flexibility. This could be used to spend more time with your family and best friends or even funding exciting vacation trips, all financed with the dividends received from the companies in your portfolio!
For further details see:
How To Build A Dividend Portfolio Allocating $100,000 Among November's Top 20 Dividend Companies