SU:CC - How To Build A Dividend Portfolio With $25000 Among May's Top 30 Stocks
2023-05-13 15:00:00 ET
Summary
- An investment strategy that combines dividend income with dividend growth, brings several benefits for dividend income investors.
- In this article, I will show you how you could build a dividend income investment portfolio by allocating $25,000 among 30 companies that I currently consider to be attractive.
- The Weighted Average Dividend Yield [TTM] of this investment portfolio stands at 3.30%. Furthermore, the picks have shown a 5-Year Dividend Growth Rate [CAGR] of 10.83%, promising dividend growth.
Investment Thesis
In today’s article, I will show you how you could build an attractive dividend income investment portfolio by allocating $25,000 among 30 companies that I consider to be attractive at this moment in time.
The amount of $25,000 will be allocated among high-yield dividend companies, as well as among attractive dividend growth companies and growth companies.
Due to the fact, I have overweighted companies that pay a relatively high dividend yield, I consider this portfolio to be particularly attractive for dividend income investors (as they can still benefit from the advantages of having growth companies included in the portfolio).
The fact that this portfolio is particularly attractive for dividend income investors is underlined by the portfolio’s Weighted Average Dividend Yield [TTM] of 3.30%. It is further confirmed by the selected picks having shown a Dividend Growth Rate [CAGR] of 10.83% over the past 5 years. This demonstrates that with this portfolio allocation, dividend income investors should not only be able to achieve a relatively attractive dividend income for today, but they should also be able to further increase the amount of dividend income year over year at an attractive growth rate.
In this article, I will analyze in greater detail the portfolio allocation over sectors, industries, and countries in order to ensure a broad diversification.
I will also allocate the selected ETF over the companies, sectors, and industries it is invested in. This will ensure that through the combination of individual companies and ETFs, no sector or industry is overrepresented.
In the first step, I will show you the companies that are part of this investment portfolio.
The following are my top 10 high dividend yield stocks for May 2023:
- Altria ( MO )
- AT&T ( T )
- Deutsche Post ( DPSTF ) (DPSGY )
- Johnson & Johnson ( JNJ )
- Pfizer ( PFE )
- Suncor Energy ( SU )
- U.S. Bancorp ( USB )
- Vale ( VALE )
- Verizon Communications Inc. ( VZ )
- VICI Properties ( VICI )
Here are my top 10 dividend growth stocks for May 2023:
- American Express ( AXP )
- Apple ( AAPL )
- Itaú Unibanco Holding S.A. ( ITUB )
- JPMorgan ( JPM )
- Mastercard ( MA )
- Microsoft ( MSFT )
- Nike ( NKE )
- Linde ( LIN )
- The Charles Schwab Corporation ( SCHW )
- The Travelers Companies ( TRV )
And these are 10 attractive growth companies for May:
- Adobe ( ADBE )
- Airbnb ( ABNB )
- Alphabet ( GOOG ) ( GOOGL )
- Amazon ( AMZN )
- Broadcom ( AVGO )
- MercadoLibre ( MELI )
- Novo Nordisk ( NVO )
- Salesforce ( CRM )
- Tesla ( TSLA )
- Waste Management ( WM )
Overview of the 30 selected Picks for May 2023, the selected ETF and the Portfolio Allocation
| Company Name |
| Sector |
| Industry |
| Country |
| Dividend Yield [TTM] |
| Div Growth 5Y |
| P/E FWD Ratio |
| Allocation |
| Amount in $ |
| Adobe |
| Information Technology |
| Application Software |
| United States |
| 0% |
| 0% |
| 21.81 |
| 1.0% |
| 250 |
| Airbnb |
| Consumer Discretionary |
| Hotels, Resorts and Cruise Lines |
| United States |
| 0% |
| 0% |
| 33.09 |
| 1.0% |
| 250 |
| Alphabet |
| Communication Services |
| Interactive Media and Services |
| United States |
| 0% |
| 0% |
| 19.87 |
| 2.0% |
| 500 |
| Altria |
| Consumer Staples |
| Tobacco |
| United States |
| 7.97% |
| 7.18% |
| 9.24 |
| 3.50% |
| 875 |
| Amazon |
| Consumer Discretionary |
| Broadline Retail |
| United States |
| 0% |
| 0% |
| 68.23 |
| 2.0% |
| 500 |
| American Express |
| Financials |
| Consumer Finance |
| United States |
| 1.32% |
| 9.53% |
| 14.7 |
| 1.5% |
| 375 |
| Apple |
| Information Technology |
| Technology Hardware, Storage and Peripherals |
| United States |
| 0.55% |
| 7.87% |
| 27.9 |
| 2.5% |
| 625 |
| AT&T |
| Communication Services |
| Integrated Telecommunication Services |
| United States |
| 6.33% |
| -5.78% |
| 7.23 |
| 2.5% |
| 625 |
| Broadcom |
| Information Technology |
| Semiconductors |
| United States |
| 2.85% |
| 25.72% |
| 14.73 |
| 2.0% |
| 500 |
| Charles Schwab |
| Financials |
| Investment Banking and Brokerage |
| United States |
| 1.65% |
| 21.22% |
| 16.3 |
| 1.0% |
| 250 |
| Deutsche Post |
| Industrials |
| Air Freight and Logistics |
| Germany |
| 3.93% |
| 14.83% |
| 14 |
| 1.5% |
| 375 |
| Itaú Unibanco |
| Financials |
| Diversified Banks |
| Brazil |
| 3.88% |
| 30.04% |
| 7.1 |
| 1.0% |
| 250 |
| Johnson & Johnson |
| Health Care |
| Pharmaceuticals |
| United States |
| 2.76% |
| 6.11% |
| 15.36 |
| 3.0% |
| 750 |
| JPMorgan Chase & Co. |
| Financials |
| Diversified Banks |
| United States |
| 2.84% |
| 12.91% |
| 10.0 |
| 3.0% |
| 750 |
| Linde |
| Materials |
| Industrial Gases |
| United Kingdom |
| 1.30% |
| 8.46% |
| 27.4 |
| 2.0% |
| 500 |
| Mastercard |
| Financials |
| Transaction & Payment Processing Services |
| United States |
| 0.57% |
| 17.66% |
| 30.7 |
| 2.0% |
| 500 |
| MercadoLibre |
| Consumer Discretionary |
| Broadline Retail |
| Uruguay |
| 0% |
| 0% |
| 68.78 |
| 1.0% |
| 250 |
| Microsoft |
| Information Technology |
| Systems Software |
| United States |
| 0.91% |
| 9.92% |
| 30.6 |
| 2.0% |
| 500 |
| Nike |
| Consumer Discretionary |
| Footwear |
| United States |
| 1.04% |
| 11.16% |
| 38.5 |
| 2.0% |
| 500 |
| Novo Nordisk |
| Health Care |
| Pharmaceuticals |
| Denmark |
| 1.10% |
| 6.56% |
| 30.46 |
| 2.0% |
| 500 |
| Pfizer |
| Health Care |
| Pharmaceuticals |
| United States |
| 4.03% |
| 5.51% |
| 11.71 |
| 3.0% |
| 750 |
| Salesforce |
| Information Technology |
| Application Software |
| United States |
| 0% |
| 0% |
| 26.88 |
| 1.0% |
| 250 |
| Schwab U.S. Dividend Equity ETF |
| ETFs |
| ETFs |
| United States |
| 3.66% |
| 15.56% |
| 40.0% |
| 10000 |
| Suncor Energy |
| Energy |
| Integrated Oil and Gas |
| Canada |
| 4.91% |
| 8.00% |
| 6.73 |
| 2.5% |
| 625 |
| Tesla |
| Consumer Discretionary |
| Automobile Manufacturers |
| United States |
| 0% |
| 0% |
| 46.1 |
| 1.5% |
| 375 |
| The Travelers Companies |
| Financials |
| Property and Casualty Insurance |
| United States |
| 2.08% |
| 5.25% |
| 12.4 |
| 1.50% |
| 375 |
| U.S. Bancorp |
| Financials |
| Diversified Banks |
| United States |
| 5.79% |
| 10.00% |
| 7.03 |
| 2.5% |
| 625 |
| Vale |
| Materials |
| Steel |
| Brazil |
| 6.95% |
| 31.11% |
| 5.39 |
| 2.0% |
| 500 |
| Verizon Communications |
| Communication Services |
| Integrated Telecommunication Services |
| United States |
| 7.00% |
| 2.04% |
| 7.92 |
| 3.5% |
| 875 |
| VICI Properties |
| Real Estate |
| Other Specialized REITs |
| United States |
| 4.61% |
| 0.00% |
| 13.44 |
| 2.0% |
| 500 |
| Waste Management |
| Industrials |
| Environmental and Facilities Services |
| United States |
| 1.58% |
| 8.78% |
| 27.74 |
| 2.0% |
| 500 |
| 3.30% |
| 10.83% |
| 100.0% |
| 25000 |
Source: The Author
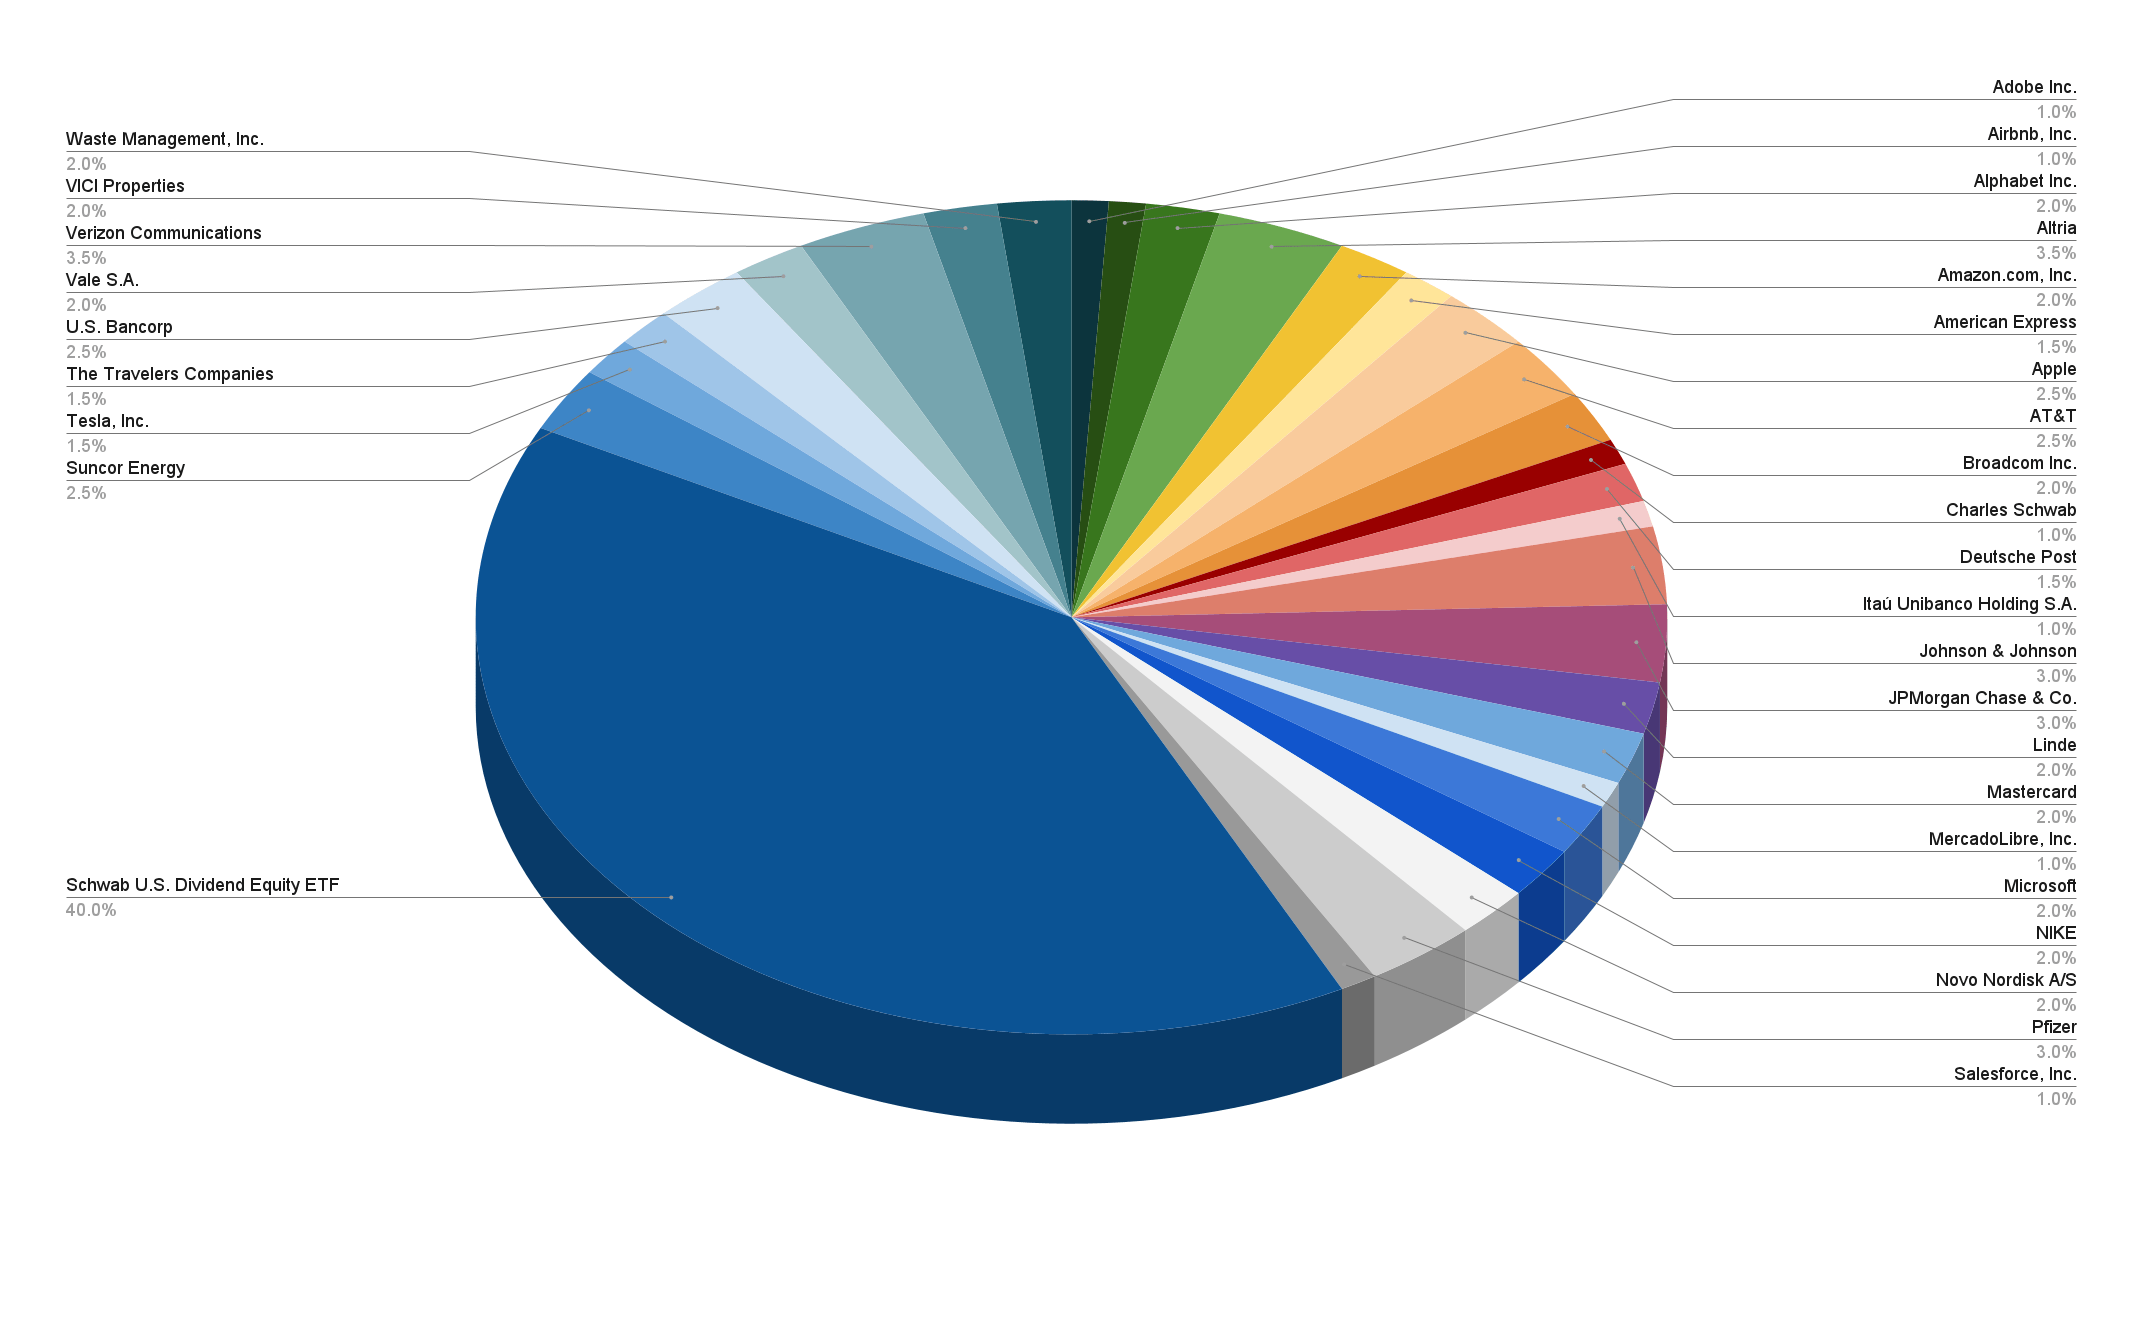
Portfolio Allocation per Company/ETF
Representing 40%, the Schwab U.S. Dividend Equity ETF (SCHD) has the highest proportion of the overall portfolio.
Selecting the Schwab U.S. Dividend Equity ETF provides us with a basis to achieve a broad diversification over industries and sectors while at the same time, combining an attractive Dividend Yield [TTM] of 3.66% with Dividend Growth (the ETF has shown a Dividend Growth Rate of 15.66% over the past 5 years). These metrics make the ETF the perfect fit for dividend-income investors that want to benefit from annually increasing dividend payments.
The following companies represent the largest individual positions of this investment portfolio:
- Altria (3.5%)
- Verizon (3.5%)
- Johnson & Johnson (3%)
- JPMorgan (3%)
- Pfizer (3%)
In this investment portfolio, I have particularly overweighted companies that provide investors with an attractive Dividend Yield: Altria’s current Dividend Yield [FWD] stands at 8.07%, Verizon’s at 6.90%, Johnson & Johnson’s at 2.93%, JPMorgan’s at 2.92% while Pfizer’s is at 4.24%.
Since this investment portfolio has been created for dividend income investors in particular, overweighting companies that pay an attractive Dividend Yield contributes to raising its Weighted Average Dividend Yield.
By overweighting these high dividend yield companies you can achieve a relatively attractive Weighted Average Dividend Yield [TTM] of 3.30%. However, I have also included companies, that do not pay a Dividend at all in this portfolio.
This way you can benefit from a dividend income-oriented investment portfolio while still benefiting from the growth potential of some attractive growth companies (while being underweighted).
In addition to that, I consider the risks of investing in these companies that have the highest proportion of the overall portfolio to be relatively low while the reward (represented by the expected compound annual rate of return) is relatively high. I would like to remind you of what I mentioned in a previous analysis :
The companies that have the highest proportion on the portfolio have a significant impact on the Total Return that the portfolio provides. By overweighting companies that give us relatively low-risk factors and at the same time offer an attractive expected compound annual rate of return, we significantly increase the probability of making successful long-term investments.
By underweighting growth companies in this portfolio, which often come attached with higher risk factors (as they regularly have higher growth expectations priced into the stock price), we further reduce the risk level while providing the portfolio with the chance to benefit from their growth potential.
In addition to that, it can be highlighted that the companies which have the highest proportion of this investment portfolio provide investors with significant Dividend Growth. This contributes to increasing the dividend income that investors can receive annually: while Altria’s Dividend Growth Rate [CAGR] over the past 5 years is 7.18%, Verizon’s is 2.04%, Johnson & Johnson’s 6.11%, JPMorgan’s is 12.91% and Pfizer’s is 5.51%.
These metrics underline my theory that this investment portfolio is suitable for dividend-income investors aiming to raise their additional annual income via dividends from year to year.
Illustration of the Portfolio Allocation per Company/ETF
Portfolio Allocation per Sector
Excluding the ETF, the Financials Sector has the largest proportion of this investment portfolio, representing 12.5%.
The companies from the Financials Sector in this investment portfolio are JPMorgan Chase & Co. (3% of the overall portfolio), U.S. Bancorp (2.5%), Mastercard (2%), American Express (1.5%), The Travelers Companies (1.5%), Charles Schwab (1%) and Itaú Unibanco Holding (1%).
The Information Technology Sector represents 8.5% of the overall portfolio with Apple making up 2.5%, Broadcom 2%, Microsoft 2%, Adobe 1% and Salesforce 1%.
The Health Care Sector, which makes up 8% of the overall portfolio, is represented by Johnson & Johnson (3%), Pfizer (3%) and Novo Nordisk (2%).
The Communication Services Sector has a proportion of 8% of the overall portfolio and is represented by Verizon (3.5%), AT&T (2.5%) and Alphabet (2%).
The Consumer Discretionary Sector has a proportion of 7.5% of the overall portfolio while being represented by Amazon (with 2%), Nike (2%), Tesla (1.5%), Airbnb (1%) and MercadoLibre (1%).
A smaller percentage of the overall portfolio goes to the Materials Sector with 4% (Linde and Vale represent 2% each), the Consumer Staples Sector has 3.5% (Altria is the only company from this sector), and the Industrials Sector also has 3.5% (Waste Management represents 2% and Deutsche Post 1.5% of the overall portfolio). Meanwhile, the Energy Sector takes up 2.5% (with Suncor Energy being the only company from this sector), and the Real Estate Sector has 2.5% (VICI Properties represents this sector).
Besides the ETF, no Sector has a proportion of more than 12.5% of the overall portfolio, which can be interpreted as an indicator that this investment portfolio achieves a broad diversification over sectors.
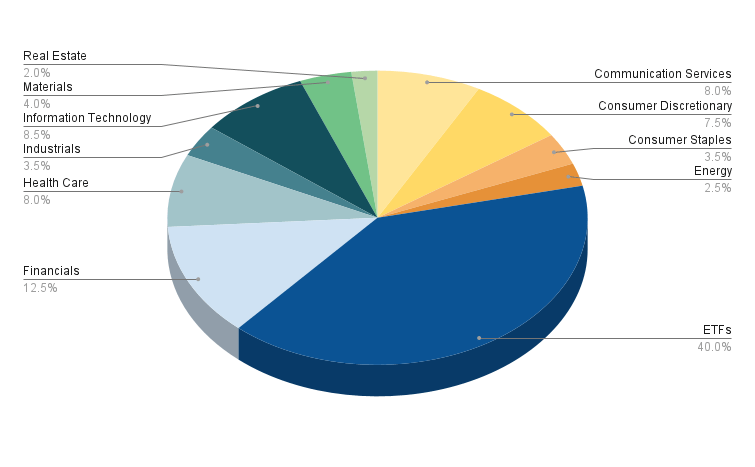
Illustration of the Portfolio Allocation per Sector when allocating SCHD to the ETF Sector
The graphic below shows the portfolio allocation per sector while allocating the Schwab U.S. Dividend Equity ETF to the ETF Sector.
Below is a list of the sectors and their corresponding companies/ETF:
ETFs (40%)
- Schwab U.S. Dividend Equity ETF (40%)
Financials (12.5%)
- JPMorgan Chase & Co. (3.0%)
- U.S. Bancorp (2.5%)
- Mastercard (2.0%)
- American Express (1.5%)
- The Travelers Companies (1.50%)
- Charles Schwab (1.0%)
- Itaú Unibanco Holding (1.0%)
Information Technology (8.5%)
- Apple (2.5%)
- Broadcom (2.0%)
- Microsoft (2.0%)
- Adobe (1.0%)
- Salesforce (1.0%)
Health Care (8%)
- Johnson & Johnson (3.0%)
- Pfizer (3.0%)
- Novo Nordisk (2.0%)
Communication Services (8%)
- Verizon (3.5%)
- AT&T (2.5%)
- Alphabet (2%)
Consumer Discretionary (7.5%)
- Amazon (2.0%)
- Nike (2.0%)
- Tesla (1.5%)
- Airbnb (1.0%)
- MercadoLibre (1.0%)
Materials (4%)
- Linde (2%)
- Vale (2%)
Consumer Staples (3.5%)
- Altria (3.5%)
Industrials (3.5%)
- Waste Management (2%)
- Deutsche Post (1.5%)
Energy (2.5%)
- Suncor Energy (2.5%)
Real Estate (2%)
- VICI Properties (2%)
Illustration of the Portfolio Allocation per Sector when allocating the ETF among the companies and Sectors it is invested in
In the graphic shown before, the Schwab U.S. Dividend Equity ETF, which makes up 40% of this investment portfolio, was allocated to the ETF Sector.
In the illustration shown below, I have allocated the Schwab U.S. Dividend Equity ETF among the companies and sectors it's actually invested in.
Instead of allocating the Schwab U.S. Dividend Equity ETF to the ETF Sector (such as shown in the previous graphic), I have allocated it among the corresponding companies in which this ETF is invested in as well as the respective sectors.
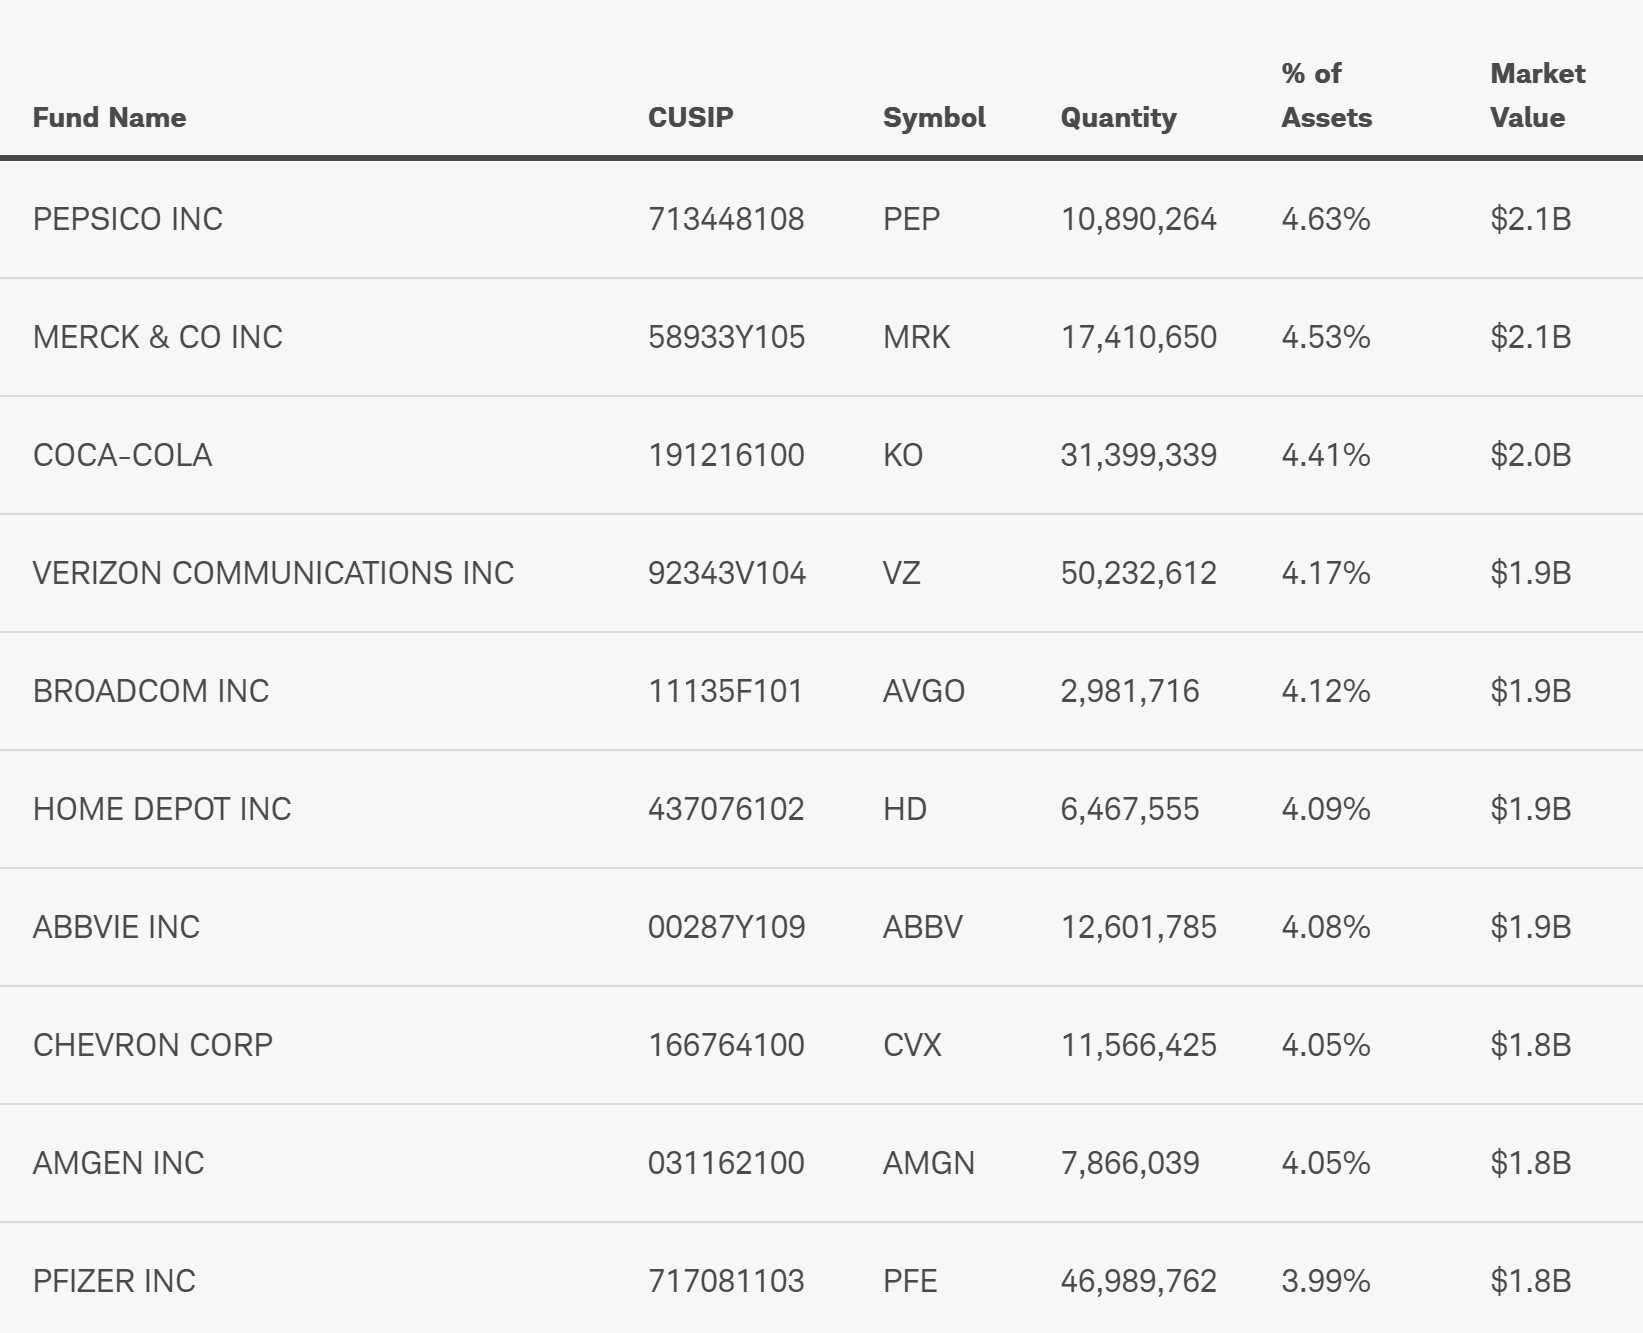
I would like to illustrate this with the following example: PepsiCo currently represents 4.63% of the Schwab U.S. Dividend Equity ETF. Since the Schwab U.S. Dividend Equity ETF has a proportion of 40% of this investment portfolio, PepsiCo would have a proportion of 1.85% of the overall portfolio (4.63% multiplied with 40%). This proportion of 1.85% would be allocated to the Consumer Staples Sector to which the company belongs to.
The objective of allocating the Schwab U.S. Dividend Equity ETF among the companies and sectors it is invested in, is to ensure that no sector is overrepresented in this investment portfolio through the combination of individual companies with an ETF.
Below you can find the 10 top holdings the Schwab U.S. Dividend Equity ETF is currently invested in.
Source: schwabassetmanagement.com
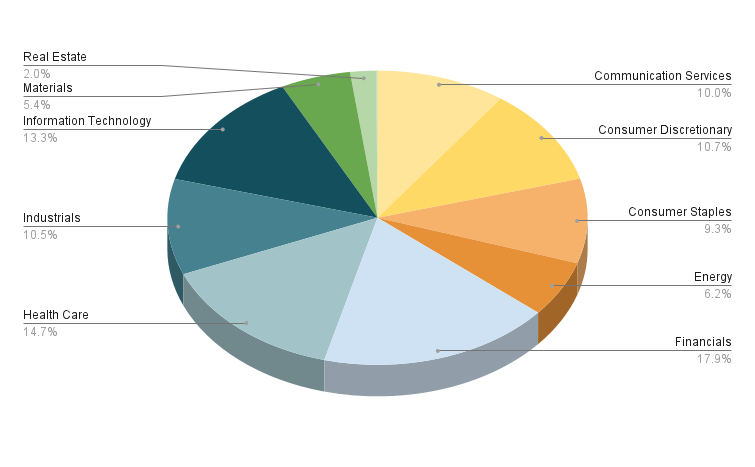
Below you can find a graphic that shows the sectors of this investment portfolio while having allocated the Schwab U.S. Dividend Equity ETF among the companies and sectors it is actually invested in.
Even though the individual sectors have a higher proportion of the overall portfolio compared to the previous graphic in which the ETF was allocated to the ETF Sector, it can still be highlighted that the portfolio is broadly diversified over sectors, since no sector represents a proportion of more than 20% of the overall portfolio.
The Financials Sectors (with 17.9% of the overall portfolio) continues to be the sector with the highest proportion of this portfolio.
Due to the fact that the Schwab U.S. Dividend Equity ETF has a relatively high proportion of companies from the Health Care Sector in which it is invested in, this sector represents the second largest sector (with 14.7%).
The third largest is the Information Technology Sector (with 13.3%).
In my opinion, overweighting the Financials Sector, the Health Care Sector, and the Information Technology Sector in an investment portfolio brings benefits for investors, since I believe they have strong growth perspectives from which investors can benefit over the long term.
The fourth largest sector is the Consumer Discretionary Sector (with 10.7%), followed by the Industrials Sector (10.5%), the Communication Services Sector (10%), and the Consumer Staples Sector (9.3%).
The Energy Sector (6.2%), the Materials Sector (5.4%), and the Real Estate Sector (2.0%) have a relatively low proportion of the overall portfolio.
Portfolio Allocation per Industry
In the graphic below, we will take a closer look at the portfolio allocation per Industry. Such as before, we will initially allocate the Schwab U.S. Dividend Equity ETF to the ETF Sector. In a second step, we will allocate the ETF to the companies and industries it’s actually invested in in order to ensure that no industry is overrepresented.
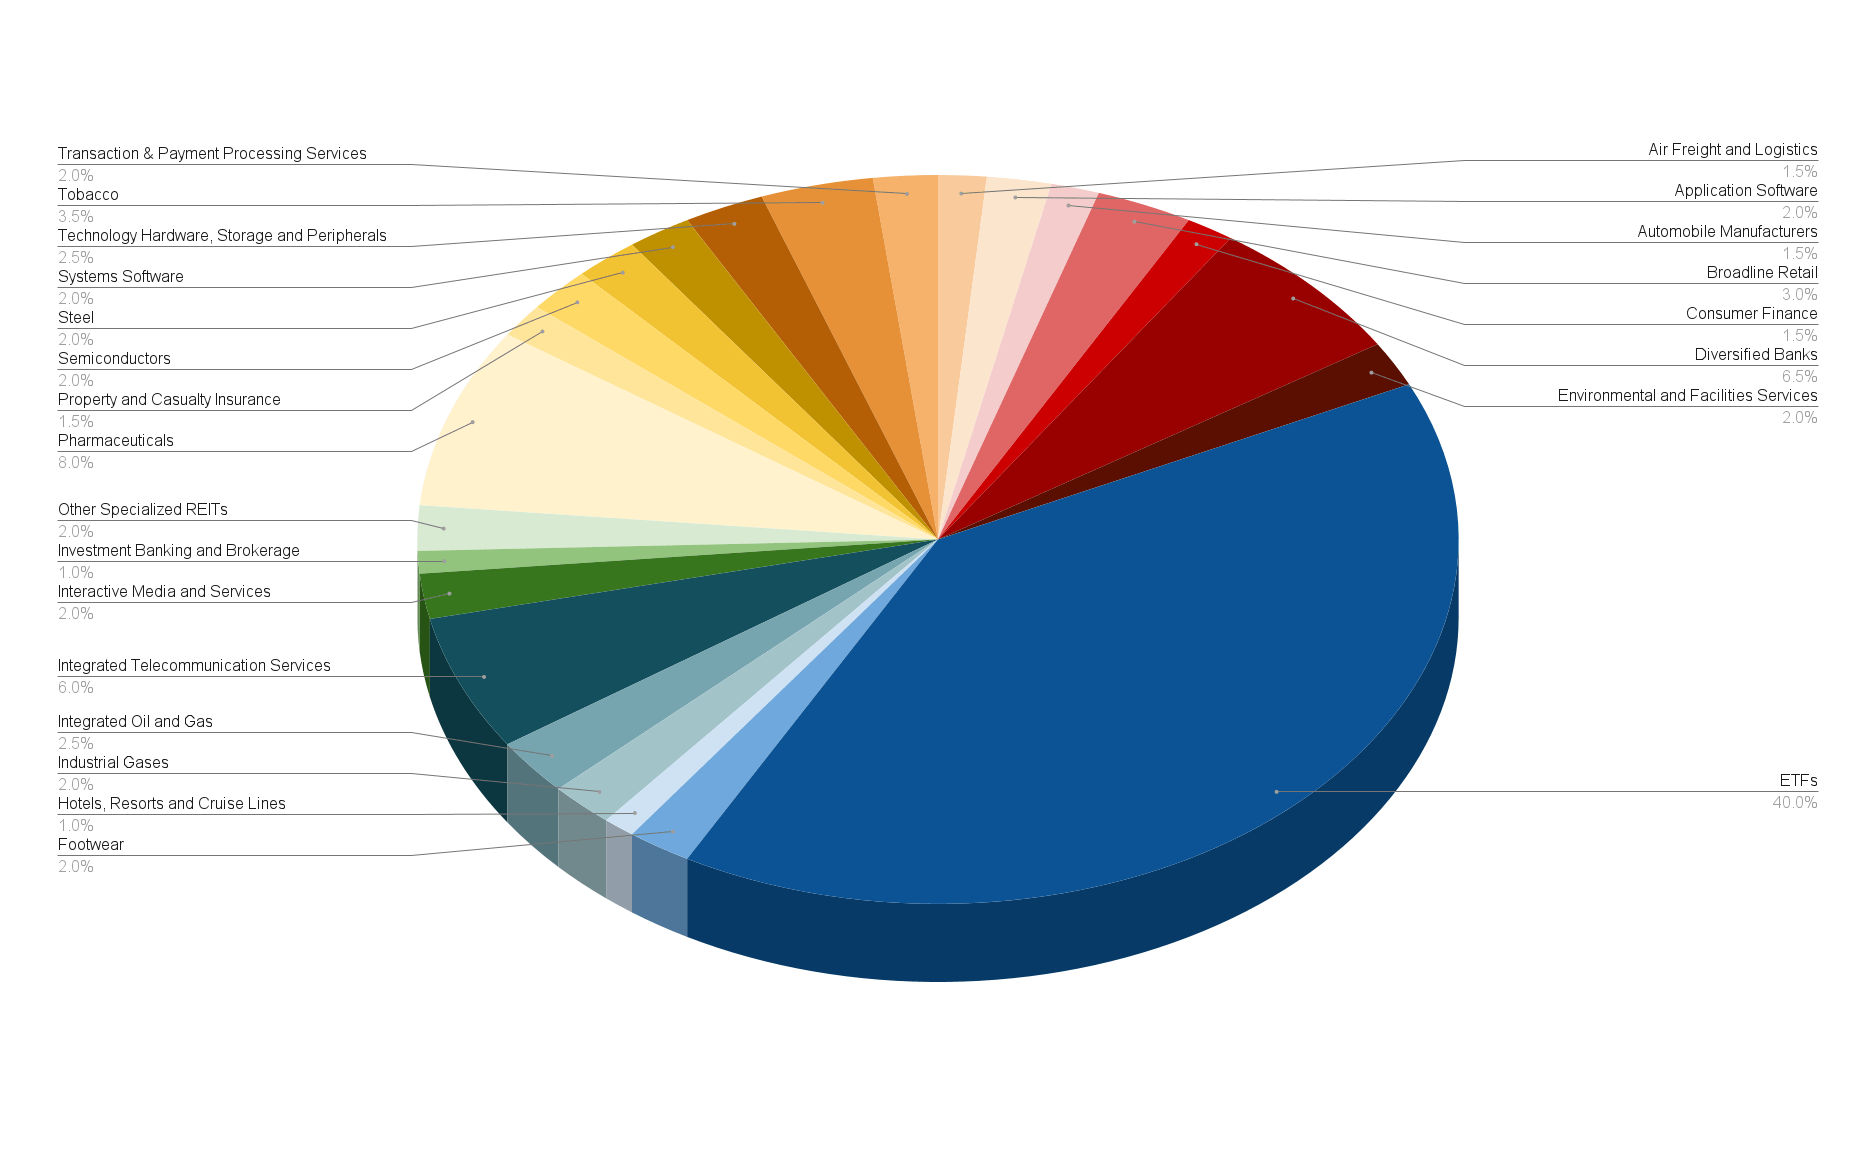
Excluding the Schwab U.S. Dividend Equity ETF (which is allocated to the ETF Sector), the Pharmaceuticals Industry has the highest proportion of the overall portfolio (with 8%), followed by the Diversified Banks Industry (6.5%), the Integrated Telecommunication Services Industry (6%), the Tobacco Industry (3.5%), and the Broadline Retail Industry (3%).
All other Industries have a proportion of 2.5% or less of the overall portfolio, indicating that this portfolio achieves a broad diversification over industries.
Even the industries with the highest proportion of the portfolio have a percentage of only 8% or less, serving as an additional indicator that this portfolio represents a broad diversification over industries.
Illustration of the Portfolio Allocation per Industry when allocating SCHD to the ETF Industry
Illustration of the Portfolio Allocation per Industry when allocating the ETF among the companies and Industries it is invested in
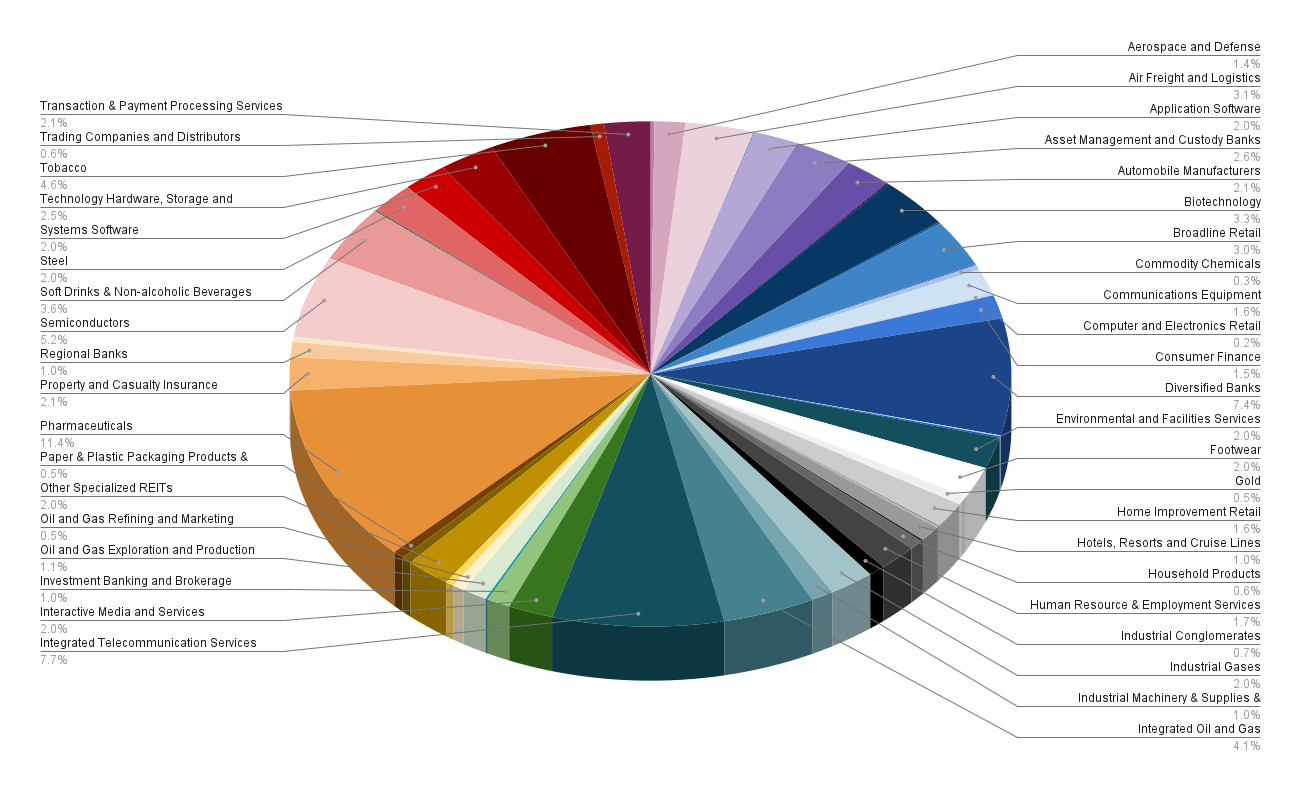
In the graphic below you can see the allocation among industries when allocating the Schwab U.S. Dividend Equity ETF among the companies and industries it is actually invested in.
This graphic shows that the Pharmaceuticals Industry has the largest proportion of the overall portfolio (11.4%), followed by the Integrated Telecommunication Services Industry (7.7%), the Diversified Banks Industry (7.4%), the Semiconductors Industry (5.2%), the Tobacco Industry (4.6%), and the Integrated Oil and Gas Industry (4.1%).
The Soft Drinks & Non-alcoholic Beverages Industry (3.6%), the Biotechnology Industry (3.3%), the Air Freight and Logistics Industry (3.1%), the Broadline Retail Industry (3.0%), and the Asset Management and Custody Banks Industry (2.6%) have a significantly lower proportion of the investment portfolio.
All other Industries make up 2.5% or less, indicating that this investment portfolio achieves a broad diversification over industries even when allocating the Schwab U.S. Dividend Equity ETF among the companies and industries it’s invested in.
The broad diversification over industries is also confirmed by the fact that each industry represents significantly less than 15% of the overall portfolio.
Portfolio Allocation per Country
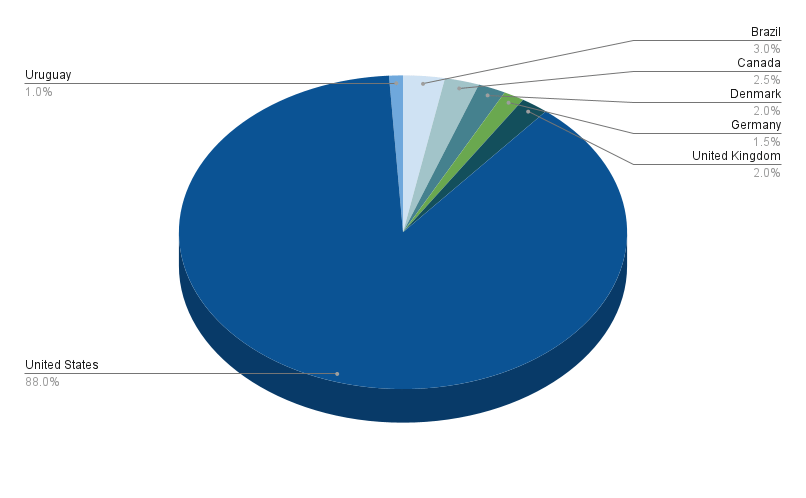
88% of this investment portfolio is represented by companies from the United States while the remaining 12% is made up by companies based outside of the country.
3% of the companies that are part of this investment portfolio are from Brazil (Vale has a proportion of 2% and Itaú Unibanco of 1% of the overall portfolio), 2.5% are from Canada (represented by Suncor Energy), 2% are from United Kingdom (Linde), 2.0% are from Denmark (Novo Nordisk), 1.5% are from Germany (Deutsche Post), and 1% are from Uruguay (MercadoLibre).
By significantly overweighting companies from the U.S., but still including companies from outside of the country, my geographical diversification requirements have been fulfilled. This leads me to the conclusion that the portfolio not only provides you with a broad diversification over sectors and industries, but that it also offers a broad geographical diversification.
Illustration of the Portfolio Allocation per Country
How to achieve an even Broader Diversification
If you would like to achieve an even broader diversification than this investment portfolio offers , you might consider invest ing in an additional ETF: you could take a closer look at the iShares Core Dividend Growth ETF ( DGRO ) , since it provides you with a relatively attractive Dividend Yield [TTM] of 3.37% and a Dividend Growth Rate [CAGR] of 10.32% over the past 5 years.
In case you ask yourself if it makes sense to only invest in SCHD, I would like to highlight some advantages of picking stocks individually over only investing in ETFs:
- It provides your portfolio with more individuality and flexibility
- You can protect your investment portfolio against the next stock market crash by adding companies with a low Beta Factor (an example of a company with a low Beta Factor would be Johnson & Johnson, which is part of this portfolio)
- You can overweight industries with which you are more familiar and you can avoid others you do n’t want to invest in
- You can select stocks which you think are able to beat the market or you can select ones to raise the Weighted Average Dividend Yield or Weighted Dividend Growth Rate of your investment portfolio
- You can also achieve an even broader geographical diversification of your portfolio
In my article 10 Dividend Stocks To Show The Advantages Of Investing In Individual Stocks Over ETFs I discuss the advantages of the selection of stocks over ETFs in greater detail.
Conclusion
A dividend income portfolio that not only aims to achieve a relatively high Dividend Yield, but also Dividend Growth, brings you a lot of benefits: in particular, it helps you to earn from an extra source of income right away while being able to increase this amount annually.
The dividend income investment portfolio that I have presented in this article, achieves an attractive Weighted Average Dividend Yield [TTM] of 3.30%, while the selected picks have shown a Weighted Average Dividend Growth Rate [CAGR] of 10.83% over the past 5 years.
In addition to that, the portfolio provides you with a broad diversification over sectors and industries, which I have further proven while allocating the Schwab U.S. Dividend Equity ETF among the companies, sectors and industries it is invested in.
I have done this in order to show you the broad diversification of this portfolio while combining the 30 selected companies with the Schwab U.S. Dividend Equity ETF.
The broad portfolio diversification over sectors and industries is proven by the fact that no sector has a proportion of more than 20% of the overall portfolio and no industry has a percentage of more than 15%.
In addition to that, companies from the U.S. have by far the highest proportion of this portfolio, while still having included companies from outside of the country. This indicates that there’s geographical diversification while still focusing on investing in companies that are among the top picks within its respective sectors and industries.
Author’s Note: Thank you very much for reading and I would appreciate hear ing your opinion on this investment portfolio and its allocation! Do you own or plan to acquire one of the selected picks?
For further details see:
How To Build A Dividend Portfolio With $25,000 Among May's Top 30 Stocks