TCPC - How To Build A High-Potential Dividend Portfolio Combining Dividend Income With Dividend Growth
2023-12-02 14:00:00 ET
Summary
- In this article, I will demonstrate how you could build a diversified dividend portfolio that blends dividend income with dividend growth, aiming towards achieving an attractive Total Return.
- I will use The Dividend Income Accelerator Portfolio as an example, and will show that it already successfully balances dividend income with dividend growth, striving to maximize investor benefits.
- I will explain in greater detail how this portfolio reduces risk for investors, thereby enhancing the probability of reaching attractive investment returns.
- Presently, the portfolio provides investors with a Weighted Average Dividend Yield [TTM] of 4.69%, and a 5 Year Weighted Average Dividend Growth Rate [CAGR] of 9.03%.
Investment Thesis
Building a solid foundation for a well-balanced and extensively diversified dividend portfolio can be of immense value for the creation of wealth over the long term.
In this article, I will show you how you can build a broadly diversified dividend portfolio that combines both dividend income and dividend growth while at the same time offering a high probability of achieving positive investment results.
For this demonstration, I will use the current composition of The Dividend Income Accelerator Portfolio as an example. Even though the portfolio is still in the construction phase (it currently consists of one ETF and 12 individual companies), it already offers an attractive mix of dividend income and dividend growth, given its balanced composition.
Moreover, the portfolio offers a broad diversification over companies, sectors, and industries, in addition to providing geographical diversification, as well as diversification across different equity styles, which I will demonstrate in this analysis.
The portfolio’s reduced risk level is not only attributed to its extensive diversification, but also to other factors that enhance the security of investors. I will illustrate the portfolio’s reduced risk level by analyzing the 60M Beta Factors of the companies that are part of it, as well as their Payout Ratios and EPS Growth Rates, thus providing a comprehensive risk analysis of the portfolio.
This extensive risk analysis of The Dividend Income Accelerator Portfolio raises my confidence that the portfolio already provides investors with a reduced risk level, leading to an elevated probability of achieving attractive investment results. This makes The Dividend Income Accelerator Portfolio an attractive investment approach to adapt and follow.
Last Wednesday, I made the latest acquisition for The Dividend Income Accelerator Portfolio by adding British American Tobacco:
British American Tobacco vs. Altria: Which is the Better Dividend Choice?
Presently, the portfolio provides investors with a Weighted Average Dividend Yield [TTM] of 4.69% and a 5 Year Weighted Average Dividend Growth Rate [CAGR] of 9.03%. These metrics indicate that the portfolio successfully combines dividend income with dividend growth, highlighting its enormous attractiveness for investors.
The Dividend Income Accelerator Portfolio Presently Consists of the Following Positions:
- Schwab U.S. Dividend Equity ETF (NYSEARCA: SCHD )
- Realty Income (NYSE: O )
- Philip Morris (NYSE: PM )
- Royal Bank of Canada (NYSE: RY )
- Apple (NASDAQ: AAPL )
- AT&T (NYSE: T )
- Mastercard (NYSE: MA )
- Main Street Capital (NYSE: MAIN )
- Johnson & Johnson (NYSE: JNJ )
- Bank of America (NYSE: BAC )
- Ares Capital (NASDAQ: ARCC )
- BlackRock TCP Capital (NASDAQ: TCPC )
- British American Tobacco (NYSE: BTI )
The Dividend Income Accelerator Portfolio
The Dividend Income Accelerator Portfolio’s objective is the generation of income via dividend payments, and to annually raise this sum. In addition to that, its goal is to attain an appealing Total Return when investing with a reduced risk level over the long-term.
The Dividend Income Accelerator Portfolio’s reduced risk level will be reached due to the portfolio’s broad diversification over sectors and industries and the inclusion of companies with a low Beta Factor.
Below you can find the characteristics of The Dividend Income Accelerator Portfolio:
- Attractive Weighted Average Dividend Yield [TTM]
- Attractive Weighted Average Dividend Growth Rate [CAGR] 5 Year
- Relatively low Volatility
- Relatively low Risk-Level
- Attractive expected reward in the form of the expected compound annual rate of return
- Diversification over asset classes
- Diversification over sectors
- Diversification over industries
- Diversification over countries
- Buy-and-Hold suitability
Overview of the Companies That Are Part of The Dividend Income Accelerator Portfolio
| Symbol |
| Company Name |
| Sector |
| Industry |
| Country |
| P/E [FWD] |
| Dividend Yield [TTM] |
| Dividend Growth 5Y |
| Number of shares |
| Acquisition Price per Share in $ |
| Total Acquisition in $ |
| Current Price per Share in $ |
| Market Value in $ |
| Current Allocation |
| SCHD |
| Schwab U.S. Dividend Equity ETF |
| ETFs |
| ETFs |
| United States |
| 3.53% |
| 13.92% |
| 13.3761 |
| 74.83 |
| 1000.93 |
| 71.34 |
| 954.25 |
| 43.52% |
| O |
| Realty Income |
| Real Estate |
| Retail REITs |
| United States |
| 40.13 |
| 5.46% |
| 4.28% |
| 1.8185 |
| 55.54 |
| 101.00 |
| 54.05 |
| 98.29 |
| 4.48% |
| PM |
| Philip Morris |
| Consumer Staples |
| Tobacco |
| United States |
| 18.52 |
| 5.38% |
| 3.15% |
| 1.0552 |
| 95.71 |
| 100.99 |
| 93.78 |
| 98.96 |
| 4.51% |
| RY |
| Royal Bank of Canada |
| Financials |
| Diversified Banks |
| Canada |
| 11.65 |
| 4.49% |
| 6.24% |
| 1.0936 |
| 92.36 |
| 101.00 |
| 85.58 |
| 93.59 |
| 4.27% |
| AAPL |
| Apple |
| Information Technology |
| Technology Hardware, Storage and Peripherals |
| United States |
| 28.92 |
| 0.56% |
| 6.59% |
| 0.5867 |
| 172.14 |
| 100.99 |
| 189.59 |
| 111.23 |
| 5.07% |
| T |
| AT&T |
| Communication Services |
| Integrated Telecommunication Services |
| United States |
| 7.33 |
| 7.40% |
| -5.97% |
| 6.8036 |
| 14.84 |
| 100.97 |
| 16.09 |
| 109.47 |
| 4.99% |
| MA |
| Mastercard |
| Financials |
| Transaction & Payment Processing Services |
| United States |
| 34.37 |
| 0.58% |
| 17.92% |
| 0.2544 |
| 396.96 |
| 100.99 |
| 408.75 |
| 103.99 |
| 4.74% |
| MAIN |
| Main Street Capital |
| Financials |
| Asset Management and Custody Banks |
| United States |
| 9.02 |
| 6.95% |
| 3.58% |
| 2.4876 |
| 40.6 |
| 101 |
| 41.38 |
| 102.94 |
| 4.69% |
| JNJ |
| Johnson & Johnson |
| Health Care |
| Pharmaceuticals |
| United States |
| 22.61 |
| 3.09% |
| 5.83% |
| 0.6557 |
| 154.01 |
| 100.99 |
| 151.04 |
| 99.04 |
| 4.52% |
| BAC |
| Bank of America |
| Financials |
| Diversified Banks |
| United States |
| 8.89 |
| 3.73% |
| 12.03% |
| 3.9191 |
| 25.77 |
| 101 |
| 29.42 |
| 115.30 |
| 5.26% |
| ARCC |
| Ares Capital |
| Financials |
| Asset Management and Custody Banks |
| United States |
| 7.72 |
| 9.66% |
| 4.65% |
| 5.0812 |
| 19.88 |
| 101 |
| 19.81 |
| 100.66 |
| 4.59% |
| TCPC |
| BlackRock TCP Capital |
| Financials |
| Asset Management and Custody Banks |
| United States |
| 8.69 |
| 11.87% |
| -1.73% |
| 8.8111 |
| 11.46 |
| 101 |
| 11.88 |
| 104.68 |
| 4.77% |
| BTI |
| British American Tobacco |
| Consumer Staples |
| Tobacco |
| United Kingdom |
| 7.94 |
| 8.84% |
| 2.45% |
| 3.094 |
| 32.11 |
| 101 |
| 32.37 |
| 100.15 |
| 4.57% |
Source: The Author, data from Seeking Alpha
Risk Analysis of The Current Composition of The Dividend Income Accelerator Portfolio
Risk Analysis: Analyzing the Companies’ 60M Beta Factors
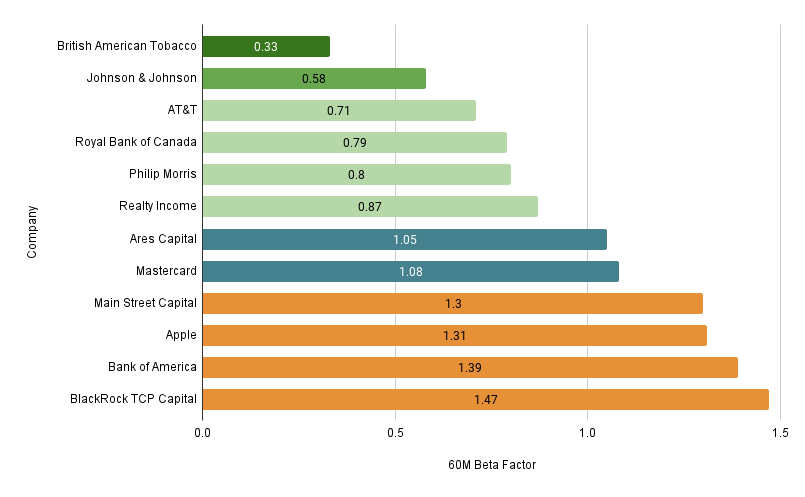
The graphic below illustrates the 60M Beta Factors of the companies that are part of The Dividend Income Accelerator Portfolio. The chart reveals that half of the portfolio’s 12 individual positions have a 60M Beta Factor below 1.
These low 60M Beta Factors demonstrate that the companies can contribute to reducing portfolio volatility, thus indicating a low risk level for investors.
The companies which contribute most to reducing portfolio volatility are British American Tobacco (60M Beta Factor of 0.33), Johnson & Johnson (60M Beta Factor of 0.58), AT&T (0.71), Royal Bank of Canada (0.79), Philip Morris (0.8), and Realty Income (0.87).
Source: The Author, data from Seeking Alpha
It is worth highlighting that the latest incorporation of British American Tobacco into The Dividend Income Accelerator Portfolio contributes significantly to the portfolio’s reduced volatility and risk level.
Risk Analysis: Analyzing the companies’ Payout Ratios
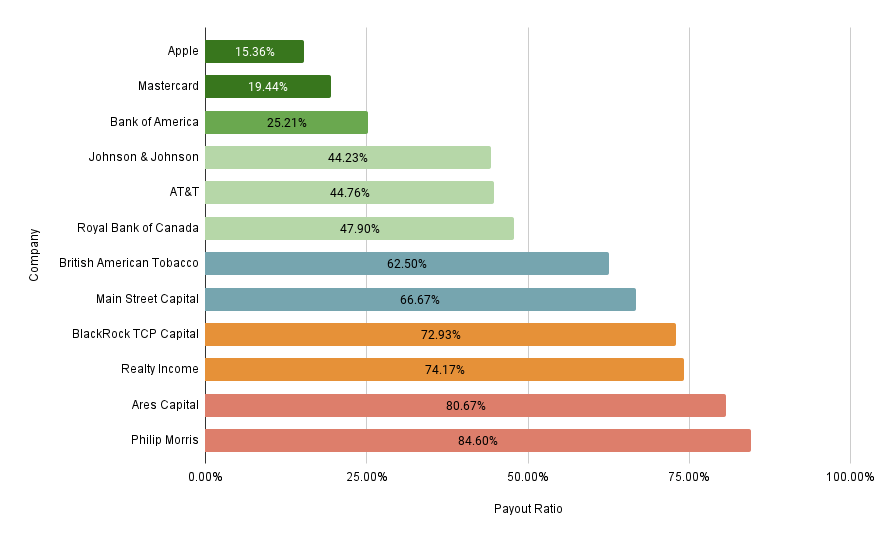
The graphic below shows the Payout Ratios of the companies that are part of The Dividend Income Accelerator Portfolio. The chart shows that 10 of the 12 companies maintain a Payout Ratio below 80%, highlighting the reduced risk level of The Dividend Income Accelerator Portfolio.
A low Payout Ratio indicates that there is plenty of room for dividend enhancements. A high Payout Ratio, however, can be seen as a warning signal that the probability of a dividend cut is higher, which could have a strong negative impact on the company’s stock price, representing a risk factor for investors.
Considering the individual companies that are part of The Dividend Income Accelerator Portfolio, Apple has the lowest Payout Ratio (15.36%), followed by Mastercard (19.44%), Bank of America (25.21%), Johnson & Johnson (44.23%), AT&T (44.76%), and Royal Bank of Canada (47.90%).
Source: The Author, data from Seeking Alpha
Only Ares Capital (Payout Ratio of 80.67%), and Philip Morris (84.60%) have a Payout Ratio above 80%. The higher payout ratios of Ares Capital and Philip Morris compared to the other companies of the portfolio, reinforce my decision not to over-represent the two stocks in The Dividend Income Accelerator Portfolio. Doing so reduces the risk level for investors while boosting the potential of a successful investment performance.
Risk Analysis: Analyzing the companies’ EPS Growth Rates
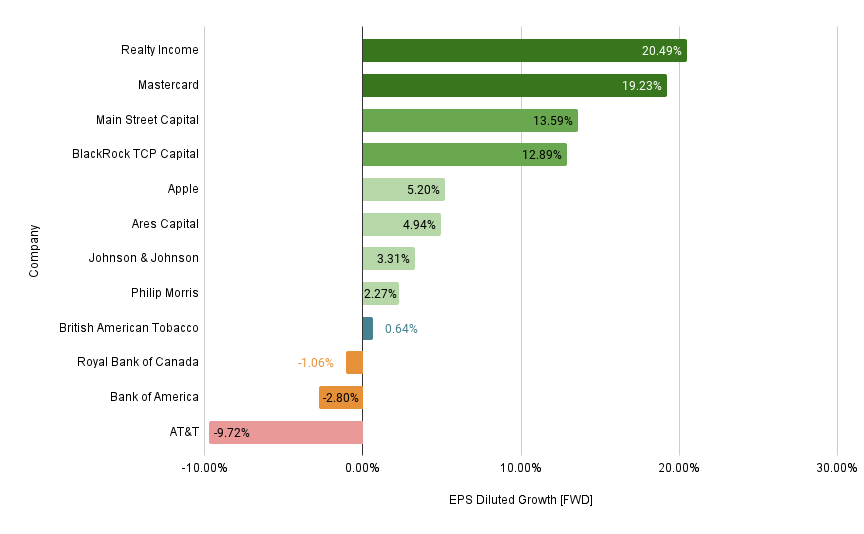
The graphic below illustrates the EPS Growth Rates of the individual companies that are part of The Dividend Income Accelerator Portfolio.
The chart shows that nine out of the 12 individual companies have shown positive EPS Growth Rates.
Four out of the 12 companies have even shown double digit EPS Growth Rates [FWD]: Realty Income (EPS Growth Rate [FWD] of 20.49%), Mastercard (19.23%), Main Street Capital (13.59%), and BlackRock TCP Capital (12.89%).
Only three from the 12 selected companies have shown a negative EPS Growth Rate: AT&T (EPS Growth Rate [FWD] of -9.72%), Bank of America (-2.80%), and Royal Bank of Canada (-1.06%).
Source: The Author, data from Seeking Alpha
These metrics are a clear indicator of the companies’ commitment to providing shareholder value. It also serves as an additional indicator that The Dividend Income Accelerator Portfolio has a reduced risk level and therefore, an elevated probability of producing favorable investment outcomes.
Risk Analysis: The Dividend Income Accelerator Portfolio’s Diversification Across Companies/ETF
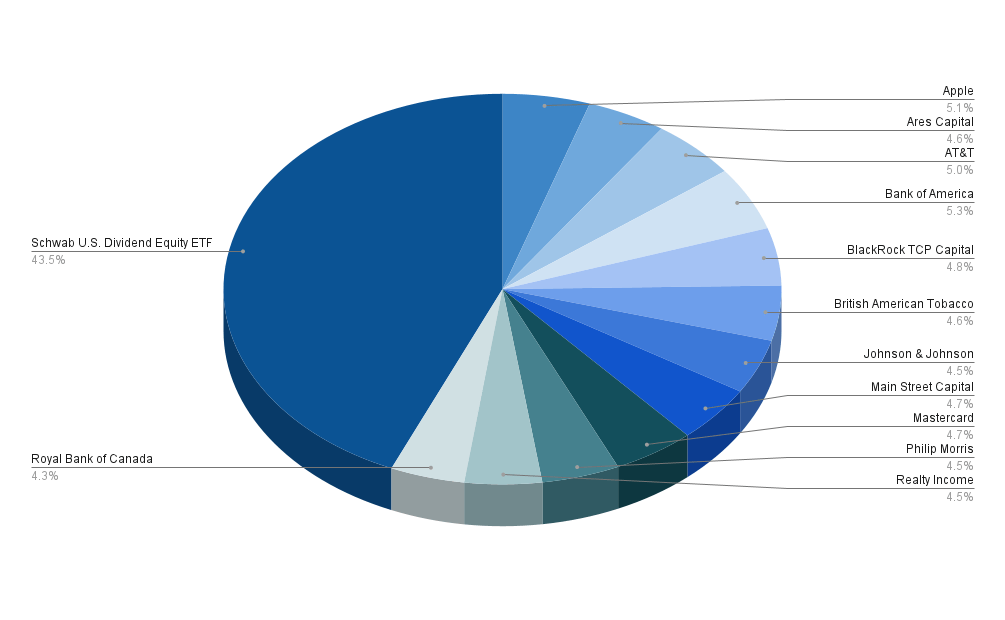
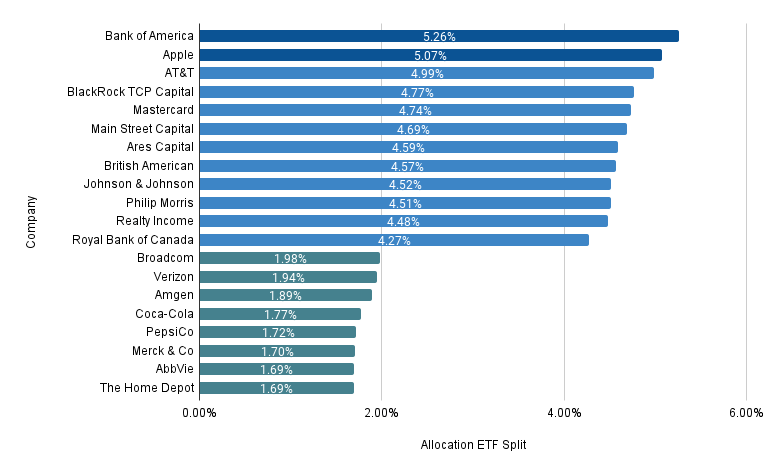
Presently, Schwab U.S. Dividend Equity ETF represents the largest position of The Dividend Income Accelerator Portfolio, accounting for 43.5%.
With a proportion of 5.26%, Bank of America represent the largest individual company compared to the overall portfolio, followed by Apple (with a proportion of 5.07%), and AT&T (4.99%).
The fact that the Payout Ratios of the three largest positions are significantly below 50%, further confirms my theory that this portfolio offers investors a reduced risk level: as shown in the previous chapter, Bank of America’s Payout Ratio stands at 25.21%, Apple’s at 15.36%, and AT&T’s at 44.76%, indicating a low probability of a dividend cut for the three largest positions of The Dividend Income Accelerator Portfolio.
The graphic below illustrates the portfolio allocation per Company/ETF:
Source: The Author, data from Seeking Alpha
Risk Analysis: The Dividend Income Accelerator Portfolio’s Diversification Across Companies When Allocating SCHD to the Companies It Is Invested In
The graphic below demonstrates the current portfolio allocation of The Dividend Income Accelerator Portfolio when allocating Schwab U.S. Dividend Equity ETF across the companies it is invested in.
I have carefully selected the companies below to ensure that none of the individual companies I have added are already part of Schwab U.S. Dividend Equity ETF. This ensures that the portfolio has a low company-specific concentration risk.
It is worth highlighting that even when allocating Schwab U.S. Dividend Equity ETF across the companies it is invested in, only Bank of America (with a proportion of 5.26%) and Apple (5.07%) account for more than 5% of the overall investment portfolio.
All other companies account for less than 5%, indicating a reduced company-specific concentration risk for investors of The Dividend Income Accelerator Portfolio.
It is also worth mentioning that all companies that currently account for less than 2% of the overall portfolio are indirect investments through the investment in Schwab U.S. Dividend Equity ETF. Please note that in the graphic below, only the current largest 20 positions of The Dividend Income Accelerator Portfolio are included (including 12 direct investments in individual companies and the 8 largest positions of Schwab U.S. Dividend Equity ETF).
Source: The Author, data from Seeking Alpha and Morningstar
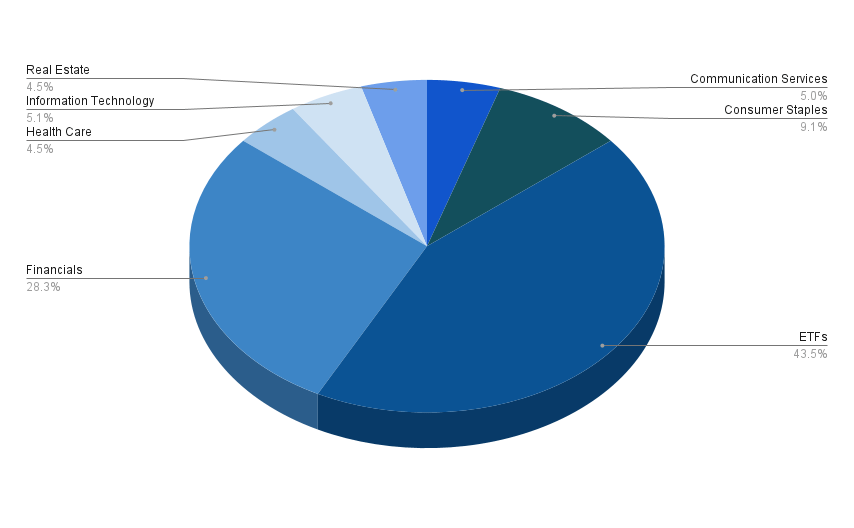
Risk Analysis: The Dividend Income Accelerator Portfolio’s Diversification Across Sectors
The ETF Sector represents the largest sector of The Dividend Income Accelerator Portfolio at this moment in time, accounting for 43.5% of the overall portfolio.
The second largest sector is the Financials Sector, representing a proportion of 28.3%. This sector is represented by Bank of America (5.26%), BlackRock TCP Capital (4.77%), Mastercard (4.74%), Main Street Capital (4.69%), Ares Capital (4.59%), and Royal Bank of Canada (4.27%).
The third largest sector is the Consumer Staples Sector with 9.1%. The Consumer Staples Sector is represented by British American Tobacco (4.57%) and Philip Morris (4.51%).
The fourth largest sector is the Information Technology Sector, represented by Apple (5.07%), followed by the Communication Services Sector (represented by AT&T with 4.99%),
The Heath Care Sector (represented by Johnson & Johnson) accounts for 4.52% of the overall investment portfolio.
The Real Estate Sector (represented by Realty Income) accounts for 4.48%.
Source: The Author, data from Seeking Alpha
Beside the ETF Industry, only the Financials Sector accounts for a larger proportion of the overall portfolio (with 28.3%). All other sectors account for less than 10%, indicating a reduced risk level for investors.
However, the Financials Sector accounting for such a large proportion of the overall investment portfolio does imply some sector-specific concentration risk.
ETFs (43.5%)
- Schwab U.S. Dividend Equity ETF (43.5%)
Financials Sector (28.32%)
- Bank of America (5.26%)
- BlackRock TCP Capital (4.77%)
- Mastercard (4.74%)
- Main Street Capital (4.69%)
- Ares Capital (4.59%)
- Royal Bank of Canada (4.27%)
Consumer Staples (9.08%)
- British American Tobacco (4.57%)
- Philip Morris (4.51%)
Information Technology (5.07%)
- Apple (5.07%)
Communication Services (4.99%)
- AT&T (4.99%)
Health Care (4.52%)
- Johnson & Johnson (4.52%)
Real Estate (4.48%)
- Realty Income (4.48%)
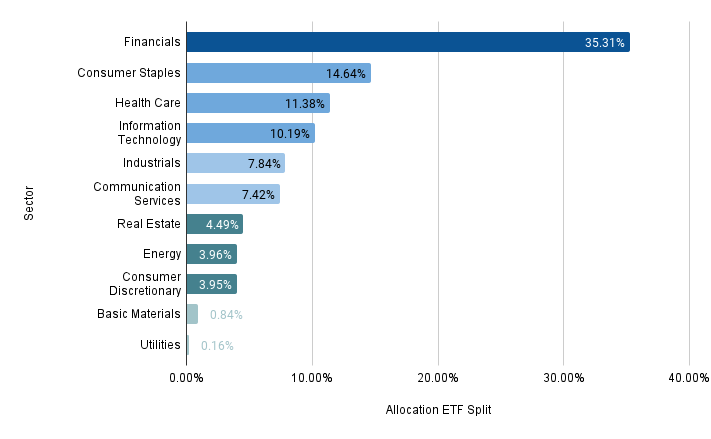
Risk Analysis: The Dividend Income Accelerator Portfolio’s Diversification Across Sectors When Allocating SCHD to the Sectors It Is Invested In
The graphic below illustrates the portfolio allocation per sector when allocating Schwab U.S. Dividend Equity ETF across the sectors it is invested in.
It can be noted that the Financials Sector is by far the largest sector, with a proportion of 35.31% of the overall portfolio, again indicating some sector-specific concentration risk of The Dividend Income Accelerator Portfolio.
The Consumer Staples Sector presently represents 14.64% of the overall investment portfolio, followed by the Health Care Sector (with 11.38%), and the Information Technology Sector (with 10.19%).
The Industrials Sector (with 7.84%), and the Communication Services Sector (with 7.42%) account for significantly less than 10% of the overall portfolio.
The Real Estate Sector (with 4.49%), the Energy Sector (3.96%), the Consumer Discretionary Sector (3.95%), the Basic Materials Sector (0.84%), and the Utilities Sector (0.16%) account for significantly less than 5% of the overall investment portfolio, indicating a reduced risk level for investors.
Source: The Author, data from Seeking Alpha
Through the inclusion of additional companies into The Dividend Income Accelerator Portfolio within the next weeks, I will expand the portfolio’s diversification, reducing the sector-specific concentration risk that it currently has due to its concentrated allocation to the Financials Sector.
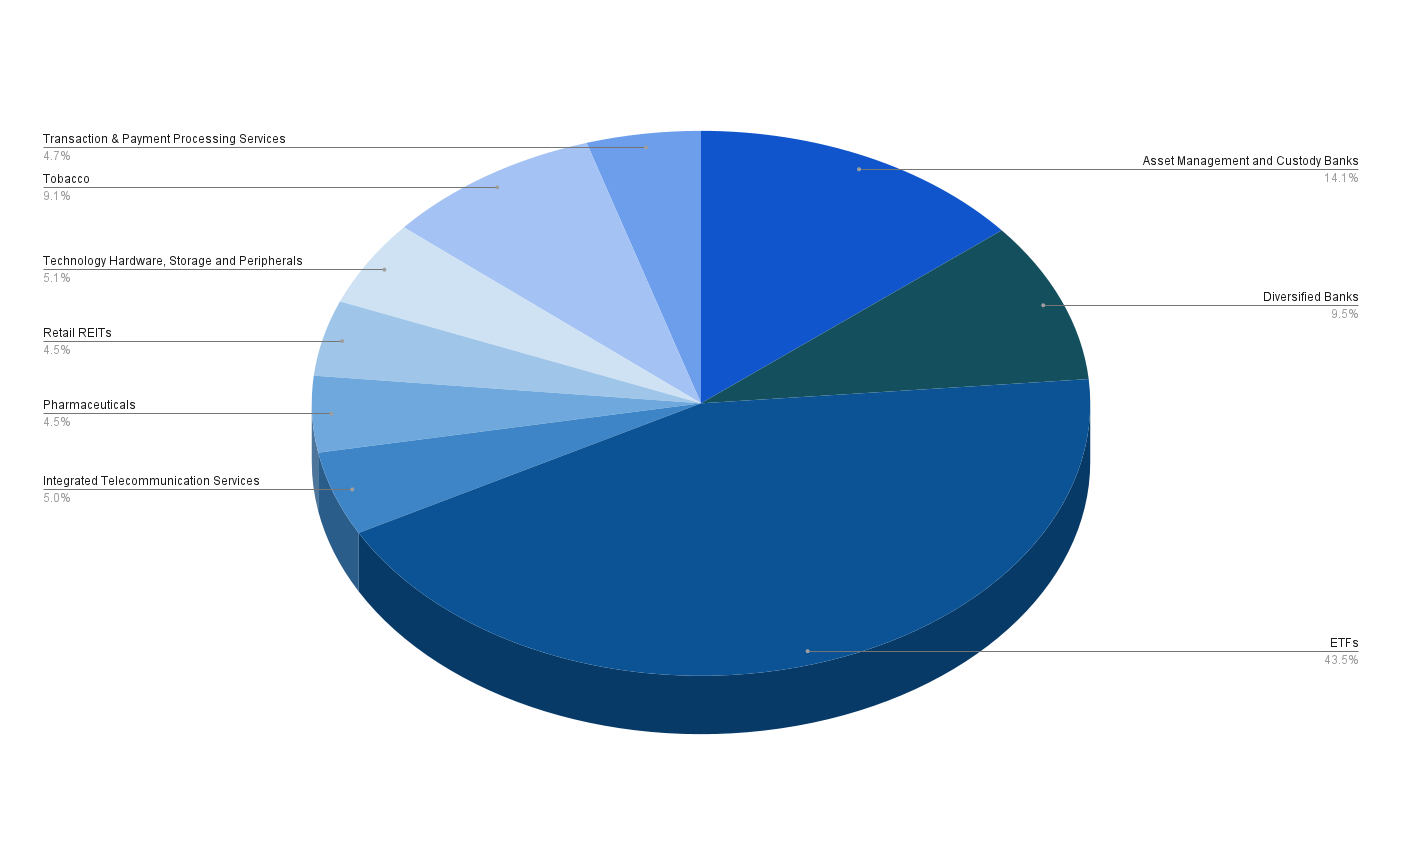
Risk Analysis: The Dividend Income Accelerator Portfolio’s Diversification Across Industries
The graphic below shows the portfolio allocation per industry. It can be highlighted that the ETF Industry accounts for the largest proportion of the overall investment portfolio (43.5%).
The second largest industry is the Asset Management and Custody Banks Industry with 14.1%. This industry is represented by BlackRock TCP Capital (4.77%), Main Street Capital (accounting for 4.69%), and Ares Capital (4.59%).
The third largest industry is the Diversified Banks Industry, accounting for almost 10% of the overall investment portfolio. This industry is represented by Bank of America (5.26%) and Royal Bank of Canada (4.27%).
The Tobacco Industry, which is represented by British American Tobacco (4.57%) and Philip Morris (4.51%), accounts for 9.1% of the overall investment portfolio.
The fifth largest industry is the Technology Hardware, Storage and Peripherals Industry, represented by Apple with 5.07%.
All other industries account for less than 5% of the overall portfolio, highlighting, once again the reduced risk level of The Dividend Income Accelerator Portfolio.
Source: The Author, data from Seeking Alpha
Risk Analysis: The Dividend Income Accelerator Portfolio’s Geographical Diversification
The graphic below illustrates the country allocation of the portfolio. It highlights a pre-dominant share of companies based in The United States, representing 91.1% of the overall investment portfolio.
8.9% of the portfolio’s companies are situated outside the United States: British American Tobacco (from the United Kingdom) represents a share of 4.6% of the overall portfolio, and Royal Bank of Canada (from Canada), a share of 4.3%.
Source: The Author, data from Seeking Alpha
The illustration reveals that The Dividend Income Accelerator Portfolio achieves a degree of geographical diversification, effectively reducing its geographic-specific concentration risk.
Risk Analysis: The Equity Style of The Dividend Income Accelerator Portfolio When Allocating SCHD Across the Equities It Is Invested In
Through the allocation of Schwab U.S. Dividend Equity ETF across the equities it is invested in, it can be noted that The Dividend Income Accelerator Portfolio consists of 71% large-cap companies, 18% mid-cap companies and 11% small-cap companies. The Dividend Income Accelerator’s focus on large-cap companies is an indicator of the portfolio’s reduced risk-level.
In addition to that, it is worth highlighting that 56% of the current composition of The Dividend Income Accelerator Portfolio consists of value companies, 34% of core companies (which combine value and growth), and 10% of growth companies. The portfolio’s focus on value companies is an additional indicator that highlights the lower level of risk for investors.
The largest proportion of The Dividend Income Accelerator Portfolio is invested in large-cap companies with a focus on value (40%), once again underscoring its low level of risk.
Source: The Author, data from Seeking Alpha and Morningstar
The Strength of The Current Composition of The Dividend Income Accelerator Portfolio
- Attractive Weighted Average Dividend Yield [TTM]: The current Weighted Average Dividend Yield [TTM] of The Dividend Income Accelerator Portfolio stands at 4.69%, highlighting its ability to generate extra income via dividends for investors.
- Attractive 5 Year Weighted Average Dividend Growth Rate: The current 5 Year Weighted Average Dividend Growth Rate [CAGR] of The Dividend Income Accelerator Portfolio stands at 9.03%, clearly demonstrating that the companies should be able to raise their dividends in the years to come.
- Reduced Volatility through the inclusion of companies with a low Beta Factor: British American Tobacco (60M Beta Factor of 0.33), Johnson & Johnson (0.58), AT&T (0.71), Royal Bank of Canada (0.79), Philip Morris (0.8), and Realty Income (0.87) have a 60M Beta Factor below 1 and contribute to reducing the volatility of The Dividend Income Accelerator Portfolio, underlying its reduced risk level.
- Inclusion of companies with a low Payout Ratio: Six from the 12 individual companies that are part of The Dividend Income Accelerator Portfolio have a Payout Ratio below 50%, indicating a low likelihood of a dividend cut.
- Inclusion of companies that have shown a strong EPS Growth Rate [FWD]: Nine out of the 12 individual companies have shown positive EPS Growth Rates [FWD], strengthening my thesis that the probability of a dividend cut is relatively low.
- Reduced company specific concentration risk: Even when allocating Schwab U.S. Dividend Equity ETF across the companies it is invested in, no single company accounts for more than 5.5% of the overall investment portfolio. This indicates a reduced company-specific concentration risk.
- Diversification over sectors: When allocating Schwab U.S. Dividend Equity ETF across the sectors it is invested in, only one sector (the Financials Sector with 35.31%) accounts for a larger proportion of the overall portfolio. All other sectors represent less than 15% of the overall investment portfolio.
- Diversification over industries: No Industry accounts for more than 15% of the overall portfolio (besides the ETF Industry), once again highlighting the portfolio’s reduced industry-specific concentration risk.
- Geographical Diversification: The majority of companies in The Dividend Income Accelerator Portfolio come from the United States (91.1%). However, it has still achieved some geographical diversification.
- Diversification over Equity Styles: The Dividend Income Accelerator Portfolio is diversified across Equity Styles. However, the largest proportion are large-cap companies with a focus on value, again indicating a reduced risk level for investors.
Weaknesses Of the Dividend Income Accelerator Portfolio’s Current Composition
Sector-Specific Concentration Risk due to the Financials Sector’s Large Share of The Overall Portfolio
I believe that the substantial presence of the Financials Sector in The Dividend Income Accelerator Portfolio's composition is currently the primary risk factor for its investors. The Financials Sector currently accounts for 28.32% of the overall portfolio (and even 35.31% when allocating Schwab U.S. Dividend Equity ETF across the sectors it is invested in).
To mitigate this risk, I will additionally diversify the portfolio in the coming weeks and months by incorporating companies from other sectors.
However, it is important to note that I do not see the heavy allocation in the Financials Sector as a significant risk for long-term investors, since I believe factors that could possibly negatively affect the Financials Sector would be predominantly temporary.
I am confident that over the long term, the Financials Sector provides investors with attractive investment opportunities and I plan to maintain a significant allocation to it for The Dividend Income Accelerator Portfolio. However, the allocation will be slightly reduced from its current level.
The Portfolio Is Presently Exclusively Invested in Equities With No Allocation to Fixed Income
Another weakness of the current composition of The Dividend Income Accelerator Portfolio is its exclusive allocation to equities, with no allocation to fixed income.
However, it is important to note that over the long term, equity investments offer the potential for a higher return compared to fixed income (like corporate bonds or government bonds, for example).
It is further worth noting that I do not see the absence of fixed income assets in The Dividend Income Accelerator Portfolio as a significant risk factor, as long as you invest over the long term, following the long term investment approach of The Dividend Income Accelerator Portfolio.
However, to further reduce the risk level of The Dividend Income Accelerator Portfolio, I am considering adding fixed income assets in the future.
Conclusion
In this article, I have shown you a concept for the construction of a broadly diversified dividend portfolio, which effectively combines dividend income and dividend growth while providing investors with a high probability of reaching attractive investment outcomes, given its reduced risk level.
The Dividend Income Accelerator’s Attractive Mix of Dividend Income and Dividend Growth
The Dividend Income Accelerator Portfolio is still in its construction phase, and I will incorporate additional companies in the following weeks and months.
However, I believe that the portfolio already provides investors with an attractive combination of dividend income and dividend growth, which is reflected in its Weighted Average Dividend Yield [TTM] of 4.69% and 5 Year Weighted Average Dividend Growth Rate [CAGR] of 9.03%, making the portfolio the ideal choice for those seeking to combine dividend income with dividend growth.
The Dividend Income Accelerator’s Reduced Risk Level Due to Its Broad Diversification and Its Inclusion of Companies With Low Beta Factors
In addition, I have shown that the portfolio is extensively diversified, offering investors a broad diversification across companies, sectors and industries. This is the case even when allocating Schwab U.S. Dividend Equity ETF to the companies and sectors it is invested in. This indicates a reduced company-specific and sector-specific concentration risk. The portfolio’s reduced risk level is further underscored due to its priorization of large-cap companies with a focus on value, which represent 40% of the overall portfolio.
The inclusion of companies with a low Beta Factor, such as British American Tobacco (60M Beta Factor of 0.33), Johnosn & Johnson (0.58), AT&T (0.71), Royal Bank of Canada (0.79), Philip Morris (0.8), and Realty Income (0.87) additionally underlines the portfolio’s reduced risk level.
I will continue investing $400 each month to The Dividend Income Accelerator Portfolio, incorporating additional companies to further enhance its diversification and reduce its risk level.
The Dividend Income Accelerator’s High Potential for Attractive Investment Outcomes
The reduced risk level of The Dividend Income Accelerator Portfolio will help us to reach favorable investment outcomes with a high probability. This makes The Dividend Income Accelerator Portfolio a high potential dividend portfolio in my opinion.
Author’s Note: It would be great to hear your opinion on the current composition of The Dividend Income Accelerator Portfolio. Which companies do you think would best align with the investment approach of The Dividend Income Accelerator Portfolio?
For further details see:
How To Build A High-Potential Dividend Portfolio Combining Dividend Income With Dividend Growth