TXN - How To Build Wealth: Buy Low And Sell High Consistently
Summary
- What if we could buy low and sell high on a consistent basis? Sounds too good to be true?
- We discuss a systematic and rather conservative strategy to buy low and sell high using DGI stocks with minimal trading.
- In our back-testing of 27 years, the strategy provided a 15% annualized return over 27 years vs. less than 10% from the S&P 500.
- A 5% outperformance can make a huge difference and return tens of thousands of extra dollars over 27 years. Further, the S&P 500 performance streak of the last decade is unlikely to continue in the next decade.
The title may appear to be so obvious; after all, who does not know that buying stocks at the bottom and selling at the peak can lead to big gains. But it is much easier said than done. It is almost impossible for most people to be right not once but twice every time they make a trade. In fact, most retail investors end up doing the opposite, not by design but for a host of other reasons.
What we are trying to lay out in this article is a methodology that any common investor can apply and get rich over time, provided they apply it consistently with discipline. Certainly, it is not a get-rich-quick scheme. Also, this is not something new that is invented by us; rather, most of it is common knowledge. We are just providing a systematic and methodical approach to how to achieve these goals almost effortlessly. We are going to demonstrate by way of back-testing some 15 stocks over a very long period of time how you can consistently buy low and sell high and beat the market constantly. Also, another big advantage is to remove the emotional bias, fear, or stress about making buy/sell decisions. This approach will also result in much lower volatility than the broader market.
However, there are some caveats; here they are:
- This is not a get-rich-quick scheme, so it needs patience and time for the investments to grow and compound over time.
- The strategy needs discipline and some knowledge of the market. You may have to at least spend some time periodically (six months or so) to monitor your positions/holdings and ensure that they remain fundamentally strong and continue to meet the investment goals that you set for them.
Who Should Use This Strategy?
Normally, we advocate investment in multiple strategies for long-term investors. By combining many strategies, we are able to bring diversification, improve returns, and reduce overall volatility and risks. Not all strategies are going to behave in the same manner at all times. When one strategy zigs, some others will zag.
We want to clarify that the strategy discussed in this article may not be suitable for everyone. If all of your investable cash is ready to be deployed today, this strategy may not work best for you.
This strategy will work best for:
- Folks who are in the accumulation phase and likely to contribute significant sums periodically or on a regular basis.
- Folks who may not be in the accumulation phase but are able to periodically transfer some of their assets/cash from other passive accounts to this strategy.
- If your entire savings and contributions are within a 401(k) type of account, you may still be in luck since many 401(( K )) providers/managers (like Fidelity) allow a part of the assets to be self-managed inside a brokerage-type account.
Since we are always looking for alpha in our investment approach, we continue to experiment and back-testing different ideas.
Buy-Low Sell-High Strategy ["BLSH"] Using DGI Stocks
Assumptions:
It may be best suited for folks who are in the accumulation phase and are still 10-20 years away from retirement. That said, it can still be used by anyone who is investing regularly in the stock market. This strategy may not be suitable for people who are already in the withdrawal phase since they will be selling and not buying most of the time. However, if they only withdraw the dividends, the strategy could still work for them. But everyone's situation is different, and we recommend readers should judge the suitability based on their own situation.
This strategy does not require you to invest all of the money upfront in a lump sum. It would require you to invest gradually over a period of time, likely many years. How much you invest depends again on your personal situation, but the strategy provides a lot of flexibility. The strategy would not compare or work well if your goal was to invest the entire amount in a lump sum upfront.
Buy Strategy:
The strategy will invest for the long term in the following kind of stocks:
- The selected companies should be fairly large, stable blue chip companies, having a market capitalization of at least $10 billion.
- The companies pay a good dividend and have a dividend history of at least ten years.
- We will select at least half of the companies that are dividend aristocrats (or champions), meaning they have at least 25 years of dividend history with continual dividend growth.
- The rest of the companies could have a shorter dividend history, but still, we would want at least ten years of dividend history.
Buy-Low Factor:
For each stock, we will calculate the average price of the previous 252 days (which is approximately one year in terms of trading days). This can be done on a daily basis or weekly basis; however, for our testing, we will use daily end-of-day data. We multiply this average price by a factor like 0.90 or 0.85, etc., giving us the "target price." We will call this multiplication factor the "Buy-Low-Factor." We will provide the details below as to how we determine this factor. Thereafter, at the end of each day or week, we will compare the current price with the target price. If the current price is lower than the target price, we will buy the next lot of shares. We also determine the maximum number of shares that we want to have in any single company.
For any given stock, we should look at the annual volatility. For low-volatility stocks, the Buy-Low Factor would be 0.90. For stocks with higher volatility, it should be 0.85. Our strategy (presented in this article) will rely mostly on low or medium-volatility stocks. You can measure the volatility of a given stock over the past year and compare it with the S&P 500. But you could just make a guess generally based on the stock, the gap between its 52-week high and low, and the industry in which it operates.
Some examples of low or high-volatility stocks:
- Coca-Cola ( KO ) will be considered as a low volatility stock.
- Home Depot ( HD ) or Microsoft ( MSFT ) would be considered medium volatility stocks.
- Companies like Amazon ( AMZN ) will be considered as high volatility stocks, though AMZN would not qualify for this strategy as it pays no dividends.
Nonetheless, for the purpose of this back-testing, we are only going to consider low-volatility stocks, so we will use the buy-low factor as 0.90 for all such stocks.
Example:
Stock: Procter & Gamble ( PG )
Volatility: Low
Buy-low-factor: 0.90
Initial shares to buy: 50 (the split-adjusted number could be a higher multiple)
Incremental shares to buy: 50
Maximum shares to hold at any time: 250-300 shares (this includes the acquired number of shares (without split) and does not include the shares acquired from reinvested dividends).
Sell Strategy:
Investors who may like to sell partial positions when the prices are high and valuations are rich should adopt this "sell" strategy. However, the "sell" strategy is optional. If the investor really believes in the stock/company and wants to retain the investment for the long term as buy and hold, there's no need to adopt the "sell" strategy. However, without the "sell" strategy, you may not have additional or enough funds to invest when prices are low.
As in the "buy" strategy, for each stock, on a daily (or weekly) basis, we will calculate the average price of the previous 252 days (approximately one year in trading days). However, we will use multiple criteria to determine the "sell" decision.
- Current shares match or exceed the target allocation (max number of shares for any one stock)
- And the current price is> 1.15 times 252-days-average-price
- And the current price is> 1.10 times last-buy-price (most recent buy)
- And the current price is> 1.50 times our average cost basis in the stock.
When all four conditions are met, we will sell a partial quantity (generally the same number of shares that we bought in the most recent transaction). As you can observe, the "sell" strategy is much stricter as compared to the "buy" strategy. The reason we are using the "sell" strategy (selling a partial position/quantity) is because the position may become overweight in the portfolio and thus may like to reduce the exposure. It also provides us cash to use when the prices of this stock or any other stock are low. This reduces (or eliminates at a later stage) the need to add cash to the portfolio on a constant basis.
However, highly passive investors may not like to sell at all and may just use the buy-and-hold approach.
Example:
Stock: PG
Volatility: Low
Target allocation: 250-300 shares (only sell when 300 or more shares or the invested sum has exceeded a certain threshold, excluding the reinvested dividends)
Sell-high-factor: Combination of multiple criteria as defined above.
No of shares to sell in one lot: 50
Back-Testing (1995-2022, 27 years) Results
Stock Selection:
Usually, we perform back-testing to judge if the strategy shows promise. However, we need to ensure to remove any kind of bias, though it is not always possible to have zero bias. Moreover, there are still no guarantees that a strategy will deliver similar results in the future.
For our back-testing in this article, we will select stocks (based on our opinion and research) that tend to do well during recessions and big corrections.
Some such companies are:
Automatic Data Processing ( ADP ), Amgen ( AMGN ), Clorox ( CLX ), Fastenal ( FAST ), Johnson & Johnson ( JNJ ), McDonald's ( MCD ), NextEra Energy ( NEE ), Procter & Gamble ( PG ), Verizon ( VZ ), and Walmart ( WMT ).
These stocks are selected from many sectors/industries, but at the same time, they all are solid blue-chip companies with a long history of paying dividends. Since our period of back-testing is quite long, nearly 27 years, from 1995-2022, it does introduce some selection bias. By no means can we remove the selection bias 100%, and there will always be some importance on how good or bad our initial selections are. But if we are able to select some winners, some mediocre performers, and a couple of losers, overall, we should do fine.
To further remove the impact of selection bias, if any, we will include a few stocks to our list that did not perform very well either recently or in the past. Three such stocks are Bank of America ( BAC ), Altria ( MO ), and Verizon ( VZ ). Even though all three companies have paid dividends for a long time, and one of them, MO, is actually a dividend aristocrat, so they would have otherwise satisfied our selection criteria. BAC was dragged down in 2008 due to the subprime mortgage crisis to the extent that its survival itself was at stake. BAC's dividend was cut from 32 cents to just 1 cent a quarter during the financial crisis. It eventually survived and recovered, but its share price still trades much below its pre-recession level even after the prolonged bull market.
The second company, Altria, is another example of poor performance from a former top performer. It has performed miserably in recent years. More recently, VZ has underperformed the broader market in a big way. Besides, we have some moderate performers like Walmart.
Our back-testing model would select and keep the same 15 companies for the entire period of roughly 27 years. However, in a real-life portfolio, one could add or replace some companies from time to time and keep the portfolio well-diversified and balanced.
Table-1: The final list of 15 stocks:
Author
Back-testing: Buy Low and Sell High Strategy
For back-testing purposes, we will buy a maximum of up to 250-300 shares (only 50 shares at one time) of any single stock before initiating the "sell" strategy. If the number of shares falls below 200, generally, no sale will occur, except if the total value of the invested amount in the stock has crossed a threshold (> $25,000). The back-testing model assumes that we started investing in January of 1995 and ran the model until Dec. 16, 2022.
Rules and Assumptions:
Period of testing: January 1995 – Dec. 16, 2022
Buy rules:
- Buy the first 50 shares of each stock on the first day of the test period (Jan. 03, 1995) or as early as possible. Please note that the number of shares is assumed to be on a pre-split basis. For example, if we bought 50 shares on 01/03/1995, and then there was a 2:1 split in 1997, and again in 2004, these 50 shares would automatically become 200 (50*2*2) shares.
- Buy any subsequent shares when the current price is less than the Buy-Low factor (90% for our stocks) of the average price of the past year (that is 252 days).
- Also, after the first buy, all subsequent purchases will be at least 252 trading days apart.
Sell rules:
- Do not sell unless the total shares in a company have reached 250 or the invested amount, excluding the reinvested dividends, has exceeded $25,000.
- Sell if the current price is > 1.15 times the average price of the past year (that is 252 days) and > 1.10 times the price of the last (most recent) purchase, and > 1.50 times the average purchase price of the stock in our portfolio.
- Subsequent sales will be at least 252 trading days apart.
The system will run the check for buy and sell signals on a daily basis using end-of-day data.
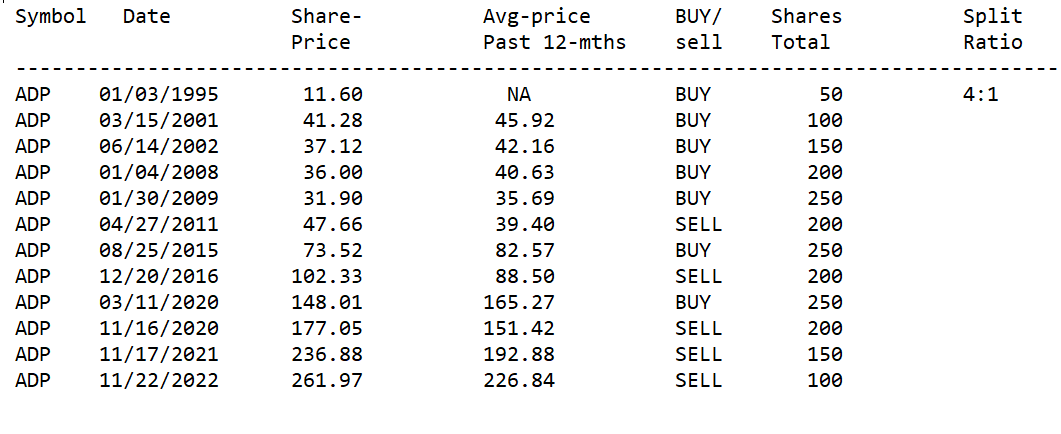
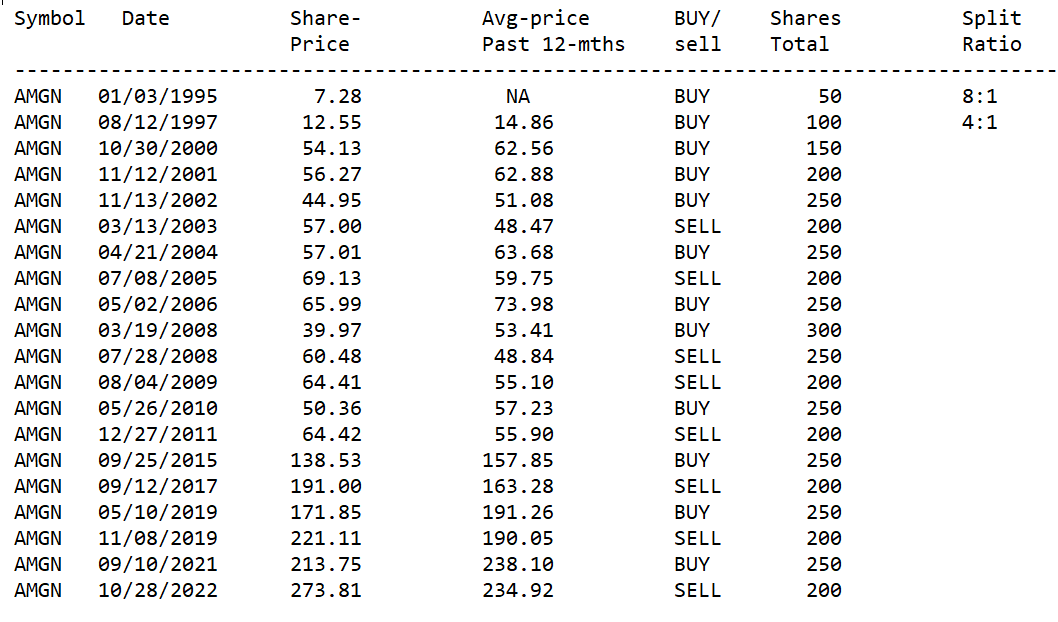
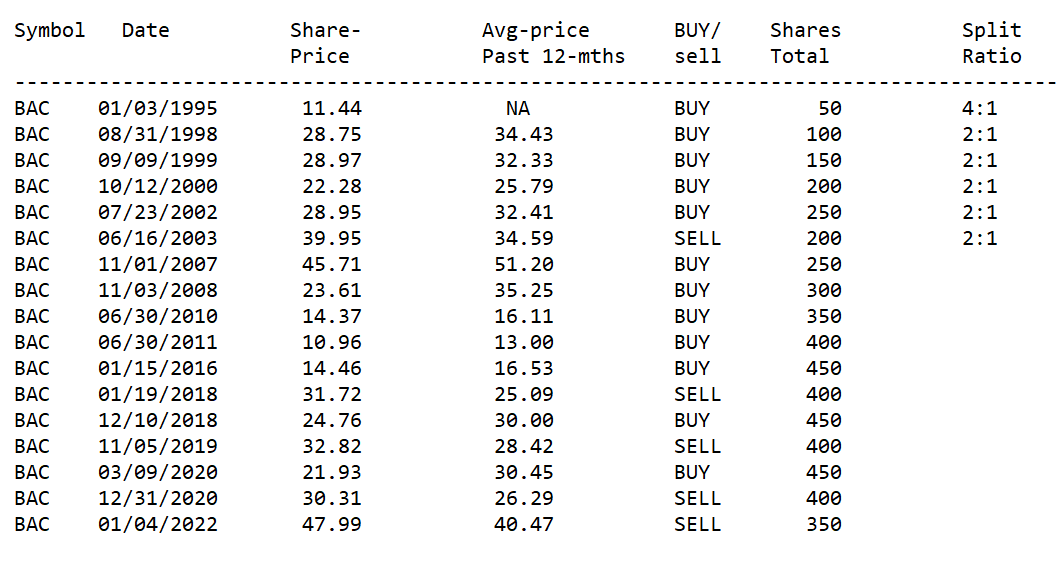
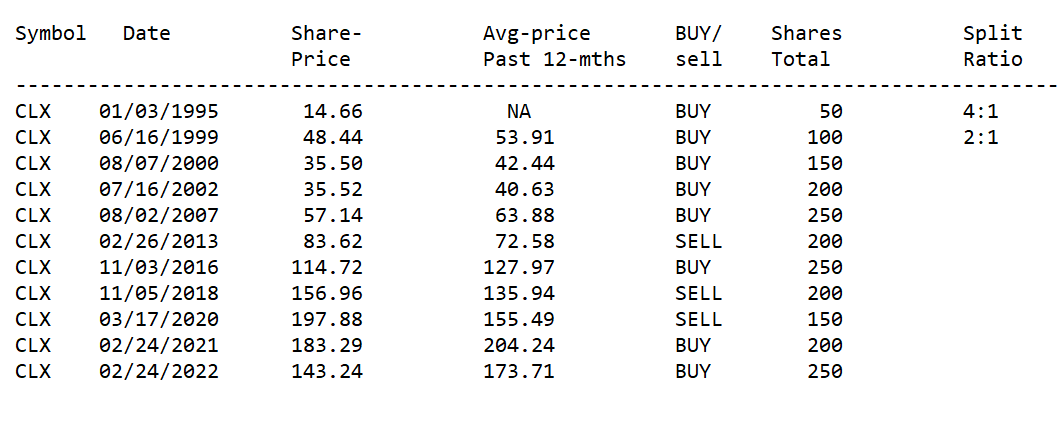
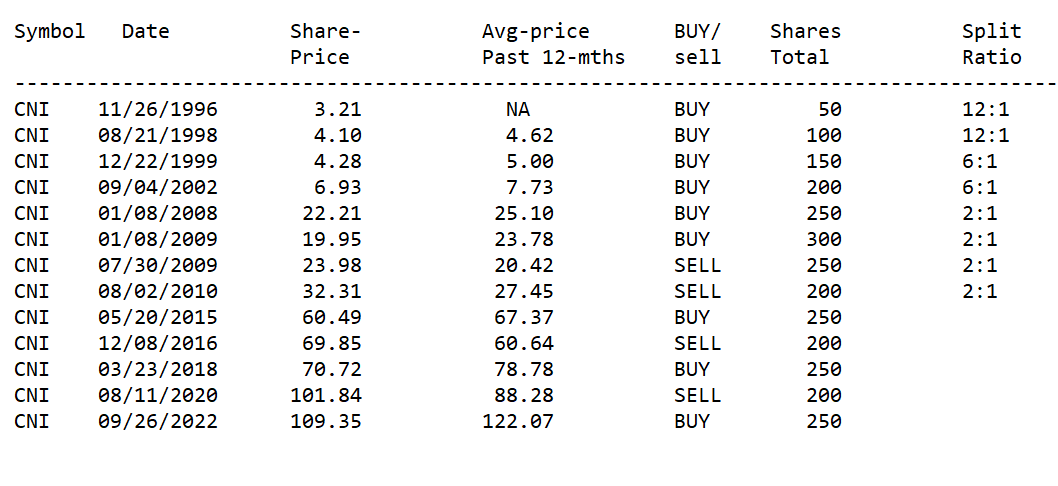
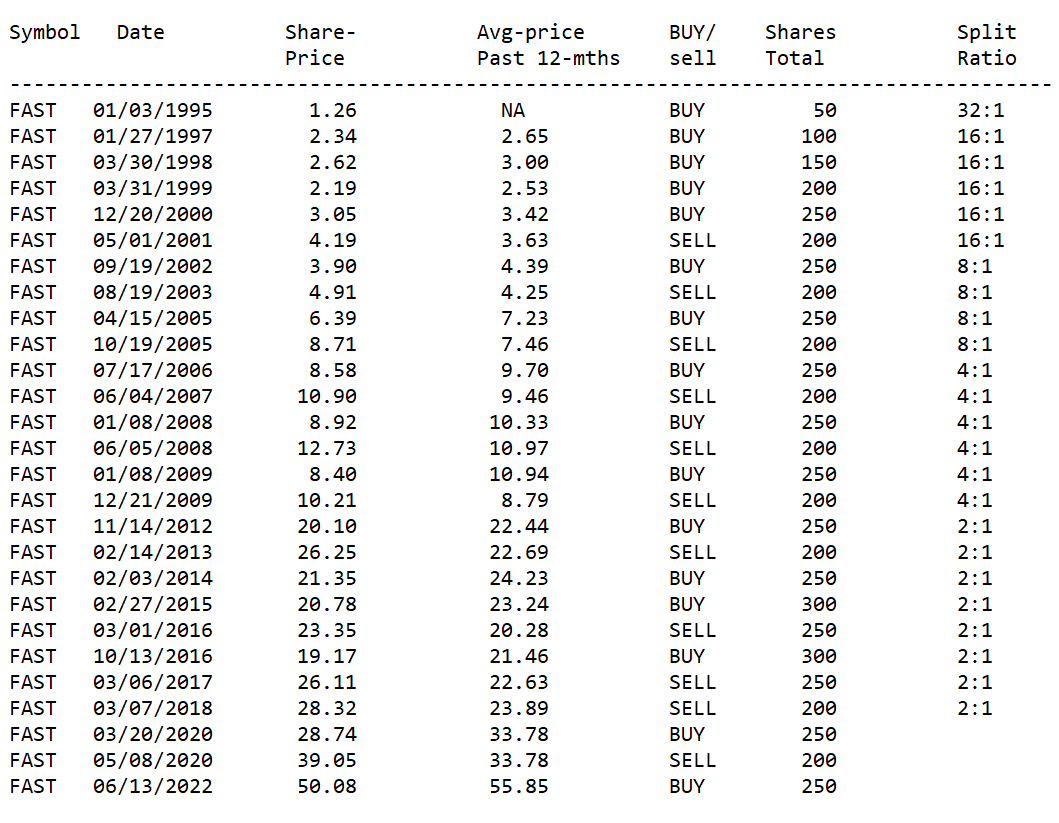
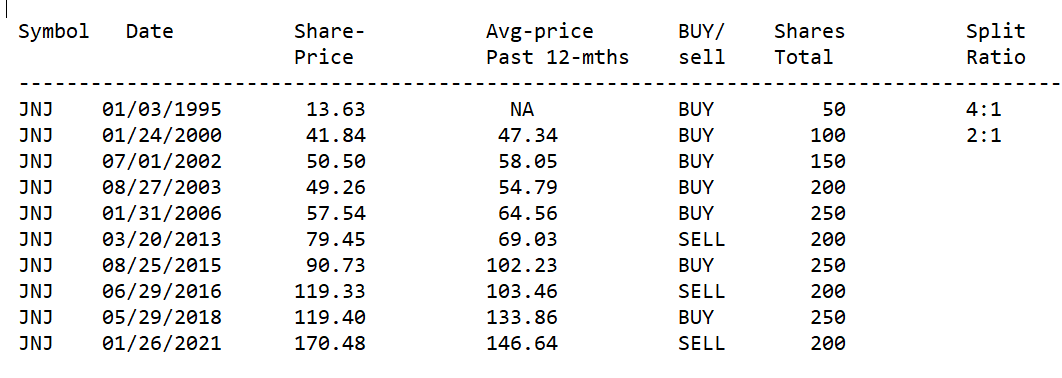
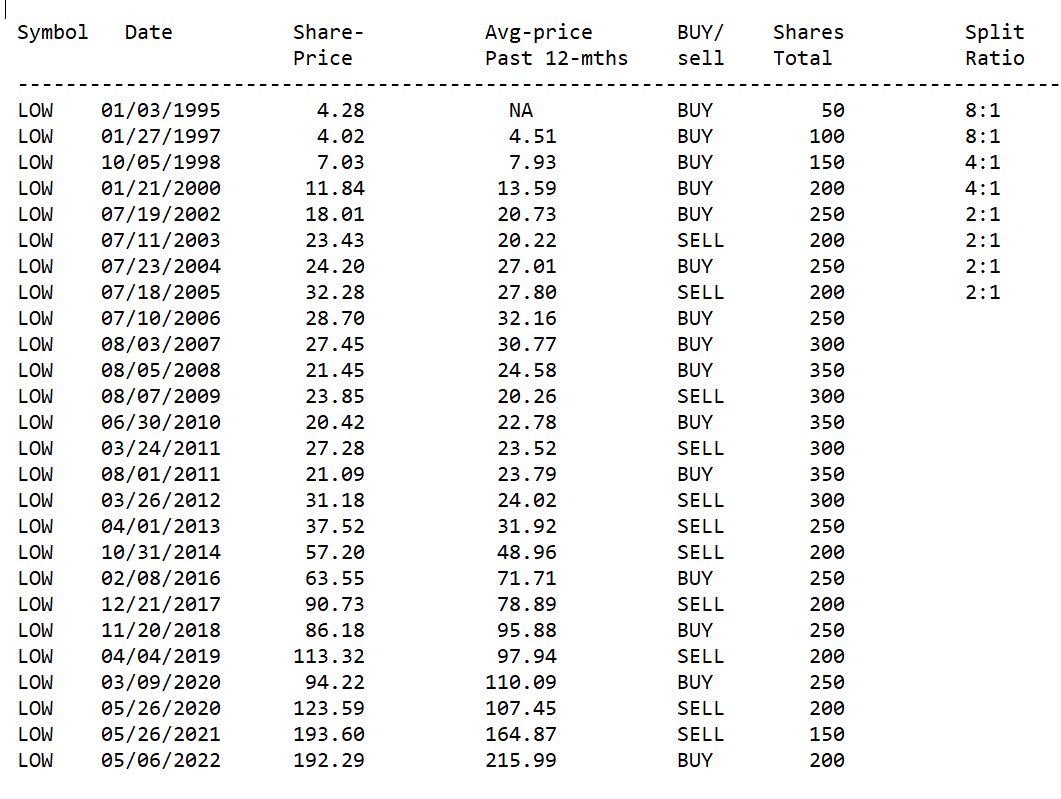
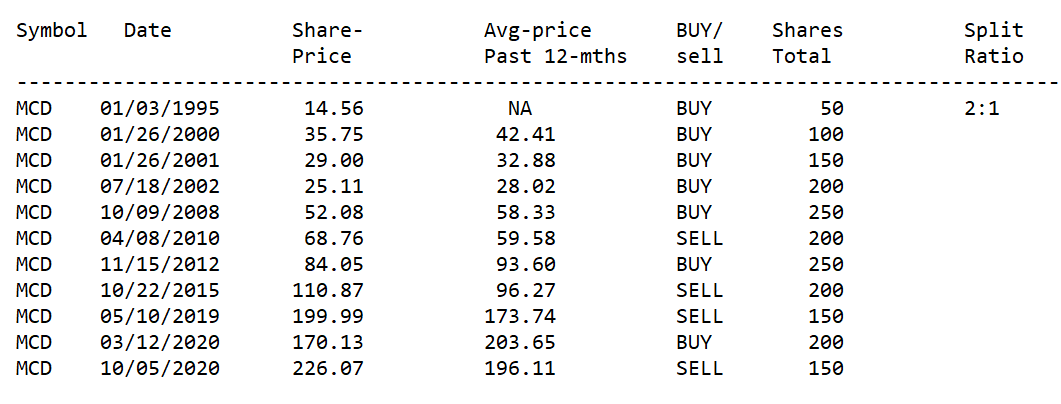
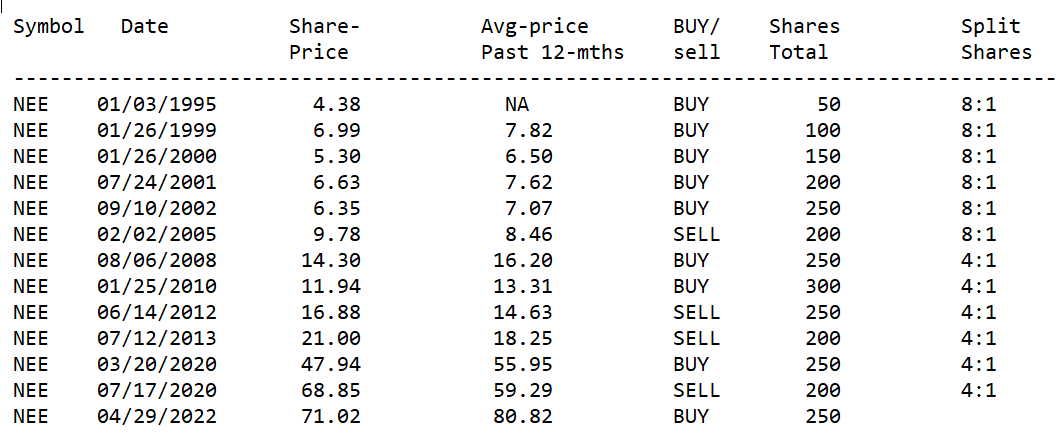
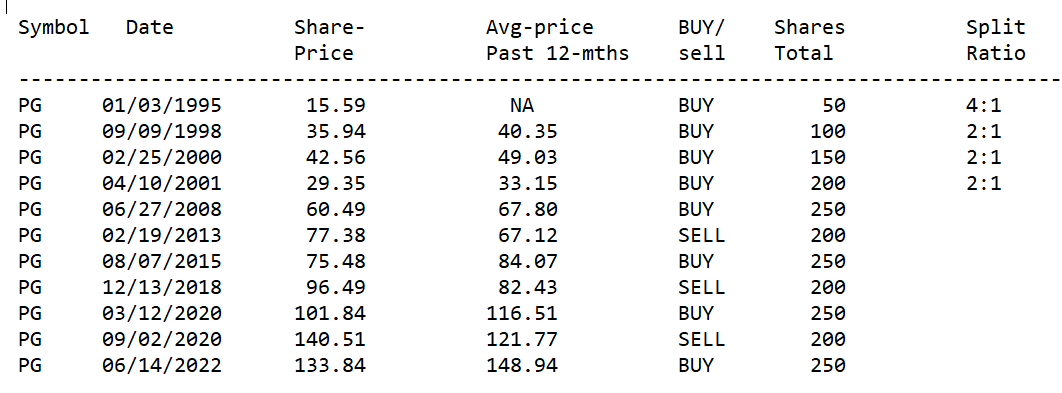
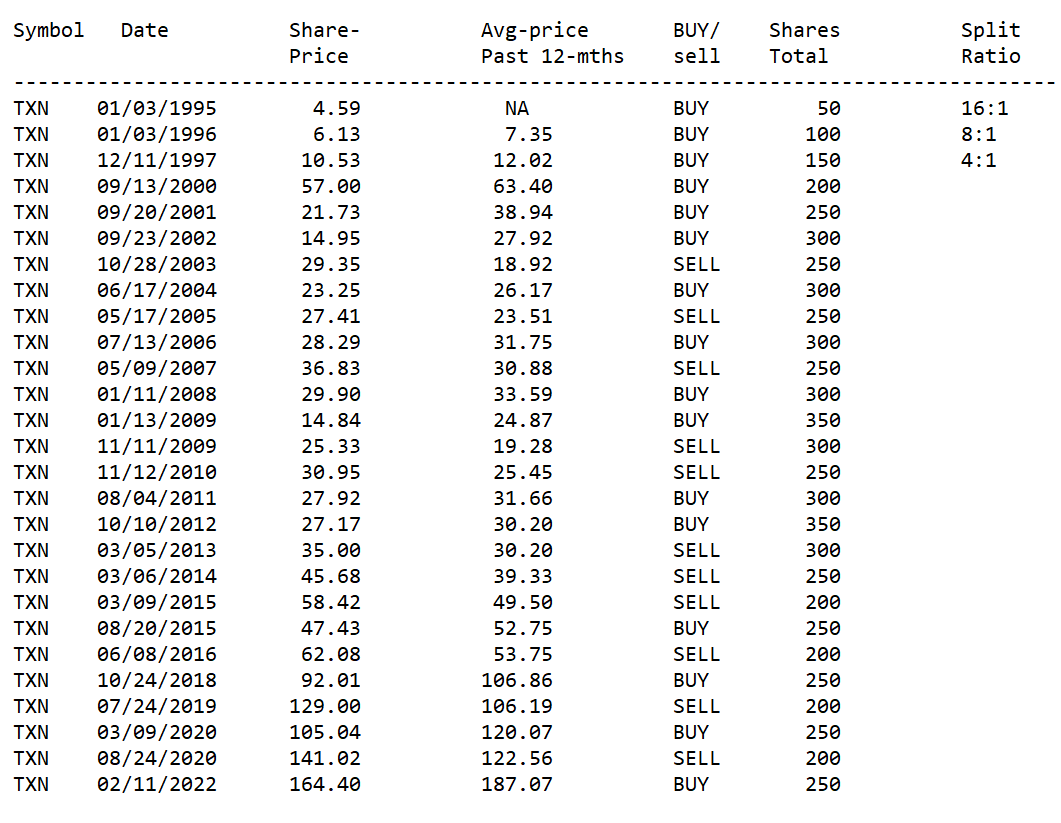
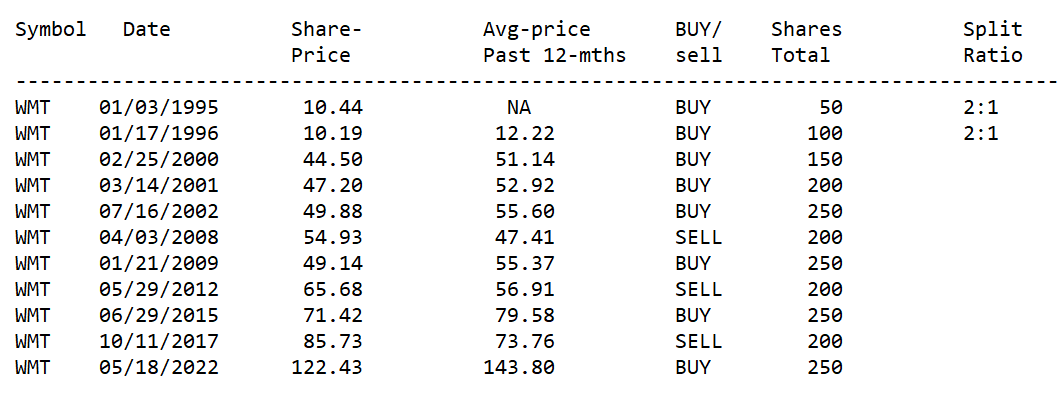
Below are the tables of buy-sell transactions as determined by our system during the period from 01/01/1995 until 12/16/2020 for each stock in our portfolio. Prices shown are split-adjusted prices.
Note: Column "Split-Ratio" - If there were two splits of 2:1 after the purchase date, the shares prior to two splits will be considered to have a split ratio of 4:1 (2*2:1), and so on. The total shares shown are on a pre-split basis.
Table-2A: ADP
Table-2B: AMGN
Table-2C: BAC :
Table-2D: CLX
Table-2E: CNI
Table-2F: FAST
Table-2G: JNJ
Table-2H: LOW
Table-2-I: MCD
Table-2J: MO
Table-2K: NEE
Table-2L: PG
Table-2M: TXN
Table-2N: VZ
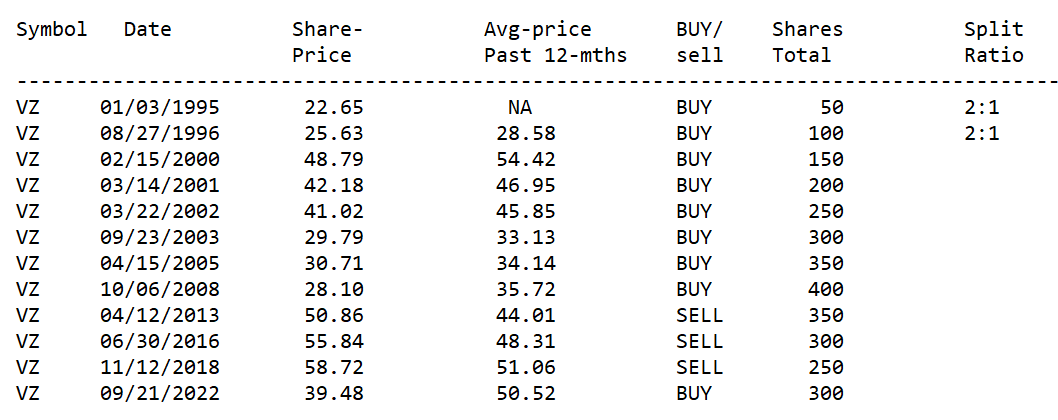
Table-2-O: WMT
Performance:
Below is the performance of the portfolio (with 15 securities), assuming all dividends were reinvested in the respective original securities. Please note that this portfolio outperformed the S&P 500 during every time period, but outperformance is outstanding when you compare the long-term performance (27-year period). Sure, we admit that in real life, an investor could have picked a few more losing stocks than our example portfolio, but the overall impact would not have been very significant.
Table - 3
| Period |
| Buy Low, Sell High [BLSH] Model |
| S&P 500 |
| Since 1995, Annualized Return (returns were calculated as investments were made) until Dec.16, 2022 |
| 15.03% |
| 9.97% |
| YTD Return (as of Dec. 16, 2022) |
| -6.84% |
| -17.88% |
| 10-Year Annualized Return |
| 13.96% |
| 12.53% |
| 5-Year Annualized Return |
| 10.14% |
| 9.43% |
| 3-Year Annualized Return |
| 10.32% |
| 8.06% |
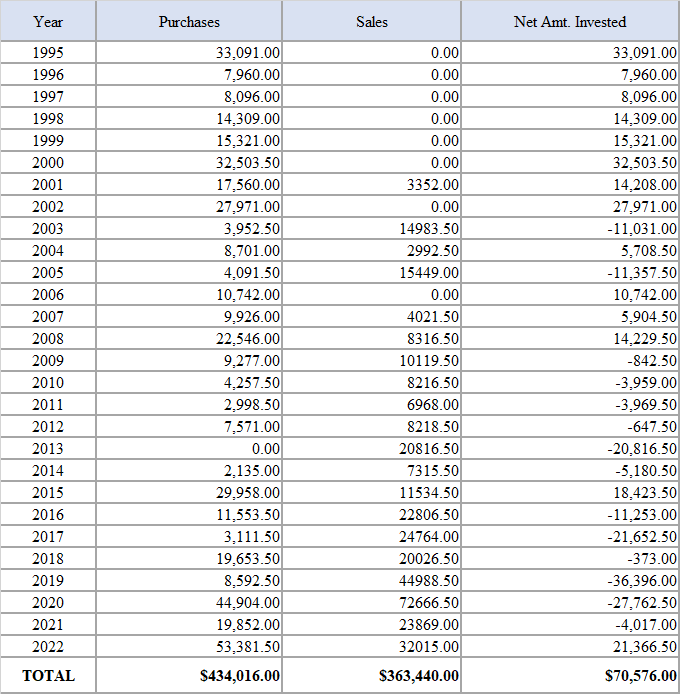
Amounts invested over the years in the 15-stock portfolio:
Table-3B:
In this model, with the automated strategy, we have invested roughly $434,000 over the years but have sold stocks worth $363,000 as well. This works out to a net investment capital of roughly $71,000, invested gradually in 15 stocks over the years. However, the first 5-8 years saw larger capital inflows (investments) due to the fact that the strategy does not sell until a threshold is reached. The model portfolio grew into a large sum of nearly $3.1 million over 27 years, providing a CAGR of roughly 15.03%, compared to 9.97% of the S&P 500. This is in spite of the market correction that is still ongoing in 2022.
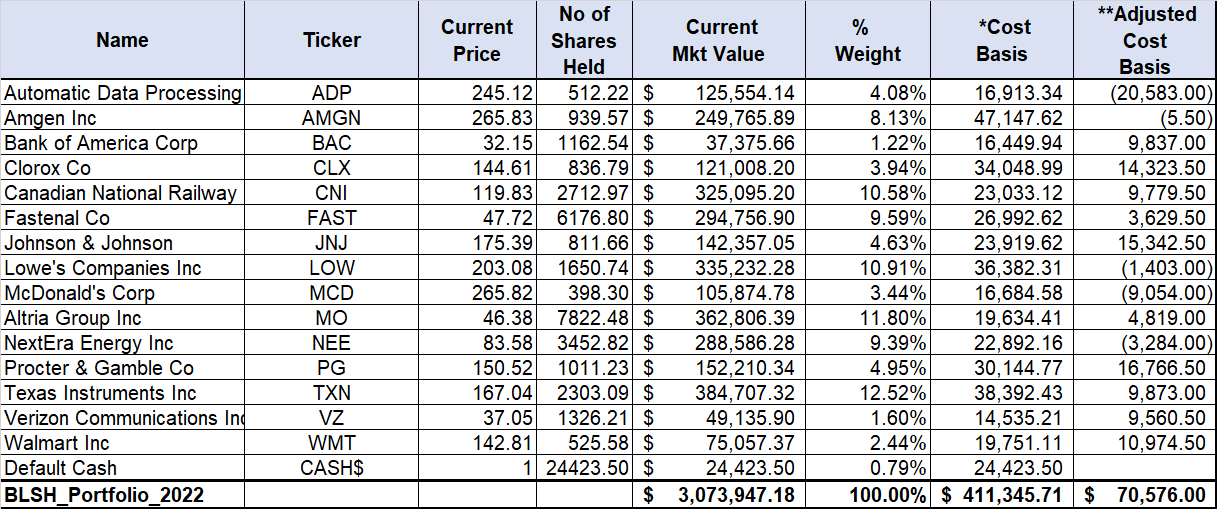
Here's the portfolio, as shown with recent current prices. As shown in the table below, some stocks have given outsized returns, some mediocre, and a few have performed below expectations.
Table-3C: Portfolio Value
*Cost-basis = This cost basis is calculated by taking into account the actual money spent to buy the shares. This does not include calculations for reinvested dividends or distributions.
**Adjusted Cost basis = This is the same as the cost basis (above), except that any profit/loss by selling a partial lot of shares is subtracted/added from/to the cost basis.
Concluding Thoughts
This portfolio is based on a predetermined, systematic approach. The portfolio does not require the entire investment upfront; rather, it allows us to invest periodically at different times. The system is flexible, and we can decide how many positions we want in the portfolio or how much we want to be invested in each stock. We can see that even if we were to select a few stocks that may not do very well along the way, the overall results would still have been outstanding.
Over a period of 27 years, we had a total of 240 transactions (156 purchases and 84 sales), on an average of fewer than ten transactions a year.
Essentially this portfolio strategy uses the concept of dollar-cost averaging ("DCA"), but instead of buying at a regular interval irrespective of the price, it only buys when the price is relatively cheap and sells when the price is relatively high. We will like to emphasize that more work and research may be needed to gain confidence in the strategy. The idea is to provide a basic framework to do further research and due diligence to formulate a coherent investment strategy.
As stated earlier, the stock selection process (for back-testing purposes) cannot be 100% free from selection bias. We did select a few stocks like Bank of America, Altria, and Verizon that have not performed well in the recent past, just to see how much of a negative impact they would have. Even if you end up picking one-third of stocks that are mediocre (or underperformer), the strategy will still likely beat S&P 500. In order to make the strategy more reliable, it is important to pick large-cap, blue-chip dividend-paying companies that are known to do well during recessionary periods.
For further details see:
How To Build Wealth: Buy Low And Sell High Consistently