TBT - How Well Do U.S. Treasury Yields Forecast Inflation? An Update Through December 29 2023
2024-01-02 10:36:21 ET
Summary
- Looking back over the history of the U.S. Treasury curve, what premium has been earned by investors who buy fixed-rate Treasury bonds instead of rolling over 6-month Treasury bills?
- The surprising answer is that this premium has never been negative for any trade date for maturities of 10 years and over.
- Looking at “in progress” premiums for holding periods not yet completed, the answer is that “in progress” term premiums through December 29, 2023, are positive on average for maturities of 10 years and longer, but negative on average for maturities of 7 years and under.
- This is a statement of historical fact, not a forecast of future returns.
With inflation at or near the highest levels in roughly four decades, any rational investor should be asking "How well do U.S. Treasury yields forecast inflation?" Why? If Treasury yields are poor indicators of future inflation, then no one should buy bonds. On the other hand, if Treasury yields are reasonably accurate in predicting actual inflation, there is no reason not to buy bonds as part of a balanced equity and fixed-income portfolio.
A related question is one often addressed by economists: how big is the "term premium" in the U.S. Treasury bond market? There are many forward-looking articles on that topic. It is surprising that there are very few reviews of the historical results comparing rolling over short-term investments versus buying a fixed-rate bond. That calculation answers both the inflation question and the term premium question. If U.S. Treasury yields inaccurately reflect future inflation, then there should be many historical periods where the realized results from rolling over short-term Treasury bills exceed the return that an investor holding the matched-maturity long-term bonds would have received.
In this note, we update our semi-annual analysis of realized and "in progress" term premiums in the U.S. Treasury market through December 29, 2023. On every single trading day since 1982, we compare the actual results from rolling over 6-month Treasury bills compared to buying Treasury bonds with maturities of 1, 2, 3, 5, 7, 10, 20, and 30 years. Because interest rates were declining for much of this period but rising for most of the period since February 2, 2022, we also report results for investments that are "in progress" and whose final outcome is still uncertain.
The magnitude of a "term premium" or risk premium in long-term U.S. Treasury yields is a major focus of research by both academics and economists in the Federal Reserve System. A recent paper by Canlin Li, Andrew Meldrum, and Marius Rodriguez summarizes two important papers on this topic and reviews their methodologies. Adrian, Crump, Mills and Moench (2014) summarize their term premium findings as follows:
"The evolution of term premia has been of particular interest since the Federal Reserve began large-scale asset purchases. Over this time, short-term interest rates have been close to zero, and our estimates show that the term premium has been compressed and has at times even been negative."
Estimates of the term premium are a function of the data used, the modeling approach taken, and market expectations.
The focus of this note is a simple one: the calculation of historically realized term premiums and "in progress" term premiums. From the perspective of prudential regulation of financial institutions, Ramaswamy and Turner [2018] argue that interest rate risk may well be the trigger for the next financial crisis, and the demise of Silicon Valley Bank on March 10, 2023, other U.S. banks confirms the accuracy of that forecast. The magnitude of the term premium, both current and future, is an important element in assessing the interest rate risk of financial institutions.
A historical perspective on actually realized term premiums is also a potentially important contributor to market expectations, subject to the caveat stated by Robert A. Jarrow, "History is just one draw from a Monte Carlo simulation." [1]
We seek to answer this question: "Which investment has provided the best total dollar return to investors, a U.S. Treasury bond maturing in X years or a money market fund that invests only in Treasury bills?" We address the answer to that question with respect to U.S. Treasury fixed-rate bonds with maturities of 1, 2, 3, 5, 7, 10, 20 and 30 years. We remind readers that what follows is an analysis of history, not a forecast for the future.
Methodology
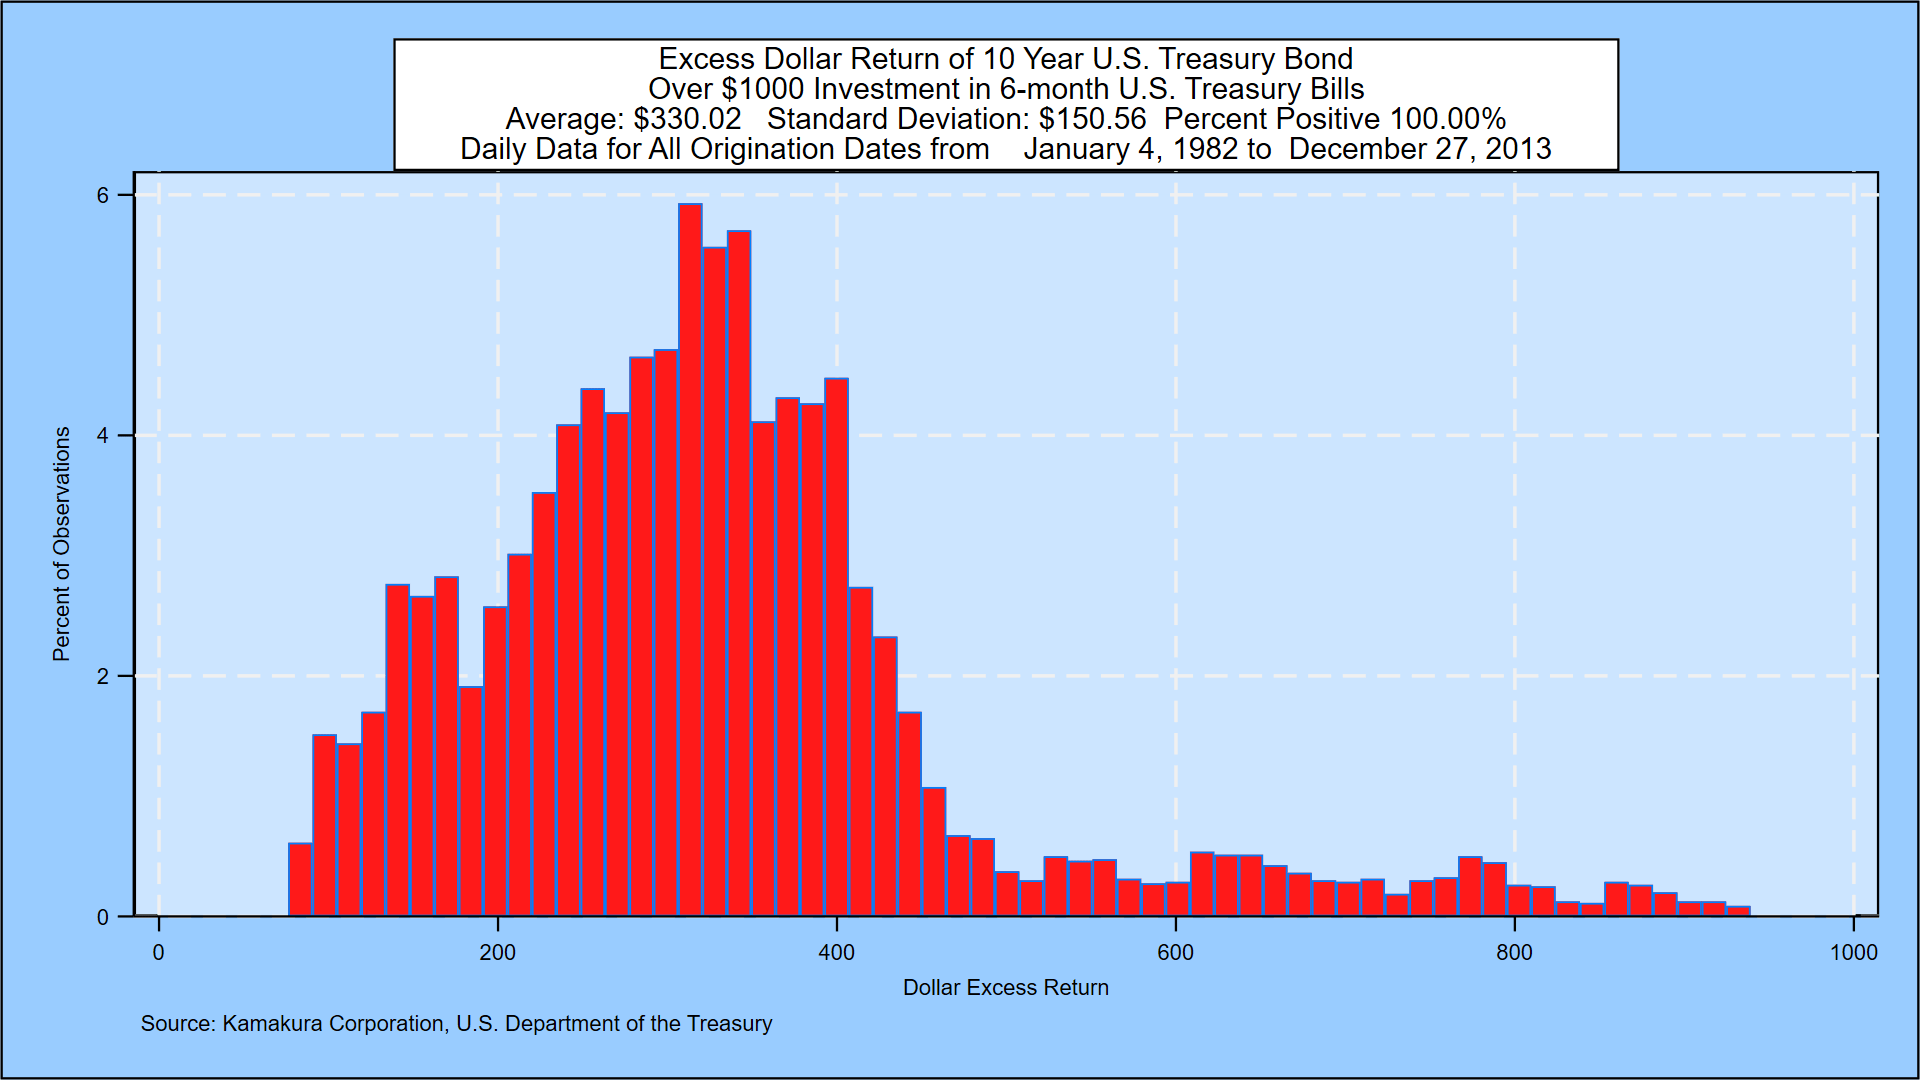
We use the time series of U.S. Treasury yields maintained by the U.S. Department of the Treasury and distributed by the Board of Governors of the Federal Reserve . [2] We assume that on each day for which data is available, an investor invests $1000 in the U.S. Treasury bond and $1000 in 6-month Treasury bills. Every six months, the investor will receive a coupon on the bond. We assume that cash from the coupon payment is invested in 6-month Treasury bills and that this investment is rolled over in new 6-month Treasury bills until the underlying bond matures. [3] The investment in the "money fund" starts with an investment in 6-month Treasury bills and all cash thrown off is reinvested in new 6-month Treasury bills until the underlying investment in the fixed-rate bond matures. Interest on the six-month bills is calculated on an actual/365-day basis because the U.S. Treasury data series for short-term rates is on an "investment" basis.
The payment dates, 6-month bill rates, and the value of the "money fund" are given in a supplemental spreadsheet. The total dollar returns on 1, 2, 3, 5, 7, 10, 20, and 30-year Treasury bonds, both realized and "in progress," are given in a second spreadsheet. Both spreadsheets are available upon request from the author.
Summary Results
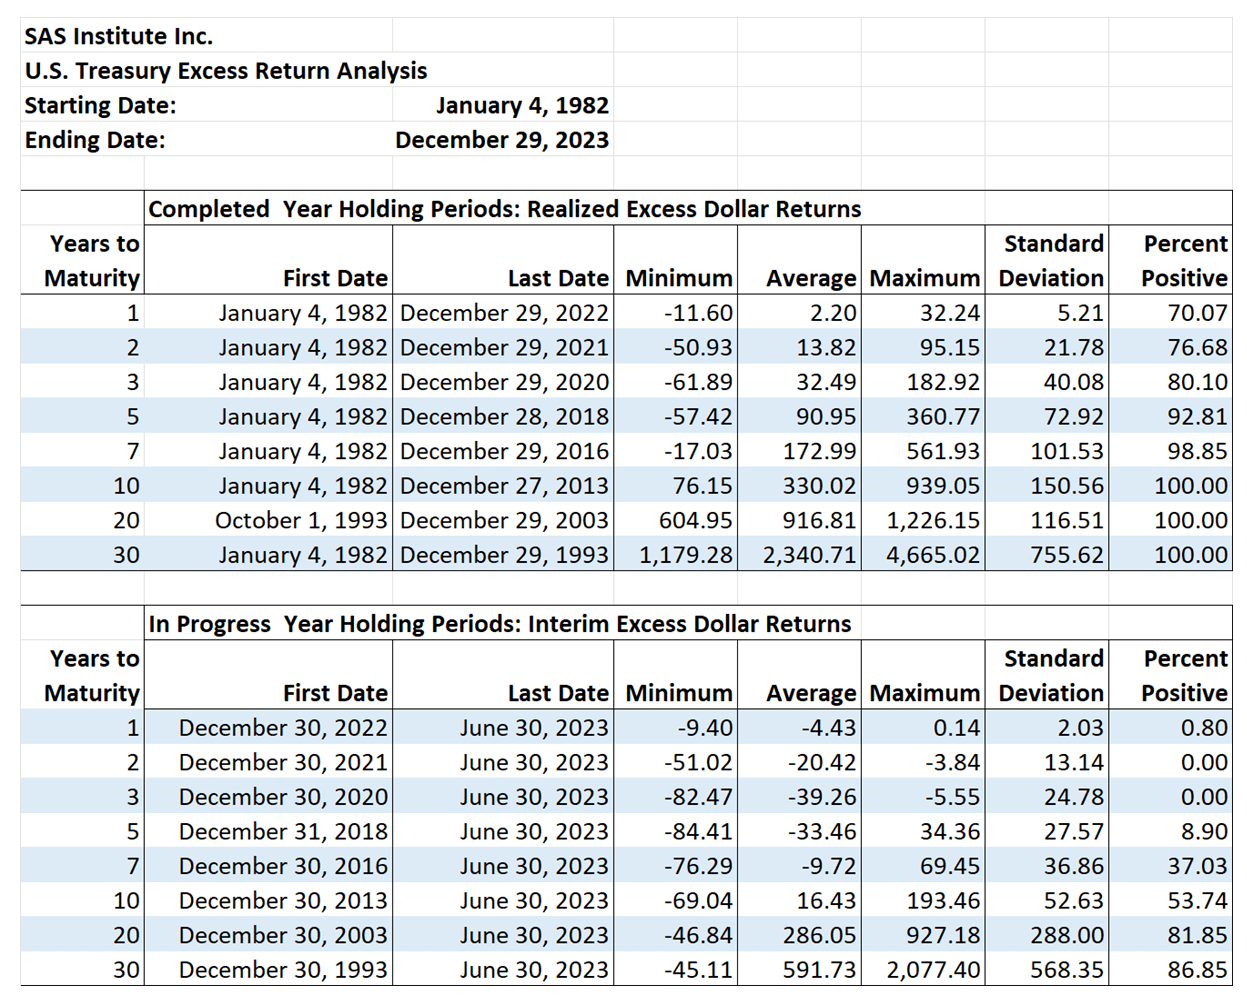
The results of the term premium analysis are summarized in the following table:
The results show that realized total dollar excess returns have never been negative for maturities of 10, 20, and 30 years. This conclusion is unchanged since the prior update through June 30, 2023. "Excess dollar return" is the ending dollar amount of the "bond strategy" less the ending dollar amount of the "T-bill strategy." For example, on average, investors buying a $1000 1-year fixed-rate bond earned $2.20 more than investors rolling over six-month Treasury bills. The maximum advantage was $32.24, and the worst outcome was a loss: $-11.60.
Pending "in progress" excess returns reflect the sharpness of the recent rate rise. At the shorter maturities, results are dramatically different from the "in progress" results of 18 months ago. For 1-year and 2-year horizons, 0.80% and 0.00% of realized dollar excess returns have been positive. At three years, the results are 80.10% (realized) and 0.00% (pending). At five years, the results are 92.81% (realized) and 8.90% (pending). Even at the 7-year maturity, a minority of pending excess returns are positive: 37.03%. The statistics for other maturities are shown in the chart.
Graphical Analysis Available Upon Request from the Author
Appendix A shows the evolution of total dollar return (in red) versus the 6-month T-bill money fund total dollar return (in blue) for completed 1, 2, 3, 5, 7, 10, 20 and 30-year terms beginning January 4, 1982. For most holding periods, interest rates have declined substantially over the investment periods that have been completed. The graphs in Appendix A also include the evolution of the initial six-month Treasury bill yields (in light blue) and the relevant fixed-rate Treasury bond yields (in pink) on the origination dates.
Appendix B shows the histogram of realized dollar excess returns for each of the 8 fixed-rate maturities. Appendix C reports on the histograms of "in progress" pending dollar excess returns for each maturity. For these incomplete periods, we define the "pending excess return" as the known dollar advantage of the fixed-rate Treasury bond over the 6-month T-bill investment as of the observation date. For example, on August 26, 2022, the amount of interest that will be paid on a 6-month Treasury bill equivalent that matures in 6 months (not necessarily 182 days) on February 26, 2023, is known with certainty. We tally all of the pending dollar term premiums, all of which have a differing time to maturity, in the histograms in Appendix C.
One of the reasons for the positive long-term premium results is the large size of the "interest on interest" earned on the fixed coupon payments, which are assumed to be invested in 6-month Treasury bills. The highest total realized dollar returns for all of the completed fixed-rate periods are shown in Appendix D. The lowest total realized dollar returns for each of the fixed-rate holding periods are shown in Appendix E.
Conclusions
The total dollar returns for the 10, 20 and 30-year Treasury bonds have exceeded the total dollar returns for the 6-month T-bill money fund on every completed holding period for which data is available. This is due in part to "interest on interest" earned on coupon payments rises when rates rise over the holding period, and, at least so far, this has been enough to generate strictly positive excess returns for 30-year bonds. The recent spike in short-term interest rates, however, shows that the risk of "going long" is not zero, especially for maturities of 5 years and under. The next update of this analysis will be filled with more drama.
With respect to the historical ability of Treasury yields to anticipate inflation, we conclude that the market's forecast of future inflation has generally been quite accurate for very long-term holding periods.
With respect to the historical excess returns versus the T-bill strategy, the rewards for buying long-term bonds have always been positive for maturities of 10 years and over. For shorter maturities, the average premium is positive at all maturities for completed holding periods. For holding periods in process, the average excess return is negative for maturities of seven years and under and positive for maturities of ten years and longer.
It goes without saying that there is no guarantee that the future will be like the past. At the same time, expectations for the future should be set with the past in mind.
The Appendices are available in a supplemental PDF file upon request to the author.
References
Adrian, T., R. K. Crump, B. Mills and E. Moench (2014), 'Treasury Term Premia: 1961-Present', Liberty Street Economics , available here .
Adrian, T., R. K. Crump and E. Moench (2013), 'Pricing the Term Structure with Linear Regressions', Journal of Financial Economics 110(1), pp. 110-138.
Li, Canlin, Andrew Meldrum, and Marius Rodriguez (2017). "Robustness of long-maturity term premium estimates," FEDS Notes. Washington: Board of Governors of the Federal Reserve System, April 3, 2017, available here .
Heath, David, Robert A. Jarrow and Andrew Morton (1992)," Bond Pricing and the Term Structure of Interest Rates: A New Methodology for Contingent Claim Valuation," Econometrica , 60(1), pp. 77-105.
Kim, D. H. and J. H. Wright (2005), 'An Arbitrage-Free Three-Factor Term Structure Model and the Recent Behavior of Long-Term Yields and Distant-Horizon Forward Rates', Federal Reserve Board Finance and Economics Discussion Series 2005-33.
Ramaswamy, Srichander and Philip Turner, "A dangerous unknown: interest rate risk in the financial system," Central Banking , February 7, 2018 .
Footnotes
[1] Conversation with the author, 2015.
[2] This is a different data series than was used by the papers reviewed by Li, Meldrum, and Rodriguez. The selection of the U.S. Department of the Treasury series was intentional, because of interest rate smoothing quality advantages that we discuss in a separate note.
[3] The "use of proceeds" of cash thrown off from coupon payments was chosen for two important reasons. First, the typical academic assumption that cash generated is reinvested in the same security is an investment strategy that is difficult, if not impossible, to execute in the U.S. Treasury market due to a lack of liquidity in "off the run" issues. Second, such an approach preserves the valuation of the Treasury bond when using the risk-neutral discounting methodology of Heath, Jarrow and Morton [1992].
For further details see:
How Well Do U.S. Treasury Yields Forecast Inflation? An Update Through December 29, 2023