VRP - HPI: Long-Term Amortizing NAV And Distributions Suggest Caution Warranted
Summary
- The HPI fund provides exposure to preferred stocks and corporate bonds.
- The fund pays an attractive 8.5% distribution yield.
- However, looking at HPI's long-term performance, I am concerned with its long-term declining NAV and distributions.
- A simple passive ETF like VRP outperforms HPI on most metrics.
The John Hancock Preferred Income Fund ( HPI ) is a closed-end fund that aims to provide high current income and capital preservation through a portfolio of preferred stocks and corporate bonds. Although HPI's 8.5% distribution yield looks attractive, HPI shows characteristics of being an amortizing 'return of principal' fund where long-term investors suffer declines in both principal and income.
Fund Overview
The John Hancock Preferred Income Fund is a closed-end fund ("CEF") focused on high current income and capital preservation. The fund primarily invests in a portfolio of preferred stocks and convertible securities.
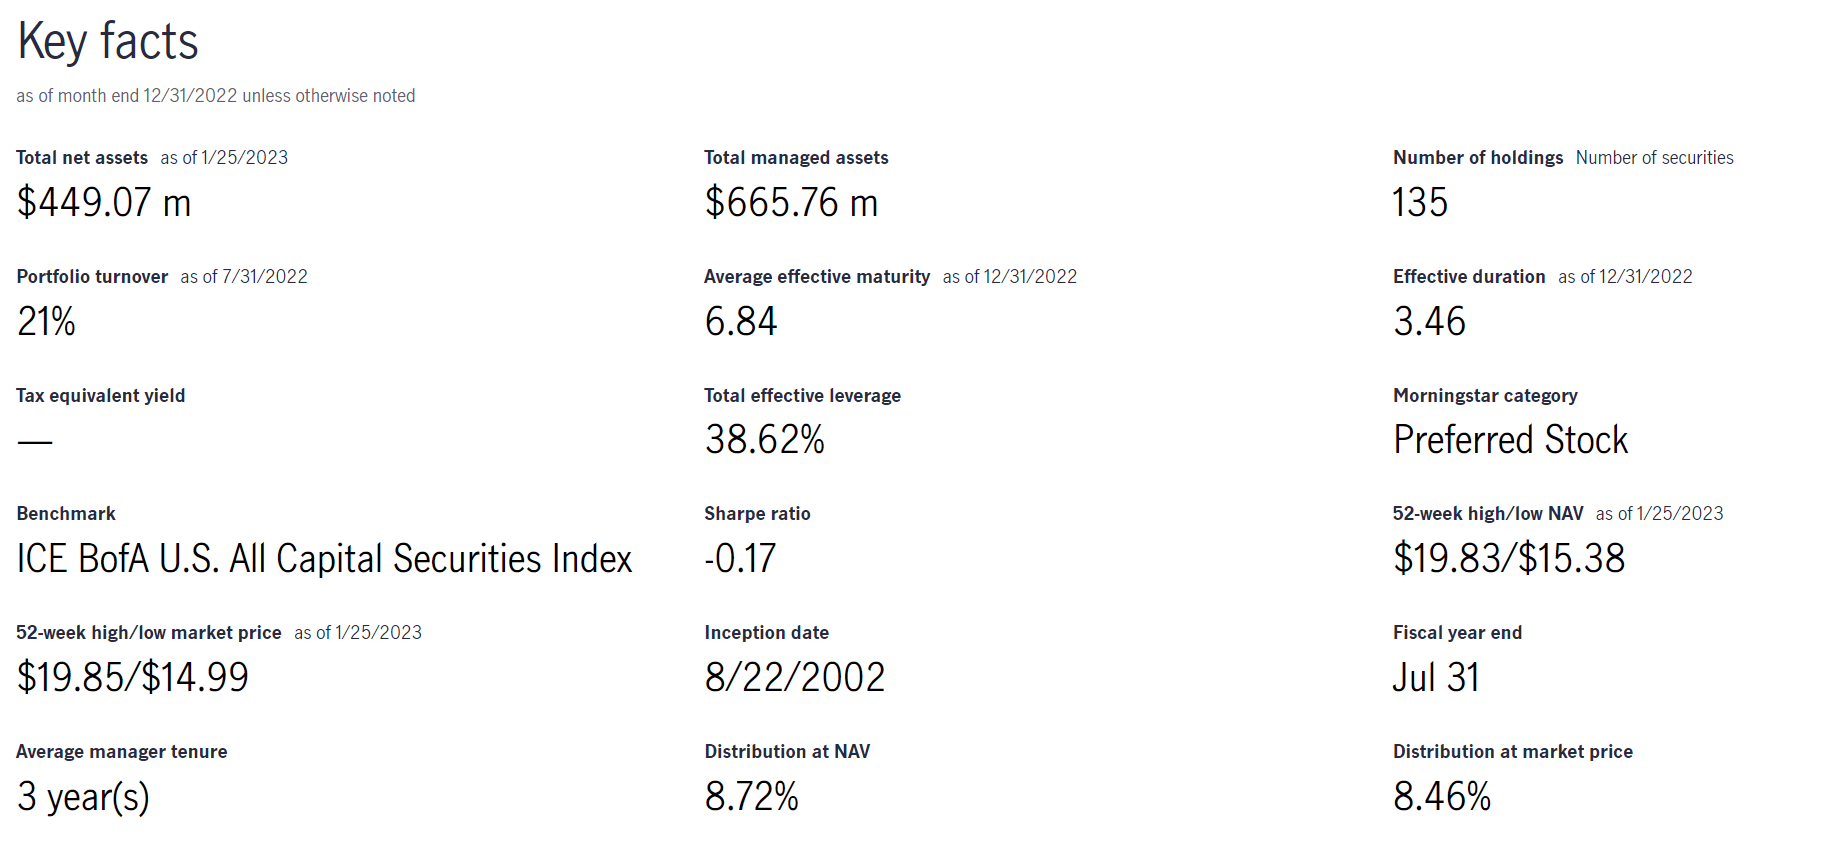
The HPI fund has $449 million in net assets with 38.6% effective leverage (Figure 1). The fund charged a 1.81% expense ratio after accounting for a reduction in certain expenses.
Overview Of Preferred Equity
Within a company's capital structure, preferred equity sits between bonds and common equity (Figure 2). In the event of a corporate bankruptcy, preferred equity has a higher claim on the company's assets than common equity, but is subordinated to debtholders.
Figure 2 - Preferred equity ranks between bonds and equity in capital structure (royalbank.com)
The main difference between preferred equity and common equity is that preferred equity usually has no voting rights when it comes to corporate matters. Also, preferred equity has limited appreciation upside, as they typically have call provisions which allow the company to redeem them at a certain price. Finally, preferred equity typically pays dividends (either fixed or floating rate) that have priority compared to common stock dividends (i.e., preferred dividends must be paid before common dividends).
Compared to bonds, preferred equity dividends usually have a higher yield than bonds to compensate for their lower priority claim in the capital structure. Also, unlike bond interest payments, preferred dividends can be skipped by the company without causing a technical default, although this is highly frowned up.
Portfolio Holdings
The HPI fund has 135 positions with an effective duration of 3.5 years. As of December 30, 2022, 54% of the fund was invested in preferred stocks, and 42% was invested in corporate bonds (Figure 3). Interestingly, the HPI fund's allocation to corporate bonds has increased from virtually nil in 2016 to its current 42% allocation while preferred stocks have declined from 96% to its current 54% weight (Figure 3).
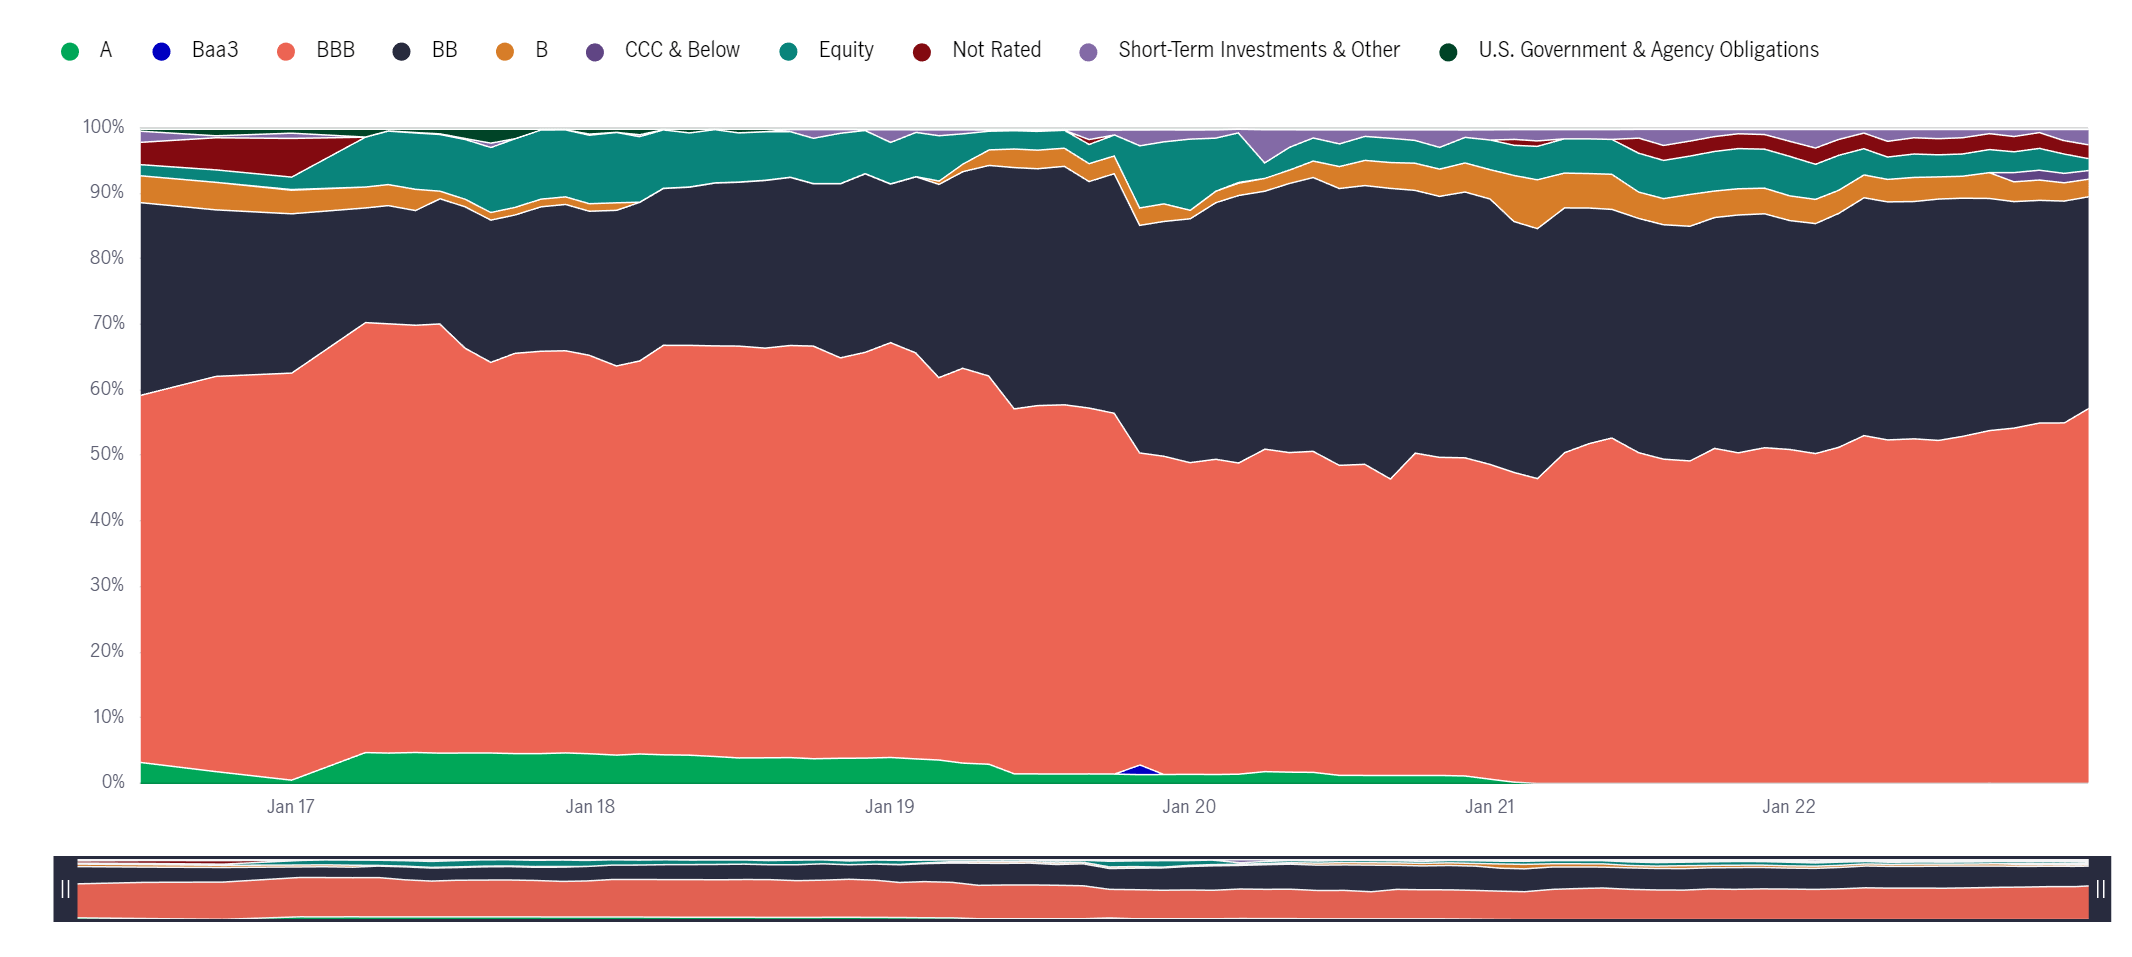
Figure 4 shows the HPI fund's latest credit quality allocation. 57% of the fund's assets is investment grade or better (BBB or higher) while 38% is non-investment grade or unrated.
Figure 4 - HPI credit quality allocation (jhinvestments.com)
Returns
Figure 5 shows HPI's historical returns. The HPI fund has poor short-term returns, driven by a -17.4% return in 2022. Long-term returns have been modest, with 5/10/15Yr average annual NAV total returns of 1.4%/4.6%/6.8% respectively to December 31, 2022.
On an annual basis, HPI's returns in the past decade have been volatile, ranging from -17.4% in 2022 to 27.3% in 2019 (Figure 6).
Figure 6 - HPI annual returns have been volatile (morningstar.com)
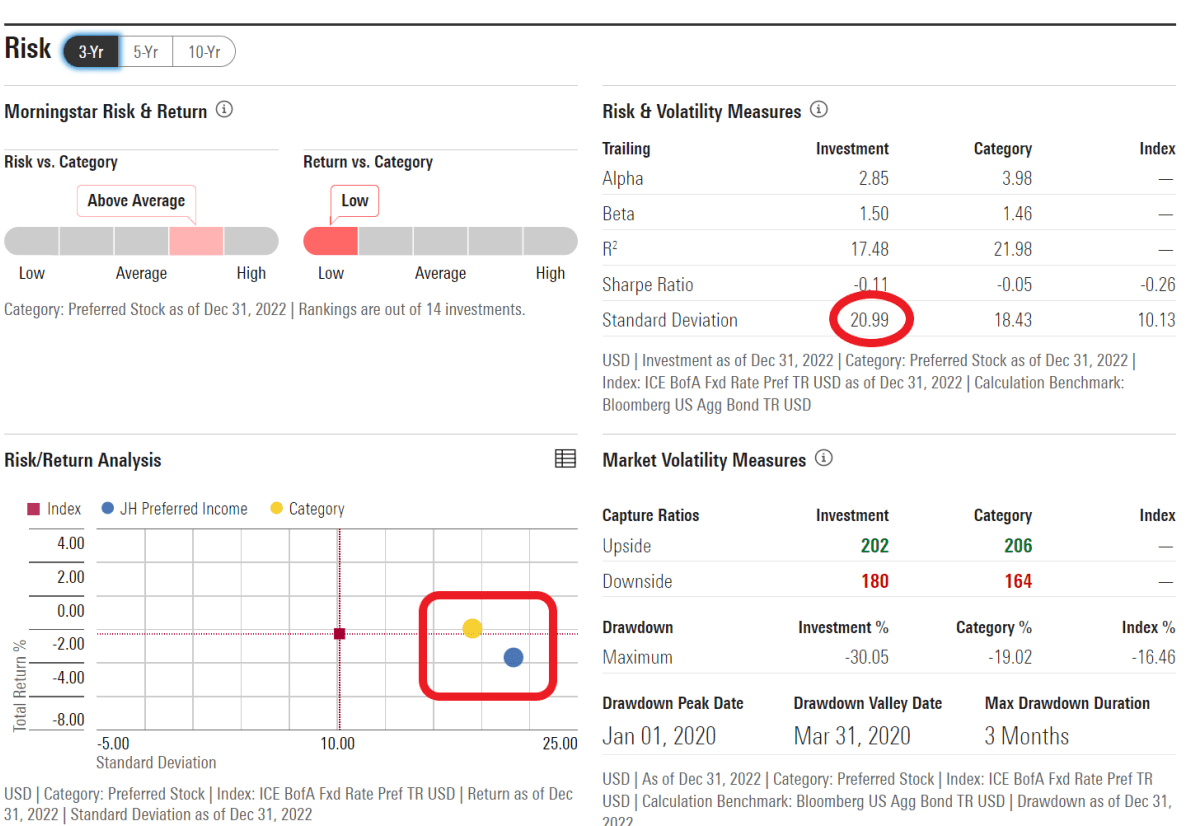
In fact, the HPI fund has a 3Yr volatility of 21.0%, comparable to an equity fund like the SPDR S&P 500 ETF Trust ( SPY ) which has a 3Yr volatility of 21.1% . The HPI's elevated volatility and modest returns are probably the main reason why Morningstar gives the fund only 1 star . HPI has higher volatility and lower average returns compared to the Preferred Stock category (Figure 7).
Distribution & Yield
The HPI fund pays a monthly distribution of $0.1235 that equates to a forward yield of 8.5%.
Investors should note that HPI's distribution has been higher than its net investment income ("NII") in the past 5 fiscal years. The difference has been funded by return of capital ("ROC") (Figure 8).
Figure 8 - HPI has been partially funding distribution through ROC (HPI 2022 annual report)
Is HPI Yet Another Return Of Principal Fund?
Given HPI's high distribution rate (8.5% current yield) but mediocre total returns (10Yr average annual returns of 4.6%), I am concerned that it is yet another amortizing 'return of principal' fund that I have been writing about recently.
'Return of principal' is an economic concept that I picked up from an Eaton Vance whitepaper titled 'Return of Capital Demystified'. Unfortunately, the paper appears to be no longer available. I also recently pointed out that the Eaton Vance Short Duration Diversified Income Fund ( EVG ) exhibited 'return of principal' characteristics:
The best measure of whether a fund has earned its distributions is the change in its NAV net of distributions. Regardless of how distributions are characterized, if a fund's NAV increases, the fund earned its distribution. If not, the fund did not earn its distribution - the economic concept of return of principal
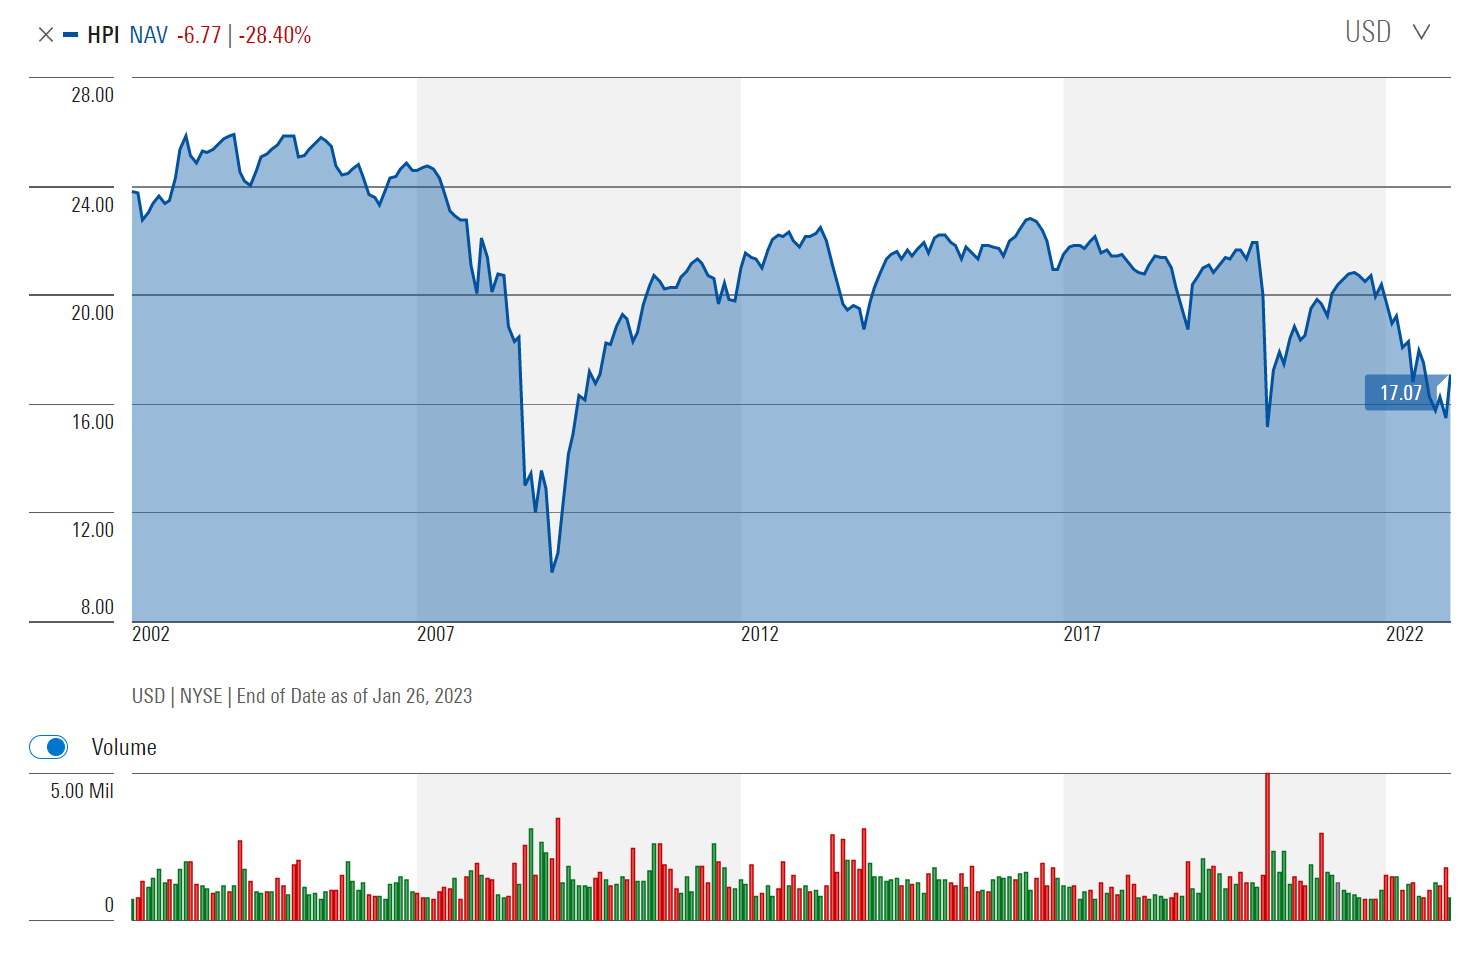
The amortizing 'return of principal' concept can be shown visually by looking at HPI's NAV and distributions over time. Since the mid-2000s, HPI's NAV has declined from a peak of $25.92 in March 2004 to $17.07 currently (Figure 9).
Figure 9 - HPI has a long-term declining NAV (morningstar.com)
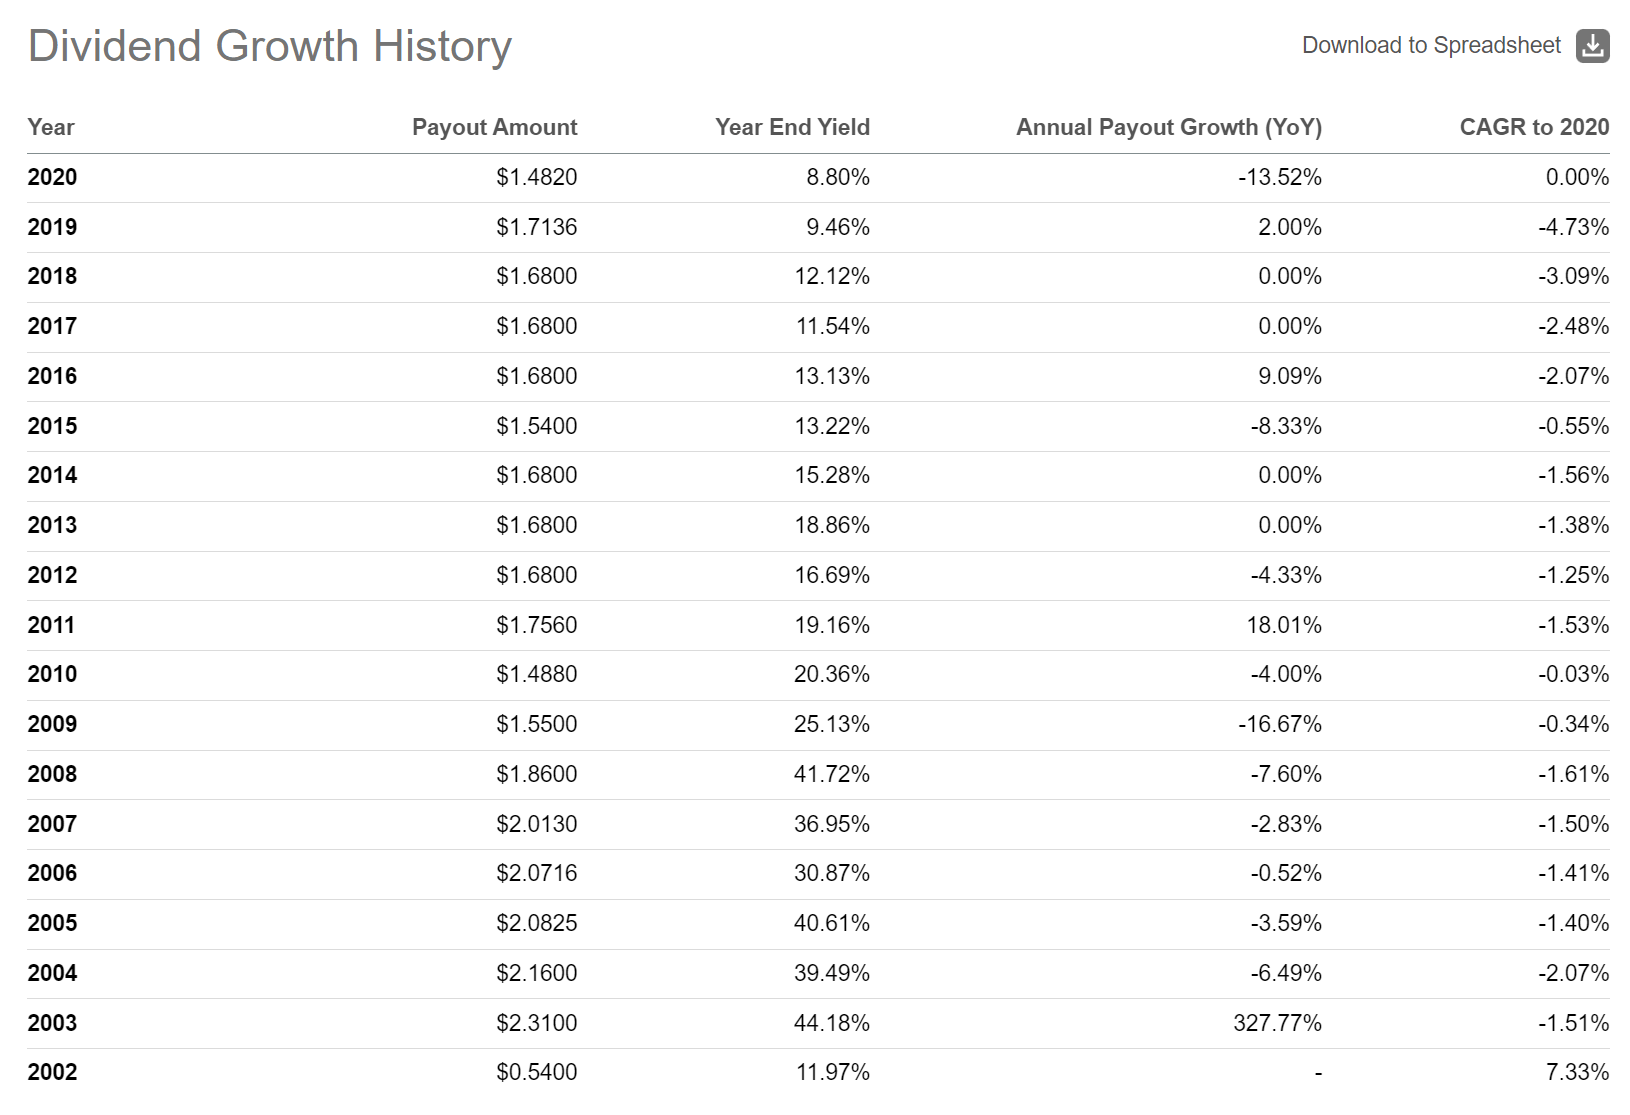
Likewise, the HPI fund's annual distribution has shrunk from a peak of $2.31 in 2003 to $1.482 currently (Figure 10).
Long-term investors in HPI have suffered a decline in both principal and income.
HPI Vs. VRP
I recently wrote an overview article on the Invesco Variable Rate Preferred ETF ( VRP ). How does the actively managed HPI fund compare against the VRP ETF that tracks a passive index of preferred equities and convertible securities?
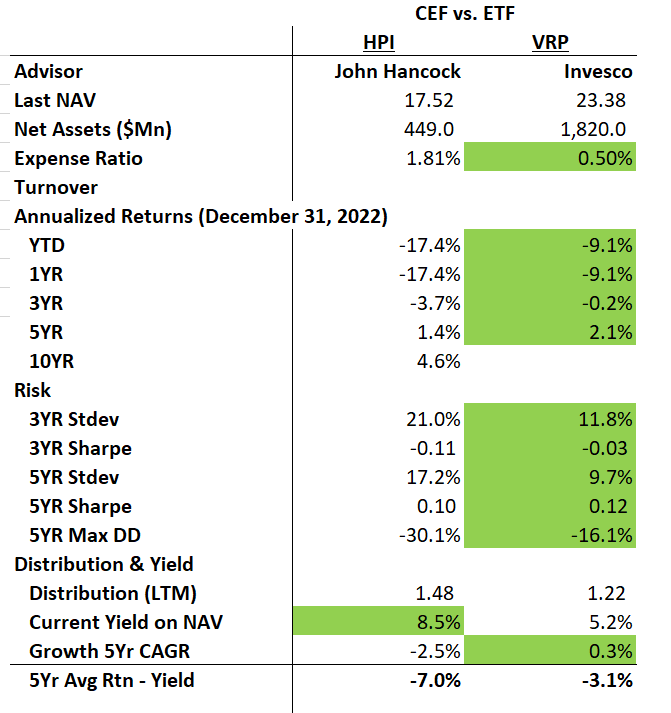
Figure 11 shows a comparison between the HPI fund and the VRP ETF using a proprietary scorecard I developed. First, the VRP is a much cheaper way to access preferred equities, with a 0.50% expense ratio vs. HPI's 1.81%.
Figure 11 - HPI vs. VRP (Author created with returns and risk metrics from Morningstar and fund details and distribution from Seeking Alpha)
Next, we can see that the VRP has outperformed the HPI fund in all comparable timeframes.
The VRP ETF also has much lower volatility compared to the HPI fund, giving it superior Sharpe Ratios. VRP's max drawdown in the past 5 years is almost half of HPI's. In fact, comparing VRP's risk metrics to HPI's, we can see the VRP ETF has higher returns and lower volatility than the Preferred Stock category on Morningstar (Figure 12). This is in stark contrast to HPI's risk metrics in figure 7 above.
The only category where HPI is better than VRP is the current distribution yield, where HPI is paying an 8.5% yield vs. VRP's 5.2%. However, as we have established earlier in the article, HPI's distribution may not be sustainable as it has been on a long-term declining trend and is far above the fund's average annual total returns.
Overall, for investors seeking preferred equity exposure, I believe a passive ETF like the VRP is a superior choice.
Conclusion
The John Hancock Preferred Income Fund aims to provide high current income and capital preservation through a portfolio of preferred stocks and corporate bonds. Although the HPI fund pays an attractive distribution yield of 8.5%, I believe this distribution may not be sustainable in the long-run as the HPI fund has all the hallmarks of an amortizing 'return of principal' fund, namely long-term declining NAV and distributions.
Furthermore, compared to a passive ETF like the Invesco Variable Rate Preferred ETF, the HPI fund trails on almost all metrics. Investors seeking preferred equity exposure may want to consider the VRP ETF instead of the HPI fund.
For further details see:
HPI: Long-Term Amortizing NAV And Distributions Suggest Caution Warranted