SOJE - HTD: Income And Growth Potential
2023-06-28 14:30:34 ET
Summary
- Investors today are in desperate need of income as inflation has not been dropping nearly as fast as the headlines are leading us to believe.
- John Hancock Tax-Advantaged Dividend Income Fund invests primarily in utilities and other high-yielding common stocks that should prove very resistant to economic trouble.
- The HTD closed-end fund typically outperforms its benchmarks during bull markets but underperforms during bear markets.
- The current 8.29% yield appears reasonably sustainable, and the fund's assets are up over the trailing two-year period.
- The fund is currently trading at an attractive discount to the net asset value.
There can be little doubt that one of the biggest problems facing the average American today is the incredibly high inflation rate that has been ravaging the nation. This high inflation rate can be seen quite clearly by looking at the consumer price index, which claims to measure the price of a basket of goods that is regularly purchased by the average American consumer. As we can see here, this index has posted much higher than the 2% year-over-year growth rate that is considered healthy during each of the past twelve months:
Trading Economics
We can see that the year-over-year growth rate has been slowing, which the media states is a sign that inflation is finally returning to a normal level. However, as I have noted before , much of this improvement is being caused by the simple fact that crude oil prices are lower than they were a year ago. The core consumer price index, which excludes volatile food and energy prices, has proven much more resistant and is currently much higher than it was at this time last year:
Federal Reserve Bank of St. Louis
This is why many people are skeptical about the official numbers since prices still continue to rise at a very high rate for pretty much any product except for energy. This environment of rapidly rising prices has strained the budgets of many households and even forced numerous people to take on second jobs or enter the gig economy just to increase their incomes by enough to pay their bills. I discussed this in various previous articles and blog posts over the past six months.
As investors, we are certainly not immune to this since we have bills to pay and require food for sustenance just like anyone else. We do have other methods to obtain the extra money that we need to handle the rising price environment that does not necessarily require taking a second job, however. After all, we have the ability to put our money to work for us to earn an income. One of the best ways to accomplish this is to purchase shares of a closed-end fund, or CEF, that specializes in the generation of income. These funds are admittedly not very well-followed in the investment media, nor are many investment advisors familiar with them. As such, it can be difficult to obtain the information that we would really like to have to make an investment decision. This is unfortunate because these funds provide a number of advantages over exchange-traded or open-ended funds, such as the ability to employ certain strategies that artificially boost their yields. As such, many of these funds are among the highest-yielding assets available in the market.
In this article, we will discuss the John Hancock Tax-Advantaged Dividend Income Fund (HTD), which yields an impressive 8.29% at the current share price. This is obviously more than sufficient to satisfy the income goals of just about any investor. I have discussed this fund before, but a few months have passed since that date, so obviously several things have changed. This article will focus specifically on these changes as well as provide an updated analysis of the fund's finances. Let us investigate and see if this fund could be a good way to boost your income to better handle the rapidly rising living costs.
About The Fund
According to the fund's webpage , the John Hancock Tax-Advantaged Dividend Income Fund has the stated advantage of providing its investors with a high level of after-tax total return. This is not particularly surprising considering that the name of this fund implies that it will invest primarily in dividend-paying common stocks. This is partly true as the fund's portfolio is 66.25% invested in common stock, but it also has a significant allocation to preferred stocks:
CEF Connect
The reason why the fund's emphasis on total return is not surprising is that common stocks are by their very nature a total return instrument. After all, investors typically purchase common stock for the dividends that these securities pay out, as well as for the potential for capital gains as the issuing company grows and prospers with the passage of time. This is the goal of this fund as well, as it specifically states that it is investing in securities with the goal of achieving a high level of total return in the form of both dividend income and capital appreciation.
One thing that I have noted in previous articles on dividend-focused closed-end funds is that many of them have very strange portfolios for earning high levels of dividend income. This is especially true for Eaton Vance's dividend-income funds, as many of them have very high allocations to the mega-cap technology companies and other bubble stocks that have virtually nothing to offer as far as dividends are concerned. This fund is a notable exception to this rule, however. The fund specifically states that at least 80% of its assets will be invested in securities that pay a dividend, and it states that it emphasizes investing in the high-yielding utility sector. This is indeed the case as 59.26% of the fund's assets are invested in utilities:
John Hancock Investment Management
This is actually quite a bit higher than the 56.13% utility sector weighting that we saw when we last looked at this fund, which could be a sign that the fund is actively trying to increase its allocation to the sector. That is not a bad idea in the current economic climate. As I have mentioned in various previous articles, one of the defining characteristics of utilities is that they enjoy remarkably stable cash flows through any economic environment. In recent months, we have seen numerous indicators point to a near-term recession, and even the usually optimistic economists at the Federal Reserve are unanimously predicting a recession by the end of the year. Consumers typically cut back on their spending during a recession, which will negatively impact consumer discretionary companies much more than it will a utility. After all, most people will prioritize paying their electric and natural gas bills when money gets tight. As such, utilities are an ideal holding for such an environment. The fund's management may realize that and is positioning the fund to weather a near-term recession.
As regular readers are no doubt well aware, I have devoted a considerable amount of time and effort over the past few years to discussing various utility companies here at Seeking Alpha. As such, the largest positions in the fund will probably be familiar to most investors. Here they are:
John Hancock Investment Management
I have discussed all of these companies except for The Southern Company ( SO ) and Duke Energy ( DUK ) numerous times in the past. Those two companies are very well covered by the media so it should not be too difficult to get information about them even without my contributions. For the most part, these are all fairly large and well-capitalized electric and natural gas utilities that pay sustainable dividends and should be able to weather any near-term economic problems just fine.
The only exceptions are The Williams Companies ( WMB ) and BP ( BP ), which are both in the energy sector. The Williams Companies is one of the largest natural gas pipeline operators in the country, which is a very stable business and the company's revenues are backed by very long-term contracts. The Williams Companies also has strong forward growth prospects as the demand for natural gas along the East Coast is rising and the company's enormous Transco pipeline system is being expanded to service this demand. BP is a supermajor energy company with very strong finances that should allow it to handle any economic trouble, although it is more exposed to commodity price fluctuations than any other company on this list. As crude oil prices typically decline during recessions, this is something that should be considered.
There have been surprisingly few changes to the fund's portfolio over the past three months. The only notable change is that Entergy ( ETR ) was removed from the fund's largest positions and replaced with OGE Energy ( OGE ). There were numerous changes in the fund's weightings, however, but these may be explained away as simply one stock outperforming another in the market. The fact that there were so few changes over the trailing three-month period may lead someone to conclude that this fund has a relatively low turnover rate. This is certainly the case, as the fund had an annual turnover of 11.00% last year, which is one of the lowest levels for an equity closed-end fund that I have ever seen.
The reason why a low turnover is nice to see is that it costs money to trade stocks and other assets. These costs are billed directly to the fund's shareholders, which creates a drag on its performance and makes the job of the fund's managers more difficult. After all, the fund's management needs to earn sufficient returns to cover the additional expenses and still have enough left over to deliver the shareholders a competitive return with other assets. This is a task that very few management teams manage to accomplish on a consistent basis, which frequently results in actively-managed funds underperforming comparable index funds. This fund is something of an exception, as it normally outperforms its benchmark indices during periods of positive returns but underperforms during periods of negative returns:
John Hancock Investment Management
Overall, positive market years have been much more common than negative ones over the past decade. As a result, the fund has outperformed its benchmark indices more often than not. That speaks well for the fund's management, although arguably it is the fund's performance during weak market years that is most important. As we can clearly see, this fund typically declines much more than its benchmark indices during weak years, such as the past one-year period.
Leverage
In the introduction to this article, I stated that closed-end funds like the John Hancock Tax-Advantaged Dividend Income Fund have the ability to employ certain strategies that allow them to boost their yields well beyond that of any of the underlying assets. One of these strategies is the use of leverage. In short, the fund borrows money and then uses that borrowed money to purchase dividend-paying common and preferred stocks. As long as the interest rate that the fund pays on the borrowed money is less than the return that it receives on the purchased assets, the strategy works pretty well to boost the effective yield of the portfolio. As this fund is capable of borrowing at institutional rates, which are considerably lower than retail rates, that was the case over much of the past decade.
However, things are somewhat different now since the U.S. utility sector ( IDU ) only yields 2.57% and there is no way that the fund is going to be able to borrow at a lower rate considering that the federal funds rate is 5.00% today. Thus, the fund's use of leverage is not going to have the same positive impact today as it once did.
The use of debt in this fashion is a double-edged sword. This is because leverage boosts both gains and losses. This is almost certainly one very big reason why this fund has a history of underperforming its benchmark indices during weak market environments. As a result of this, we want to ensure that the fund is not using too much leverage since that would expose us to too much risk. I do not generally like to see a fund's leverage exceed a third as a percentage of its assets for that reason.
Unfortunately, this fund does not appear to be meeting that requirement as its levered assets currently comprise 35.95% of its portfolio. This is higher than we really want to see, particularly if the market corrects since this would lead to excessive losses. The S&P 500 Index (SP500) does look somewhat overvalued today, but this is partially due to the year-to-date performance of a handful of mega-cap technology stocks. A correction is still not out of the question though if the Federal Reserve's economists are correct about a near-term recession.
Distribution Analysis
As mentioned earlier in this article, the John Hancock Tax-Advantaged Dividend Income Fund has the stated objective of providing its investors with a high level of after-tax total return. In order to do that, it invests primarily in the high-yielding utility sector, although admittedly that sector's yields are not as impressive today as they were twenty or thirty years ago. The fact that the fund has a 28.86% weighting to preferred stocks boosts its overall yield though as these securities frequently have yields exceeding 7%. The fund applies a layer of leverage with the intent of boosting its effective yield further, but it is questionable how effective this is considering the current federal funds rate. Perhaps the most important factor when it comes to the effective yield received by the shareholders though is that this fund can pay out its capital gains as part of the distribution.
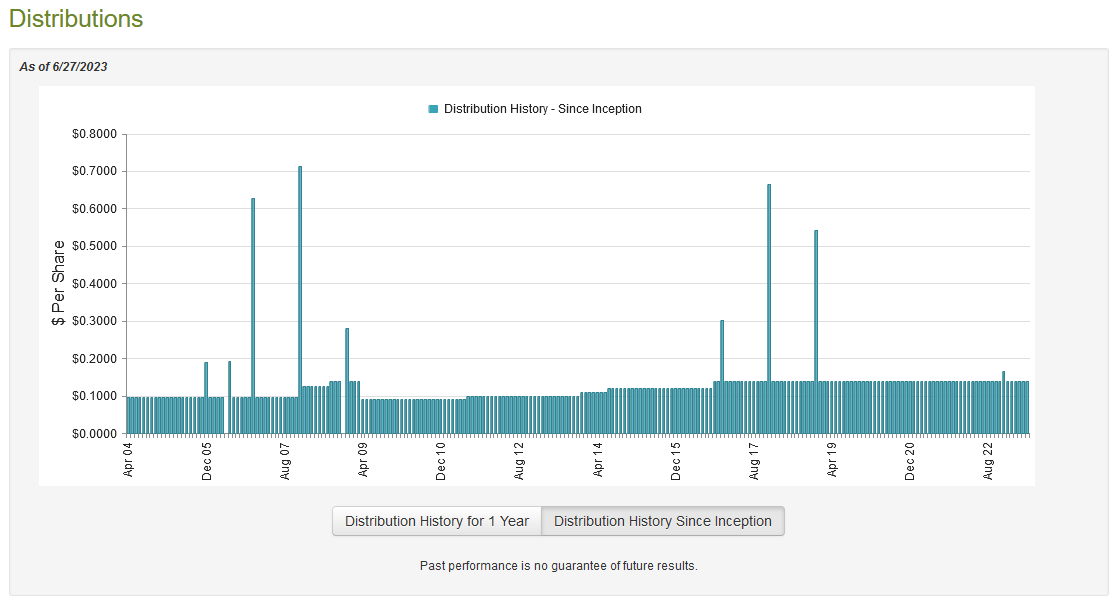
Overall, this allows the fund to pay out a very respectable yield to its shareholders. The John Hancock Tax-Advantaged Dividend Income Fund pays out a monthly distribution of $0.1380 per share ($1.656 per share annually), which gives it an 8.29% yield at the current share price. The fund has been remarkably consistent with its distribution over the years, as it has grown its payout since 2009:
This is something that will probably appeal to those investors that are seeking a safe and reliable source of income to use to pay their bills or finance their lifestyles. The fact that the fund has grown its distribution is in line with its emphasis on investing in utility stocks since most utilities increase their dividends on an annual basis. It is also something that is fairly nice to see in today's inflationary environment. This is because inflation is constantly reducing the number of goods and services that can be purchased with the distribution that the fund pays out. The fact that it increases its distribution regularly helps to offset this effect over time. With that said though, it is not an annual increase and the fund has not increased the payout since 2016 so it has not helped at all in the current environment.
As is always the case though, it is important that we ensure that the fund can actually afford the distribution that it pays out. After all, we do not want to be the victims of a distribution cut since that would reduce our incomes and almost certainly cause the fund's share price to decline.
Unfortunately, we do not have an especially recent document that we can consult for the purposes of our analysis. As of the time of writing, the fund's most recent financial report corresponds to the full-year period that ended on October 31, 2022. As such, it will not include any information about the fund's performance over the past eight months. This is rather disappointing since a lot has happened in that time, particularly the market turbulence that surrounded the series of bank failures this Spring and of course the debt ceiling fight last month. With that said though, the fund is mostly invested in utilities that were not financially affected by these events.
During the full-year period, the John Hancock Tax-Advantaged Dividend Income Fund received $44,294,880 in dividends and $12,846,932 in interest from the investments in its portfolio. The fund did have to pay some withholding taxes on the dividends, so we have to net those out for a total investment income of $56,867,232 over the full-year period. The fund paid its expenses out of this amount, which left it with $38,893,021 available for the shareholders. This was, unfortunately, not nearly enough to cover the $58,650,757 that the fund actually distributed to its shareholders during the period. At first glance, this is certain to be concerning as the fund is clearly not covering its distributions with net investment income.
With that said, the fund does have other means through which it can obtain the money that it needs to finance the distribution. For example, it might be able to earn some capital gains that can be distributed to its investors. The fund had mixed success at this task over the period as it reported net realized gains of $18,834,489 during the period, but these were offset by $84,300,241 net unrealized losses. Overall, the fund's assets declined by $84,899,570 after accounting for all inflows and outflows. This is quite concerning, particularly considering that the net investment income plus the net realized gains was not enough to cover the distributions that were paid out during the period. The fund did get very close though as net investment income plus net realized gains were $57,727,510, which is only $923,247 short of the needed amount.
Things do look better when we look at the fund's two-year performance, however. On November 1, 2020, the fund had total assets of $766,504,519. On October 31, 2023, the fund's assets were $804,062,083 when the market closed. Thus, the fund managed to earn enough over the two-year period to fully cover its distributions and still have some left over. Overall, the distribution is probably reasonably safe unless we experience a multi-year bear market over the next few years. That seems rather unlikely so there is probably no need to worry about a distribution cut here.
Valuation
It is always critical that we do not overpay for any asset in our portfolios. This is because overpaying for any asset is a surefire way to earn a suboptimal return on that asset. In the case of a closed-end fund like the John Hancock Tax-Advantaged Dividend Income Fund, the usual way to value it is by looking at the fund's net asset value. The net asset value of a fund is the total current market value of all the fund's assets minus any outstanding debt. It is therefore the amount that the shareholders would receive if the fund were immediately shut down and liquidated.
Ideally, we want to purchase shares of a fund when we can obtain them at a price that is less than the net asset value. This is because such a scenario implies that we are purchasing the fund's assets for less than they are actually worth. That is, fortunately, the case with this fund today. As of June 27, 2023 (the most recent date for which data is available as of the time of writing), the John Hancock Tax-Advantaged Dividend Income Fund has a net asset value of $21.07 per share but the shares currently trade for $19.94 each. This gives the fund's shares a 5.36% discount to the net asset value at the current price. This is quite a bit better than the 4.20% discount that the shares have had on average over the past month so the price certainly seems reasonable today.
Conclusion
In conclusion, investors are desperate for income today, as the rapidly rising cost of living has pushed up the prices of everything that we purchase and use in our everyday lives. The John Hancock Tax-Advantaged Dividend Income Fund appears to be a good way to solve this problem as its 8.29% yield appears to be sustainable and should provide an attractive amount of income for anyone's portfolio. The fact that, unlike most income funds, this one invests in the common stocks of companies that should be resistant to recessions or economic problems provides for rising income over the long-term compared to most fixed-income funds.
John Hancock Tax-Advantaged Dividend Income Fund's leverage is a risk, but it should be manageable. When we combine this with the current discount to the net asset value, there is no reason not to consider this fund for your portfolio today.
For further details see:
HTD: Income And Growth Potential