HTD - HTD: Portfolio Mix Helped This Fund Through 2022
Summary
- HTD is a strong consideration for longer-term investors, despite the fund trading at a very shallow discount.
- The fund has the most exposure to equity utilities, but energy exposure in this fund also helped it through 2022.
- Besides their equity exposure, HTD carries a significant exposure to preferred and corporate bonds, which were a drag on the fund for the last year.
Written by Nick Ackerman, co-produced by Stanford Chemist. This article was originally published to members of the CEF/ETF Income Laboratory on January 6th, 2023.
John Hancock Tax-Advantaged Dividend Income Fund ( HTD ) had a relatively successful 2022. On a total share price and total NAV return basis, declines were quite minimal. The overweight exposure to utilities helped this out. However, the fund also carried a sizeable allocation to energy, which was the only positive-performing sector of the market last year. Utilities join them when looking at total returns, with the assumption of dividends reinvested.
The fund carries a sizeable allocation to preferred and corporate bonds for fixed-income. These were the laggards in their portfolio, the portion that dragged the results down for the fund. That's despite fixed-income supposed to be the more stable portion of a portfolio. The increasing interest rates impacted this asset class negatively.
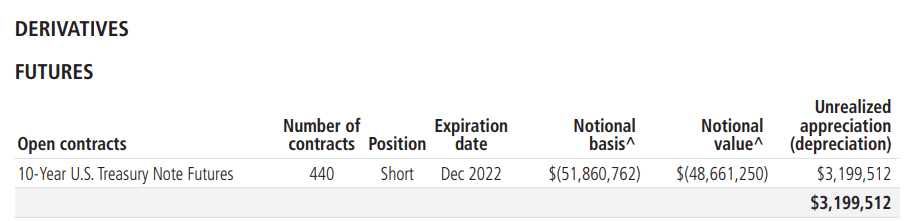
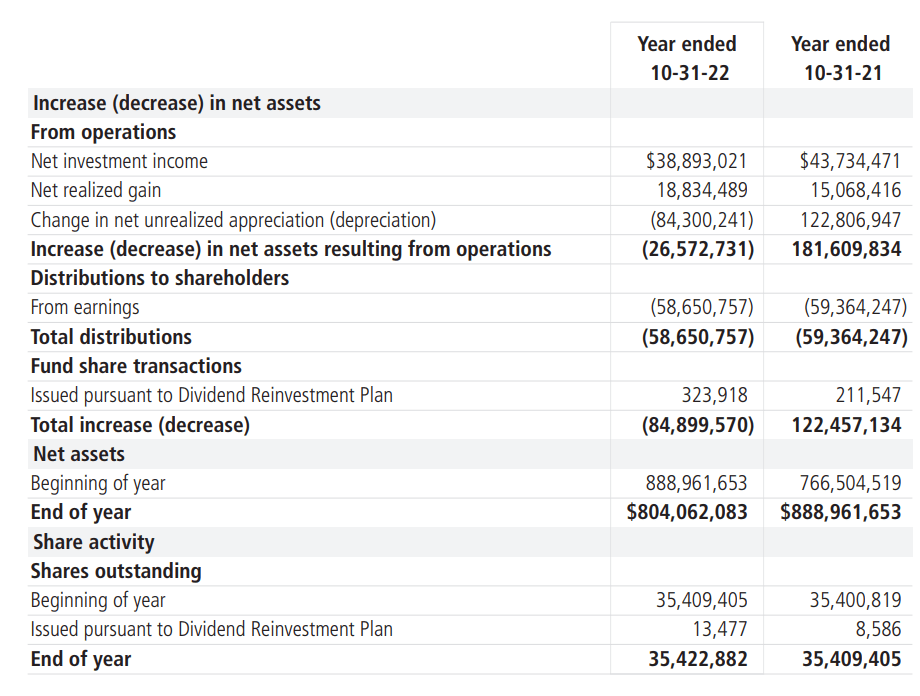
Since our last report, we also have their latest annual report . Net investment income declined year-over-year as interest expenses exploded higher. However, despite NII declines, they didn't take the full force of the interest rate hikes without being hedged. They went short 10-Year U.S. Treasury Note Futures to recoup the additional expenses by replacing them with capital gains, which worked well.
All that being said, this is mostly just an updated article on the latest fund data for those already holding. While I believe it is a strong consideration for a long-term investor, the fund is currently trading at an almost non-existent discount. This fund has historically traded at some deep discounts quite often.
The Basics
- 1-Year Z-score: 1.57
- Discount: 0.09%
- Distribution Yield: 7.13%
- Expense Ratio: 1.14%
- Leverage: 32.80%
- Managed Assets: $1.28 billion
- Structure: Perpetual
HTD's objective is to "provide a high level of after-tax total return from dividend income and capital appreciation." They highlight that the fund can be used for "tax-sensitive equity income." After all, even folks in retirement looking for fixed income should have some exposure to equities as well to maintain some diversification.
Their approach to investing is "typically investing at least 80% of assets in dividend-paying securities." With that, they will "typically emphasize preferred and common securities in the high dividend-paying utility sector."
HTD utilizes a fairly high amount of leverage. With being a relatively more stable fund due to the safer underlying holdings, it often isn't a problem. However, during times of panic, everything gets sold off, which means deeper losses than there otherwise would be when that happens.
Additionally, with higher interest rates comes higher interest expenses for most CEFs as they utilize borrowings at floating rates. In the case of HTD, their interest expense went from $3.11 million last year to $7.9 million this year. That helped take their total expense ratio from 1.55% last year to 2.04% this year. This was the case despite their total outstanding debt sitting at $419 million at the end of both years.
Their fiscal year-end is in October, so interest rates have been hiked even further since then. Therefore, their costs are expected to have also climbed even further now.
The silver lining here is that HTD's management didn't just take these higher interest rates sitting down. To hedge against this negative, the fund implemented short future contracts on 10-Year U.S Treasury Notes.
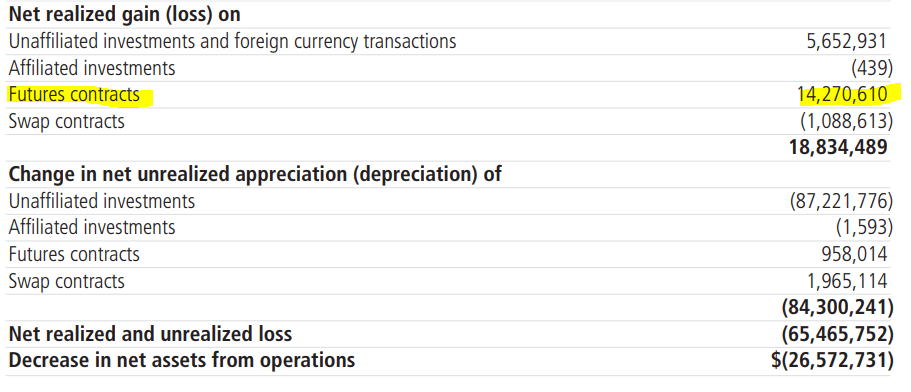
Thus, the rising costs that hit NII were recouped in realized capital gains. In fact, it was such a successful trade that it paid the fund back nearly three times the negative impact of rising rates. The interest expenses rose by $4.79 million, but they realized $14.271 million from their futures contracts.
HTD Breakdown of Realized/Unrealized Gains/Losses (John Hancock)
Performance - Discount Too Shallow
Given their positioning in relatively stronger sectors, particularly the energy exposure, the fund has done very well in the last year. I've included the results of several ETFs below. I had to include quite a few since HTD is quite diverse. Yet, they aren't diverse enough to be a diversified fund that we could compare to a specific asset class such as the S&P 500 Index.
Therefore, I've included the Utilities and Energy Select Sector SPDRs ( XLU ) and ( XLE ). I've also included the iShares Preferred and Income Securities ETF ( PFF ) and Vanguard Total Bond Market ETF ( BND ) to help represent their preferred and fixed-income exposures.
Ycharts
We see that HTD came in quite close to the results of XLU on a total NAV return basis. Being heavily invested in that sector certainly helped. We could have seen even better results if the fund had increased energy exposure meaningfully. For the most part, the fund had typically carried energy exposure anyway. Of course, those results were dragged down by the underperforming sleeve of their portfolio, which were the preferred and bond exposure.
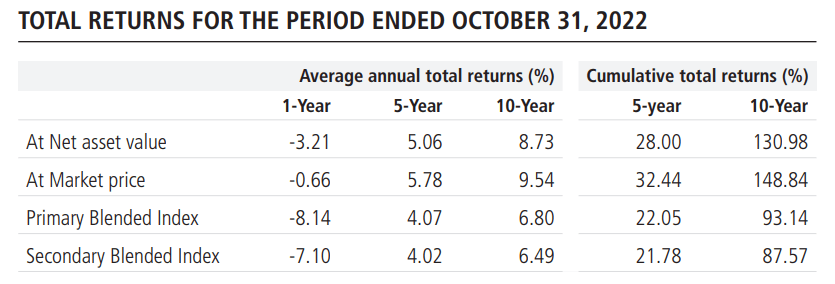
Over the longer term, the fund has shown outperformance against its assigned benchmarks.
Here's the benchmark blend that the fund utilizes:
- "The Primary Blended Index is 55% ICE BofA U.S. All Capital Securities Index and 45% S&P 500 Utilities Index."
- "The Secondary Blended Index is 55% ICE BofA Preferred Stock DRD Eligible Index and 45% S&P 500 Utilities Index."
For the last few years, the fund has occasionally flirted with trading at a premium. However, that was traditionally quite rare for the fund that often sported a deep and persistent discount. Even while trading at premiums every now and then in the last few years, 5-10% discounts can crop up from time to time. Therefore, the current discount being so shallow isn't representing the strongest time to jump into this fund.
Ycharts
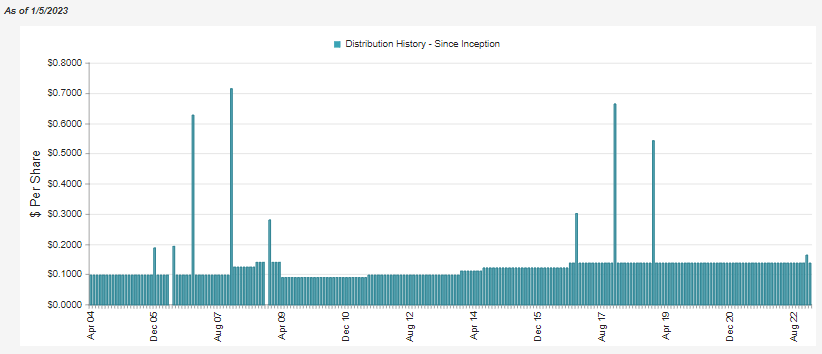
Distribution - Steady
The fund's distribution currently comes to 7.13%, with a similar NAV rate due to the non-existent discount. The monthly $0.138 has been in place for several years now, and given the current NAV rate, it appears to be safe to stick around for several more years.
It might be hard to tell, but they even paid a small special of $0.0272 to distribute long-term capital gains.
Since they also realized some gains in the underlying portfolio during this time, it bumped up the realized gains for the year to $18.834 million. They then had an NII of $38.9 million. Interestingly, it would add up to just under the $58.651 million they paid.
So admittedly, I'm not sure where the added long-term capital gain distribution would have been necessary. Sometimes the capital gains can be from the year prior as spillback distributions, but last year we see that NII and realized gains once again came in just short of the distribution. My assumption would be they realized more gains throughout the calendar year in November and December and wanted to distribute out the excess there.
The fund's distribution was mostly classified as ordinary income for tax purposes.
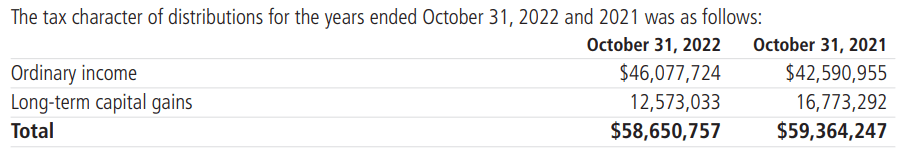
We should be getting the official breakdown fairly shortly, but looking back at 2021 , 100% of the ordinary income ended up being qualified dividends. This generally makes the fund tax-advantaged, as its name implies.
HTD's Portfolio
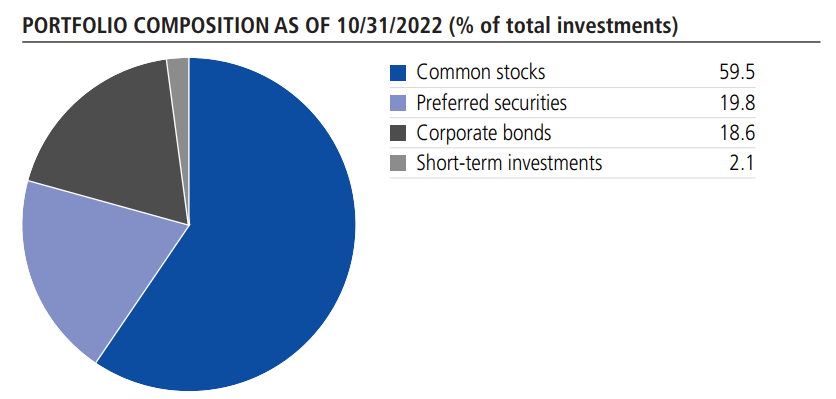
At the end of October 2022, the portfolio had nearly 60% allocated to common stocks. The remainder was mostly an even split between preferred and corporate bond securities.
For the preferred securities sleeve, it was a slight decrease from earlier in the year. Conversely, corporate bonds saw their allocation tick up slightly higher. Short-term investments also saw an increase in their allocation, albeit still pretty much insignificant.
That was the last portfolio composition they provided. More recently, at the end of November 2022, their sector allocations can be seen below. In that, we can see that, for the most part, utilities comprise a significant portion of their portfolio regularly.
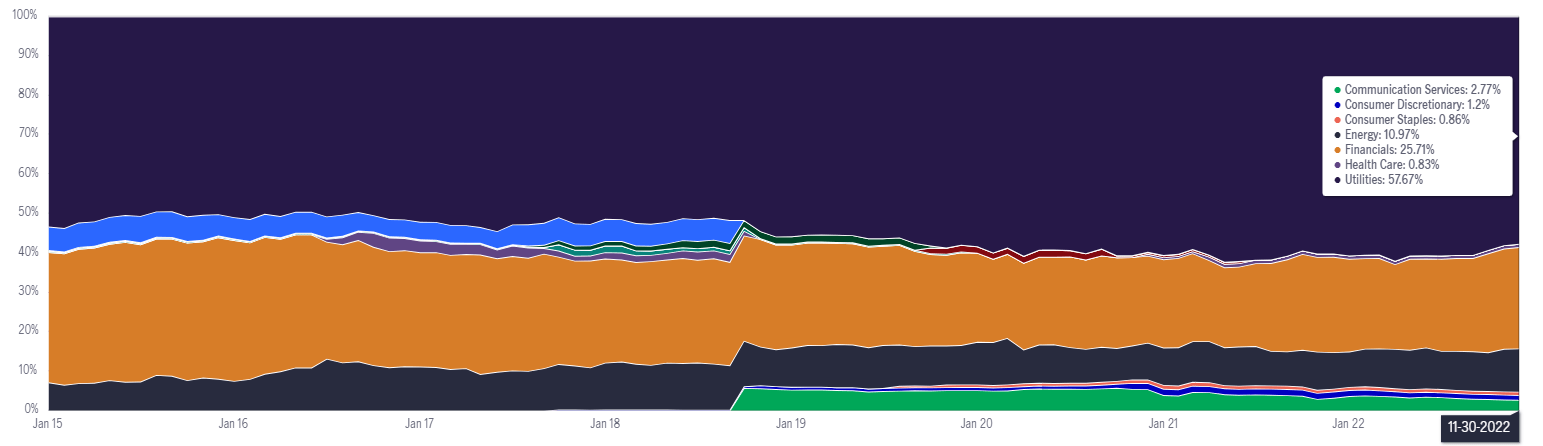
Energy exposure was around 11%, which is a bit higher than the previous allocation. It could be a conscious effort to increase energy exposure. Otherwise, simply seeing the energy sector perform well would have contributed to this increased exposure too.
One might also remark on the high allocation of financial sector exposure here. That is where the preferred and bond exposure comes in, as that sleeve contains a number of financial institutions.
Overall, there aren't a lot of changes in this portfolio. That's reflected in the fairly shallow portfolio turnover. In the last fiscal year, turnover was reported at 11%. That was the lowest in the last five years, but the other years wouldn't indicate massive changes in the primary composition either. 2018 showed the highest turnover at 24%.
With minimal turnover, their top holdings also mirror that same trend, with fairly few changes.
HTD Top Ten Holdings (John Hancock)
In this case, Williams Cos ( WMB ) and CenterPoint Energy ( CNP ) had interestingly changed places since our last update when the holdings were reflecting the end of July 2022 composition. American Electric Power Company ( AEP ) held its ground at the number two spot in the fund. Instead of this all being driven by actively shifting the number of shares they held, it would appear simple underlying performance also played a role.
At the end of July , they held 1,080,000 shares of WMB, and that was the same at the end of October. This was the same for AEP, as they held 375,000 in each reporting period. However, for CNP, they held 1,335,923 shares but trimmed that down to 1,120,923.
Ycharts
A newcomer to the top ten list in this latest update for HTD was BP ( BP ). However, BP has been held in the portfolio at a lower allocation. This would be once again strictly due to the strong performance of the position rather than an active choice to increase the allocation. They held 845,450 shares throughout this period.
Ycharts
Conclusion
HTD is a strong fund for consideration in one's portfolio for a long-term investor. However, the latest shallow discount would give me pause before picking up shares at this level for investors who already hold a position. A dollar-cost average approach could be appropriate if you want at least some exposure immediately. Otherwise, more patient investors could hold off, waiting for those 5-10% discounts that present themselves.
For further details see:
HTD: Portfolio Mix Helped This Fund Through 2022