BPAQF - HTD: This 7.98%-Yielding CEF Might Be Worth Considering Today
2023-03-28 12:39:49 ET
Summary
- Investors today, like all Americans, are desperately in need of extra income to maintain their lifestyles in the face of high rates of inflation.
- John Hancock Tax-Advantaged Dividend Income Fund invests in a portfolio of dividend stocks and then applies leverage to boost the portfolio.
- The HTD closed-end fund's portfolio consists primarily of utilities and other companies that have remarkably stable cash flows and are resistant to economic troubles.
- The 7.98% yield is probably sustainable unless we get a prolonged bear market.
- The HTD fund is currently trading at a discount to the net asset value, which is rare for it lately.
Without a doubt, one of the biggest problems plaguing most Americans today is the incredibly high inflation rate that has dominated the economy for the past eighteen months. There has, in fact, not been a single month over the past year in which the consumer price index appreciated by less than 6% compared to the same month of the prior year:
This has caused real wage growth to be negative for 23 straight months and as such has forced many Americans to take on second jobs or enter the gig economy just to get the extra money that they need to pay their bills and maintain their lifestyles. In a recent blog post , I speculated that this may be one reason that the reported job numbers continue to be strong despite the massive number of layoffs at some of our nation’s largest companies.
Fortunately, as investors, we do not have to resort to such methods in order to obtain the extra money that we need to maintain our lifestyles in the current environment. This is because we can put our money to work for us to generate that income. One of the best ways to do that is to purchase shares of a closed-end fund, or CEF, that specializes in the generation of income. These funds are not particularly well-covered by the investment media and many investors and advisors are not familiar with them. That is unfortunate because these funds can provide anyone with easy access to a diversified portfolio of assets that can in many cases deliver a higher yield than any of the underlying assets actually possesses. Indeed, these funds tend to have some of the highest yields available in the market.
In this article, we will discuss the John Hancock Tax-Advantaged Dividend Income Fund ( HTD ), which is one closed-end fund that specializes in the generation of income. As of the time of writing, this fund yields 7.98%, which is certainly a high enough level that it can be a respectable source of income. I have discussed this fund before, but as several months have passed, a great many things have changed. This article will therefore focus specifically on these changes as well as provide an updated analysis of the fund’s financial performance. Let us investigate and see if this fund could be a worthy addition to your portfolio today.
About The Fund
According to the fund’s webpage , the John Hancock Tax-Advantaged Dividend Income Fund has the stated objective of providing its investors with a high level of after-tax total return. Admittedly, this does not sound like an objective that we would expect from an income fund. After all, income funds usually target earning income as their objective, not total return. However, when we consider that this fund’s portfolio is 64.93% invested in common stocks, the objective starts to make more sense:
CEF Connect
The reason that this makes sense is that common stock is a total return vehicle. After all, we usually purchase common stock with the intention of receiving income through the dividends that it pays out as well as the potential for capital gains as the issuing company grows and prospers. This fund seems to be after both of these things too as it specifically states that it wants to get the total return from dividend income and capital gains. The fund’s largest holdings certainly make sense in this light, as they are all generally high-yielding equities in companies with reasonably stable cash flows:
We see here numerous utilities, as well as companies like The Williams Companies ( WMB ), which is a midstream company that has incredibly stable cash flows due to its contract-based business model that is based on the volume of resources that moves through its pipeline network. The Williams Companies also has significant growth potential due to the rapidly growing demand for natural gas along the East Coast of the United States. Nearly all of the remaining companies on this list are utilities, which also have very stable cash flows. This comes from the fact that the product that they provide is generally considered to be a necessity for modern life, so people almost always prioritize paying their utility bills ahead of discretionary expenses during times when money gets tight. That makes these companies highly resistant to recessions or other economic disruptions, which may be important today given the strain that inflation is putting on the budgets of many households and the Federal Reserve’s goal of pushing the economy into a recession to stop the rampant inflation.
The outlier here is BP p.l.c. ( BP ), which is one of the largest energy companies in the world. Its cash flows are much less stable over time than utilities or midstream firms. This is due to its significant exposure to crude oil and natural gas prices, which can prove to be quite volatile. Indeed, anyone that watched the markets back in 2020 can attest to that, as oil prices have certainly increased a lot from the negative level that they hit back in April of 2020! BP does have a respectable 4.30% yield at the current price, though, which is one of the highest of the supermajor energy companies, and it has some growth potential as anyone that reads my articles regularly is well aware. Thus, its presence here is not a real departure from the fund’s strategy of investing in high-yielding companies with growth potential.
There have not been significant changes to this list in the past four months since we last looked at this fund. In fact, the only change is that Dominion Energy ( D ) was replaced with Entergy Corporation ( ETR ). We did see a number of companies' weightings change, but this can easily be caused by one stock outperforming another in the market. The fact that there were so few changes may lead one to assume that the John Hancock Tax-Advantaged Dividend Income Fund has a very low turnover. That is certainly true as the fund has an 11.00% annual turnover in 2022, which is one of the lowest levels that I have ever seen in an equity closed-end fund. The reason that this is important is that trading stocks or other assets costs money, which is billed directly to the shareholders. That creates a drag on the portfolio’s performance and makes management’s job much more difficult. This is because the fund’s management must generate sufficient returns to offset these extra costs and still have enough left over to give the shareholders an acceptable return. There are very few management teams that accomplish this on a consistent basis, which is one reason why actively-managed funds usually underperform comparable index funds.
The John Hancock Tax-Advantaged Dividend Income Fund has mixed results compared to its benchmark index. This chart comes from the fund’s sponsor and compares its performance to two benchmark indices:
As we can see, there were certain periods during which the fund managed to beat its index and others in which it failed to do so. Generally speaking, though this fund does compare reasonably well to these indices over the long term. However, none of these performance figures is particularly impressive when compared to the S&P 500 Index (SP500); however, as I explained in a previous article , a substantial portion of the overall performance of the S&P 500 Index over the past decade was driven by a handful of technology companies that would never be included in a dividend-focused fund or index. Fortunately, this has started to change in recent months as we have started to see a shift to value and traditional dividend investing. This is likely because these companies have very reasonable multiples and cash flows to back up their valuation. These are not companies that have to grow into their valuations, like many of the companies that delivered high gains during the free money era.
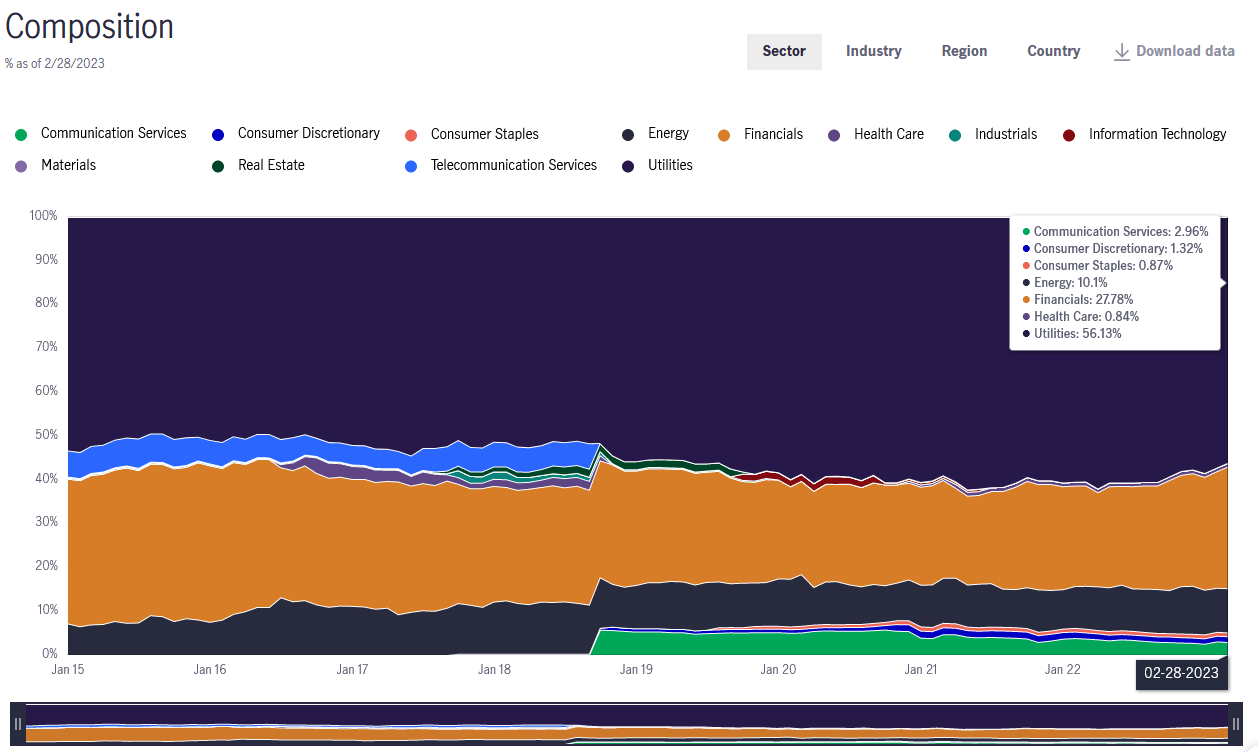
As we saw earlier in this article, the John Hancock Tax-Advantaged Dividend Income Fund has significant exposure to the utility sector. However, its actual exposure here is not as great as we may think by looking simply at the largest positions in the fund. In fact, as of February 28, 2023, only 56.13% of the fund is invested in this sector:
This is somewhat nice to see as utilities are not particularly high-growth companies, although when combined with their dividends, they can usually give a total return of around 10% annually. The fact that we see a number of other companies here does add a bit of diversity and separates this fund from a utility-focused fund like the Duff & Phelps Utility and Infrastructure Fund ( DPG ). Thus, it could play well with a fund like that and still not result in a portfolio being overweighted to the utility sector. The utilities do provide a nice anchor right now though, due to the protection that they provide against economic uncertainty.
Leverage
As stated in the introduction, closed-end funds like the John Hancock Tax-Advantaged Dividend Income Fund have the ability to earn and pay out a yield that is significantly higher than any of the underlying assets actually possesses. One way that this is accomplished is through the use of leverage. In short, the fund borrows money and then uses that borrowed money to purchase shares of utilities and other assets. As long as the return that it gets from the purchased assets is higher than the interest rate that the fund has to pay on the borrowed money, the strategy works pretty well to boost the effective yield of the portfolio. This fund is capable of borrowing money at institutional rates, which are significantly lower than retail rates, so this will usually be the case.
However, the use of debt in this fashion is a double-edged sword. This is because leverage boosts both gains and losses. As such, we want to ensure that the fund is not employing too much leverage because that would expose us to too much risk. I generally do not like to see a fund’s leverage exceed a third as a percentage of its assets for this reason. Unfortunately, the John Hancock Tax-Advantaged Dividend Income Fund’s levered assets currently comprise 36.03% of its portfolio so it exceeds this limit. This is disappointing as it may be a sign that the fund is taking on too much risk in pursuit of returns. In particular, this high leverage will likely cause the fund to significantly underperform the market in the event of a market decline. We can see this above as the fund generally loses more than its benchmark indices during flat or declining markets. As this is the sort of market that we will probably have for a while, this high leverage could prove to be a significant risk for investors.
Distribution Analysis
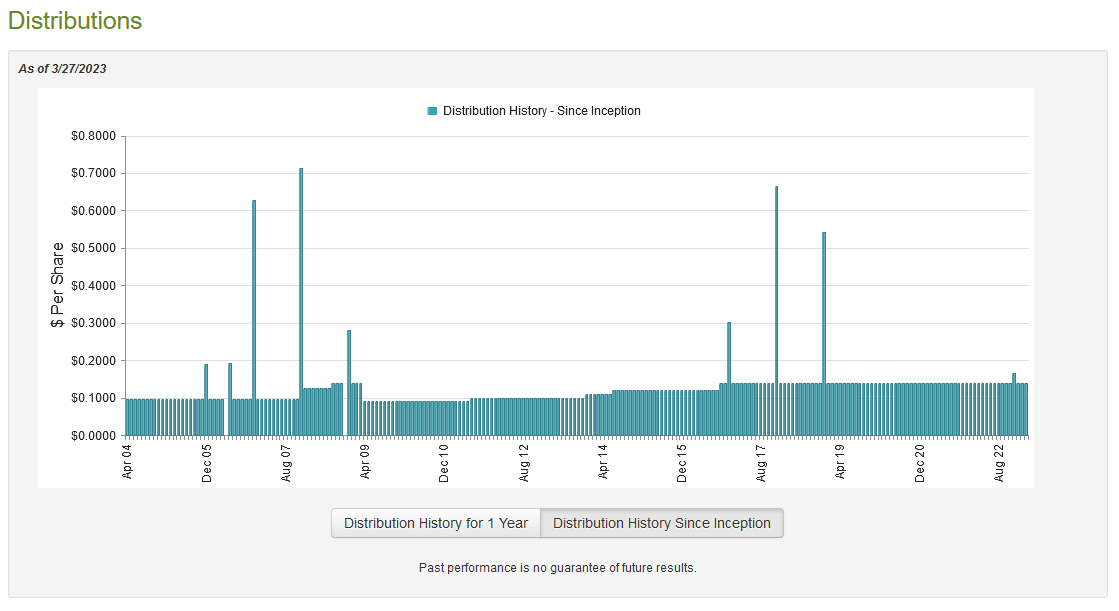
As stated earlier in this article, the strategy of the John Hancock Tax-Advantaged Dividend Income Fund revolves around purchasing dividend-paying common and preferred stocks and then applying leverage to artificially boost the yields. As many of the companies that it purchases are utilities, midstream companies, and similar firms, these stocks generally have fairly high yields and the leverage boosts that. As such, we can likely assume that the John Hancock Tax-Advantaged Dividend Income Fund will have a fairly high yield itself. That is certainly the case as it pays out a monthly distribution of $0.1380 per share ($1.656 per share annually), which gives it a 7.98% yield at the current price. The fund has been incredibly consistent with its distribution over the years, as it has been steadily increasing since 2009 and has had no cuts since the financial crisis:
This is a better track record than most other closed-end funds and the fact that the fund did not have to cut the distribution in response to the weak market of 2022, as many other funds did, is a testament to the overall strength of its strategy. This consistency is also quite likely to appeal to any investor that is looking for a safe and secure source of income that can be used to pay their bills and otherwise maintain their lifestyles. However, it is always critical to analyze the fund’s finances and determine its ability to afford its distribution. After all, we do not want to find ourselves the victims of a distribution cut since such an event will reduce our incomes and almost certainly cause the fund’s share price to decline.
Fortunately, we do have a recent document that we can consult for the purposes of our analysis. The fund’s most recent financial report corresponds to the full-year period that ended on October 31, 2022. While this report will not include any data about the fund’s performance over the past few months, it is still newer than the report that we had available to us the last time that we reviewed this fund, and it should give us a pretty good idea of how the fund handled the challenging conditions in 2022. During the full-year period, the John Hancock Tax-Advantaged Dividend Income Fund received a total of $44,294,880 in dividends and $12,846,932 in interest from the investments in its portfolio. When we net out the money that the fund had to pay in foreign withholding taxes, it had a total investment income of $56,867,232 over the course of the year. The fund used this money to cover its expenses, which left it with $38,893,021 available for shareholders. Unfortunately, that was not nearly enough to cover the $58,650,757 that the fund actually paid out during the period. That is likely to be concerning at first glance as the fund is not earning enough net investment income to cover its expenses.
However, a fund like this does have other methods through which it can obtain the money that it needs to pay its distribution. For example, the fund might have had some capital gains. As might be expected, the fund generally failed at this during the period, although it did not do as poorly as many other funds. It reported net realized gains of $18,834,489 but this was offset by $84,300,241 net unrealized losses.
Overall, the fund’s assets declined by $84,899,570 during the period after accounting for all inflows and outflows. This is certainly concerning as the fund failed to cover its distributions in aggregate. However, the fund’s net investment income plus its net realized gains work out to $57,727,510 over the period. That was pretty close to the amount that the fund paid out in distributions. In addition, the fund’s assets were $766,504,519 on November 1, 2020, and $804,062,083 on October 31, 2022, so the fund did earn sufficient income and capital gains over the two-year period to cover all of its distributions, expenses, and still have money left over. Thus, the distribution is probably safe enough unless we have a bear market that lasts for quite a while.
Valuation
It is always critical that we do not overpay for any asset in our portfolios. This is because overpaying for any asset is a sure-fire way to generate a suboptimal return on that asset. In the case of a closed-end fund like the John Hancock Tax-Advantaged Dividend Income Fund, the usual way to value it is by looking at the fund’s net asset value. The net asset value of a fund is the total current market value of all the fund’s assets minus any outstanding debt. It is therefore the amount that the shareholders would receive if the fund were immediately shut down and liquidated.
Ideally, we want to buy shares of a fund when we can acquire them at a price that is less than the net asset value. This is because such a scenario implies that we are purchasing the fund’s assets for less than they are actually worth. This is, fortunately, not the case with this fund today. As of March 24, 2023, the John Hancock Tax-Advantaged Dividend Income Fund had a net asset value of $20.83 per share but the shares currently trade for $20.75 each. That gives the fund’s shares a rather small 0.38% discount to the net asset value at the current price. While this is a very small discount, it is still much better than the 1.63% premium that the fund’s shares have averaged over the past month. Thus, the current price appears to be acceptable.
Conclusion
In conclusion, the John Hancock Tax-Advantaged Dividend Income Fund appears to be a reasonably conservative way to obtain some much-needed additional income to support our lifestyles today. The fund’s focus on companies in the utility sector is appreciated as these companies tend to be very stable and pay out high yields. In general, these stocks also generally held up much better in the tightening monetary environment, so that adds to the fund’s appeal. The 7.98% current yield of John Hancock Tax-Advantaged Dividend Income Fund is quite high, but it appears to be sustainable. Finally, the fund is trading at a discount to the net asset value, so the price appears to be right. Overall, the John Hancock Tax-Advantaged Dividend Income Fund might be worth considering today.
For further details see:
HTD: This 7.98%-Yielding CEF Might Be Worth Considering Today