HUBB - Hubbell: Fairly Priced Primed To Outpace Market Expectations
2023-10-12 09:01:07 ET
Summary
- Hubbell Incorporated has seen a 32% rally in its stock price this year, reflecting positive expectations for the electrical components and equipment sector.
- Hubbell manufactures electrical products and utility solutions for energy control, positioned at multiple points along the "utility meter".
- The company has demonstrated attractive economic returns, with increasing gross capital productivity and working capital efficiency.
Investment summary
Electrical components and equipment players have demonstrated attractive economic returns in FY'23. Expectations for the sector look to have revised higher on the back of this, reflected in the stock prices of selective opportunities this year. Hubbell Incorporated ( HUBB ) is one such name, having rallied ~32% this YTD as I write.
HUBB manufactures electrical products and utility solutions for companies + end markets to control their energy use. It is positioned at multiple points along the "utility meter", namely (i) in front of the meter, (ii) on the edge, and (iii) behind the meter systems.
For reference, (i) facilitates the transmission and distribution of electrical power to end-users through an interconnected network of transmission lines, distribution substations, and transformers , (ii) connects operators to owners to distribute energy via critical infrastructure, and (iii) involves owners/operators of buildings who are the consumers of energy.
HUBB is a low-margin, high capital turnover business where economic returns have been stretching higher since 2020. By all measures, these trends could continue moving forward. On my analysis, the market's expectations are reasonably flat, presenting the opportunity for HUBB to outpace what's currently priced into its market value. Net-net, I rate HUBB a buy based on the factors presented in this report, eyeing $326/share as the next price objective.
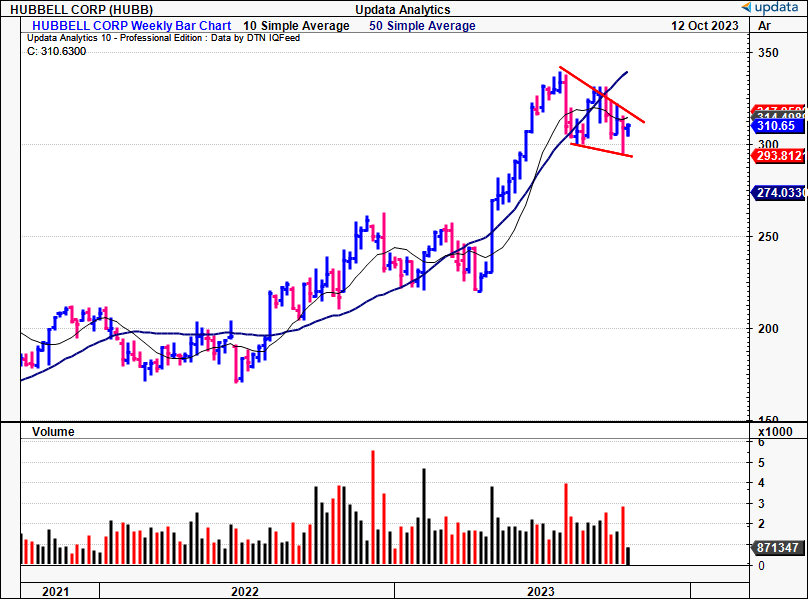
Figure 1. HUBB 3-year price evolution, weekly bars
Critical facts pattern underpinning investment thesis
1. Recent developments
- Most recent numbers:
The company posted its Q2 results in July with missed revenues (of just $10mm) vs. The Street's estimates. The stock was heavily sold after this which may or may not be warranted given the high expectations embedded into the name's market value. Specifically:
- Top-line sales came in at $1.37Bn, up 9% YoY, with ~600bps of organic growth and 300bps from acquisitions. For the half, it booked $2.65Bn of sales.
- Critically, operating margins were up ~6% YoY to 17.3% for the quarter, and this helped earnings growth to $4.07/share. This reflects its restructuring efforts initiated this year, where it focused on cost reductions, consolidating distribution, and trimming its workforce.
- Management raised guidance at the bottom line to $15.25/share at the upper bound, calling for 40% YoY growth. It also forecasts revenues of $5.3-$5.4Bn, which equates to 8-10% growth in 2022.
BigInsights
As to the segmental breakdown, its utility business continues to dominate the top line with $831mm in quarterly sales, up 14% YoY. Around 100bps of this was acquisition-related, and management noted the upsides were mainly pricing vs. demand (volume). Growth was observed across all sub-segments, booking a pre-tax margin of ~26% of sales.
Meanwhile, its electrical solutions segment did $535mm of business, growing ~100bps from Q2 last year. Most of the growth was from its acquisitions, as organic sales were down 4%. It also booked a lower pre-tax margin of 17%, up from 15% last year.
2. Value created on economic performance
HUBB's long-term prospects are well observed when using sound economic principles.
In particular, there are two factors worth noting:
- Gross capital productivity and working capital efficiency.
- Economic earnings on existing and incremental capital deployed into the business.
Gross productivity + NWC efficiency
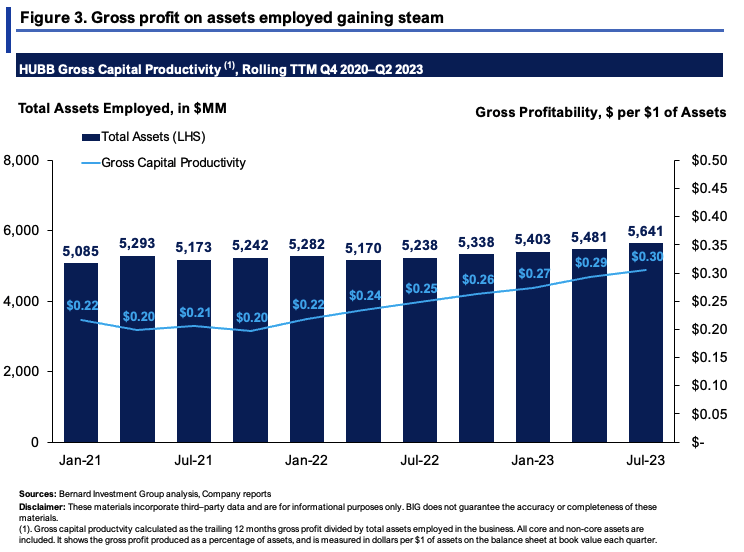
As a function of total assets employed into the business, HUBB's gross profitability has been stretching higher since 2021. Figure 3 outlines the gross profit on total assets tied up on the balance sheet on a rolling TTM basis. This measures all core and non-core assets as a measure of management's decision-making.
Gross productivity has stretched up from lows of $0.20 per $1 in assets in 2021 to $0.30 last period, on asset growth of $556mm over the last 2.5 years, equating to an increase of $0.10 on the dollar in gross per $1 of assets booked.
HUBB's rolling COGS is also high, averaging 70% of sales over the last 3 years, so cash conversion is paramount for the company. On this, the cash conversion cycle came in at 80 days last period, down from 104 days in 2021 and flat on ~80 days Q2 last year. This stems on DSO of 55 days, and the company can turn over its NWC 4.56x per year at this pace.
Economic characteristics
HUBB is creating economic value for its shareholders in the following ways:
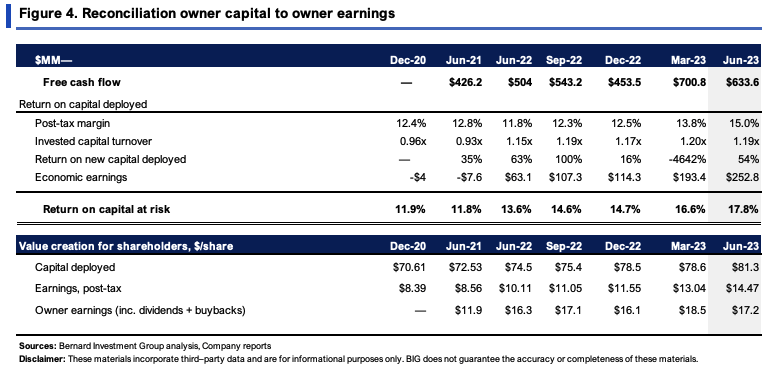
(1). It had invested $81.30/share of capital into the business by Q2 FY'23, 107% of the capital provided by investors (debt, equity). On this, it produced $14.47/share in post-tax earnings, 17.8% return on investment (TTM values).
(2). This is higher up from $8.31/share produced on $70.61/share investment back in 2020, or 11.9% ROIC.
(3). In fact, the company's return on capital deployed has increased each period since 2020, along with the profits generated on incremental investments (Figure 4).
(4). Post-tax margins have increased from 12% to 15% since 2020, as capital turnover increased from 0.98x to 1.2x. The increase in capital turns indicates HUBB's cost leadership strategy is starting to pull through.
This evidences the company's propensity to grow earnings off its capital base. Since 2020, it reinvested $10.70/share back into operations and grew NOPAT by $6.16/share, a 58% incremental return on investment.
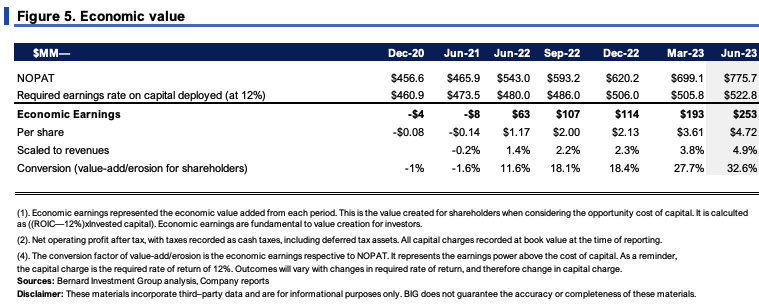
Long-term market rates (inc. inflation) hover ~12%, the required rate of return we employ in all equity holdings. On this basis, the company has produced a series of economic earnings since 2021, totaling $4.72/share last period (TTM values), otherwise 5% of revenues. Hence, 5% of sales were economically valuable for shareholders last period.
3. Technical considerations
Market-generated data is conflicted for HUBB in my view. For instance, money flows have biased to the downside since H2, representing capital flows out of the stock, as shown in Figure 6. Corresponding price action has been rather flat since this point.
Figure 6. Money flows into/out of HUBB equity
Data: Updata
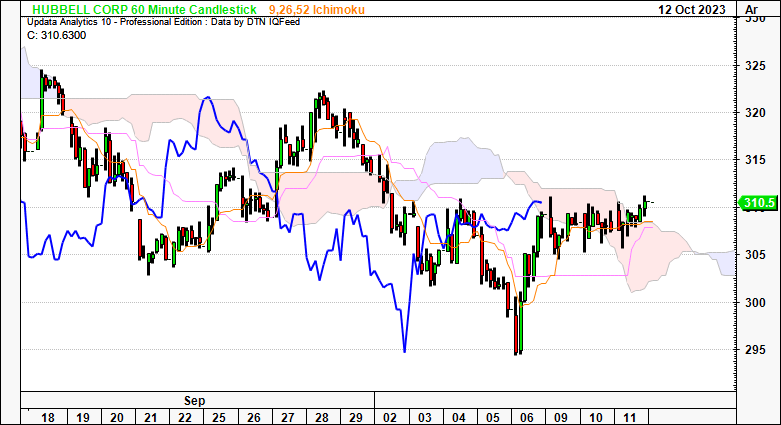
The cloud charts in Figures 7 to 9 exemplify the mixed positioning in detail. On the 60-minute chart below, a recent uptick in October has the price line nudging above the cloud, with the lagging line crossing the base. This looks to the coming days, and could therefore be constructive.
Figure 7. 60-minute chart, looking to the coming days
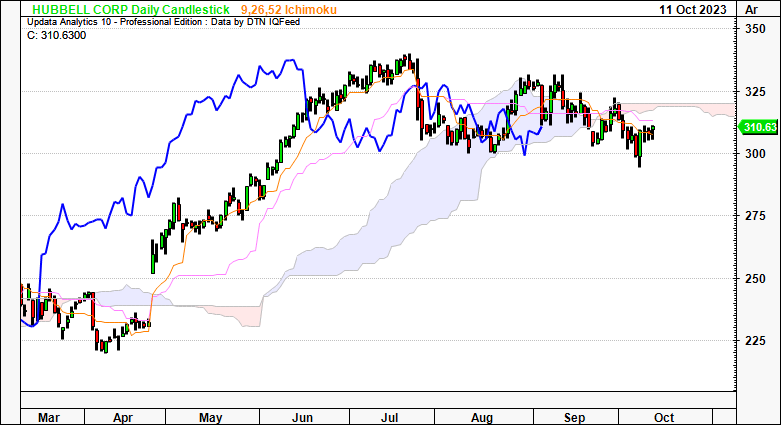
The daily chart is less convincing. Both price and lagging lines are beneath the cloud top, continuing the downtrend since July. A break above $312 is needed to exert a bullish move so I'd advocate watching the next few weeks very closely to observe any convergence to this mark. Right now, the daily chart is neutral in my view.
Figure 8. Daily chart, looking to the coming weeks
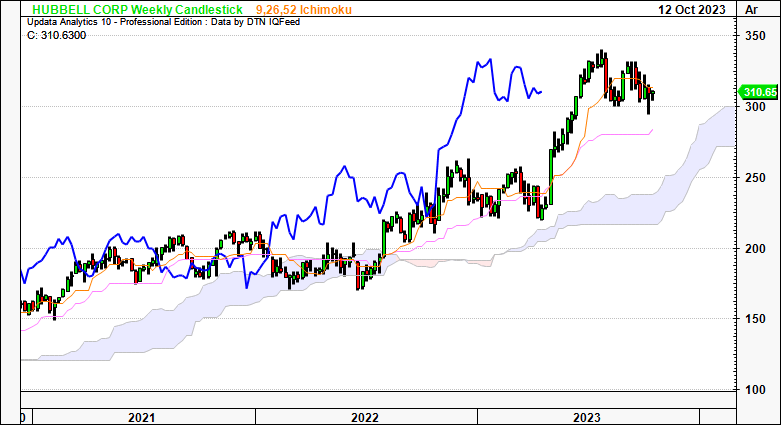
Meanwhile, the weekly chart tells a different story. Both price and lagging lines are firmly bullish, but tracking towards the cloud top. Should it continue on a medium-term downtrend, $300 could be the level to watch out for by March next year (the cloud top shown below). Typically, a large divergence from the cloud is seen as a downside risk, being that it could result in a reversal, without fundamental or sentimental catalysts to support further upside. This looks to the coming months, so I am still relatively constructive on HUBB over this time frame.
Figure 9. Weekly chart, looking to the coming months
Putting this all together, the point and figure studies tell the following story:
- Upside targets are to $393.00 but with the recent price action, this could be a price to far without a bullish reversal.
- Downside targets are to $264 then $237, which, in the event of a continued selloff, might be activated. A break below $300 could certainly have us tracking to these levels in my view.
- This is a 3x3 box reversal, meaning it looks at quite large intra-trend reversals before a new row or target is thrown off. So we'd need quite a large thrust in either direction to corroborate these targets.
These points confirm the mixed market views and should be factored into the broader picture.
Figure 10
Data: Updata
Valuation
The stock sells at 20.2x forward earnings and 16.5x forward EBIT as I write, ~16% and ~8% premiums to the sector, respectively. The question is, what do these multiples and premiums mean in terms of value (versus relative value).
For one:
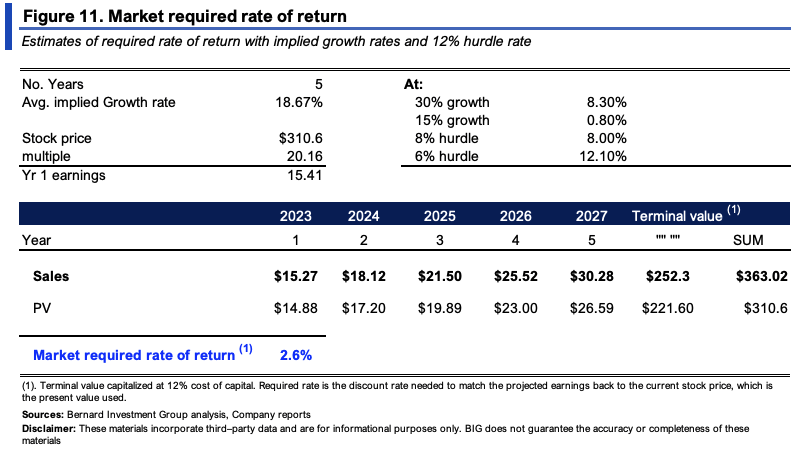
(i). At the 20.2x multiple, the market expects $15.41/share in earnings this year (310.8/20.16 = $15.41). Average growth expectations into FY'25 are 18.67% from consensus estimates. This is reasonable to expect into FY'28 in my view. After that, I've capitalized the continuing value at our 12% hurdle rate.
(ii). Under these stipulations, the market expects 2.6% required return from HUBB, ranging from 0.8% to 12.10% under the scenarios shown in Figure 11.
(iii). This is a relatively low benchmark and could suggest HUBB might catch a bid should it produce economic earnings above this mark.
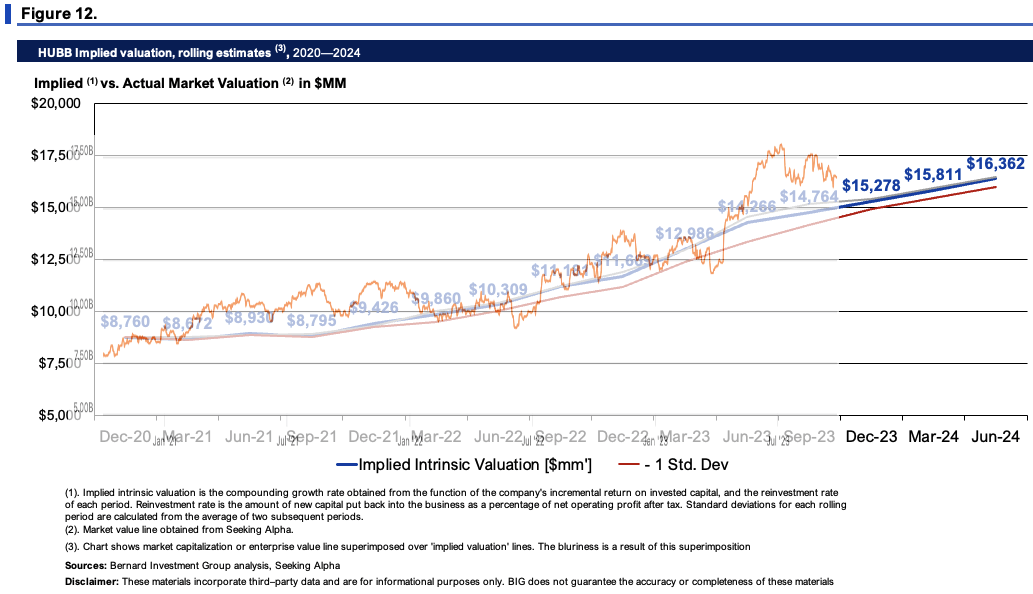
Secondly, compounding HUBB's intrinsic value at the function of its incremental ROIC and reinvestment rates (inc. projections to FY'24) illustrates the market has been an accurate judge of fair value the last 3 years. It would appear HUBB is slightly over-extended as I write, but discounting the FY'24 projections has it priced around fair value.
In my view, you'd be paying a fair price to get a hold of HUBB today, based on this calculus.
So in my view, 20x earnings is fair, and at this multiple to consensus FY'24 estimates of $16.18 EPS derive a value of $326.8, supporting a buy rating with a long-term view in mind.
Discussion summary
Based on the analysis shown here today there are multiple factors for consideration in the HUBB investment debate. Supporting the buy rating, are superb economic returns on capital required to run the business, growing profitability, and operating efficiencies from its restructuring efforts.
On the other hand, market technicals, equity flows, and mixed sentiment are potential risks to consider. It therefore comes down to factors of valuation and HUBB's ability to compound its intrinsic value going forward in my view. In that vein, HUBB warrants a bullish view in my opinion. It continues to redeploy capital at attractive rates of return, and the market's required rates of return are seemingly low, meaning it can outpace expectations with these economics. Net-net, I rate HUBB a buy with $326 as the next objective.
For further details see:
Hubbell: Fairly Priced, Primed To Outpace Market Expectations