HUM - Humana: Upgrade To Buy
2023-10-06 11:23:49 ET
Summary
- Humana has generated positive earnings over the last 6 to 7 years, even during the COVID-19 period.
- The balance sheet is strong with low debt levels, and the company is strongly cash flow positive.
- Based on analysts' consensus estimates and conservative multiples, share price growth can be expected to result in solid returns, buying and holding through the end of 2025.
Humana: Investment Thesis
Since my August 2021 article, " Humana: A Strong Buy The Dip ", the share price is up 18.64% with total return 20.49%. By December 2021, the Humana Inc. ( HUM ) share price had increased by 13.9% from its August level of $412.61 to $469.41, an annualized return of over 40%. I then published a further article on December 30, 2021, " Humana: Share Price Growth Likely to Slow ". And the share price growth has slowed, with total growth of just 4.17% from $469.41 at end of 2021 to the present $488.98, although the share price has been much higher in the intervening period. In fact, the share price reached a high for 2022 of $571.30 and a high for 2023 of $541.21. At the same time, the low for 2022 was $363.73, and for year to date 2023, $435.00, so the share price has shown a fair degree of volatility. Time to take another look at Humana to see if now might be an opportune time to buy. Based on analysts' consensus EPS estimates, it is reasonable to expect double digit returns, buying at the current stock price and holding through the end of 2025. Humana is upgraded from Hold to Buy. A more detailed financial analysis in support of the Buy rating follows.
Financial Analysis and Comment
Looking for market mispricing of stocks -
What I'm primarily looking for here are instances of market mispricing of stocks due to distortions to many of the usual statistics used for screening stocks for buy/hold/sell decisions. I believe the answer is to compare projections, based on analysts' estimates out to the end of 2024 or later, to past performance. Summarized in Tables 1 and 2 below are the results of compiling and analyzing the data on this basis.
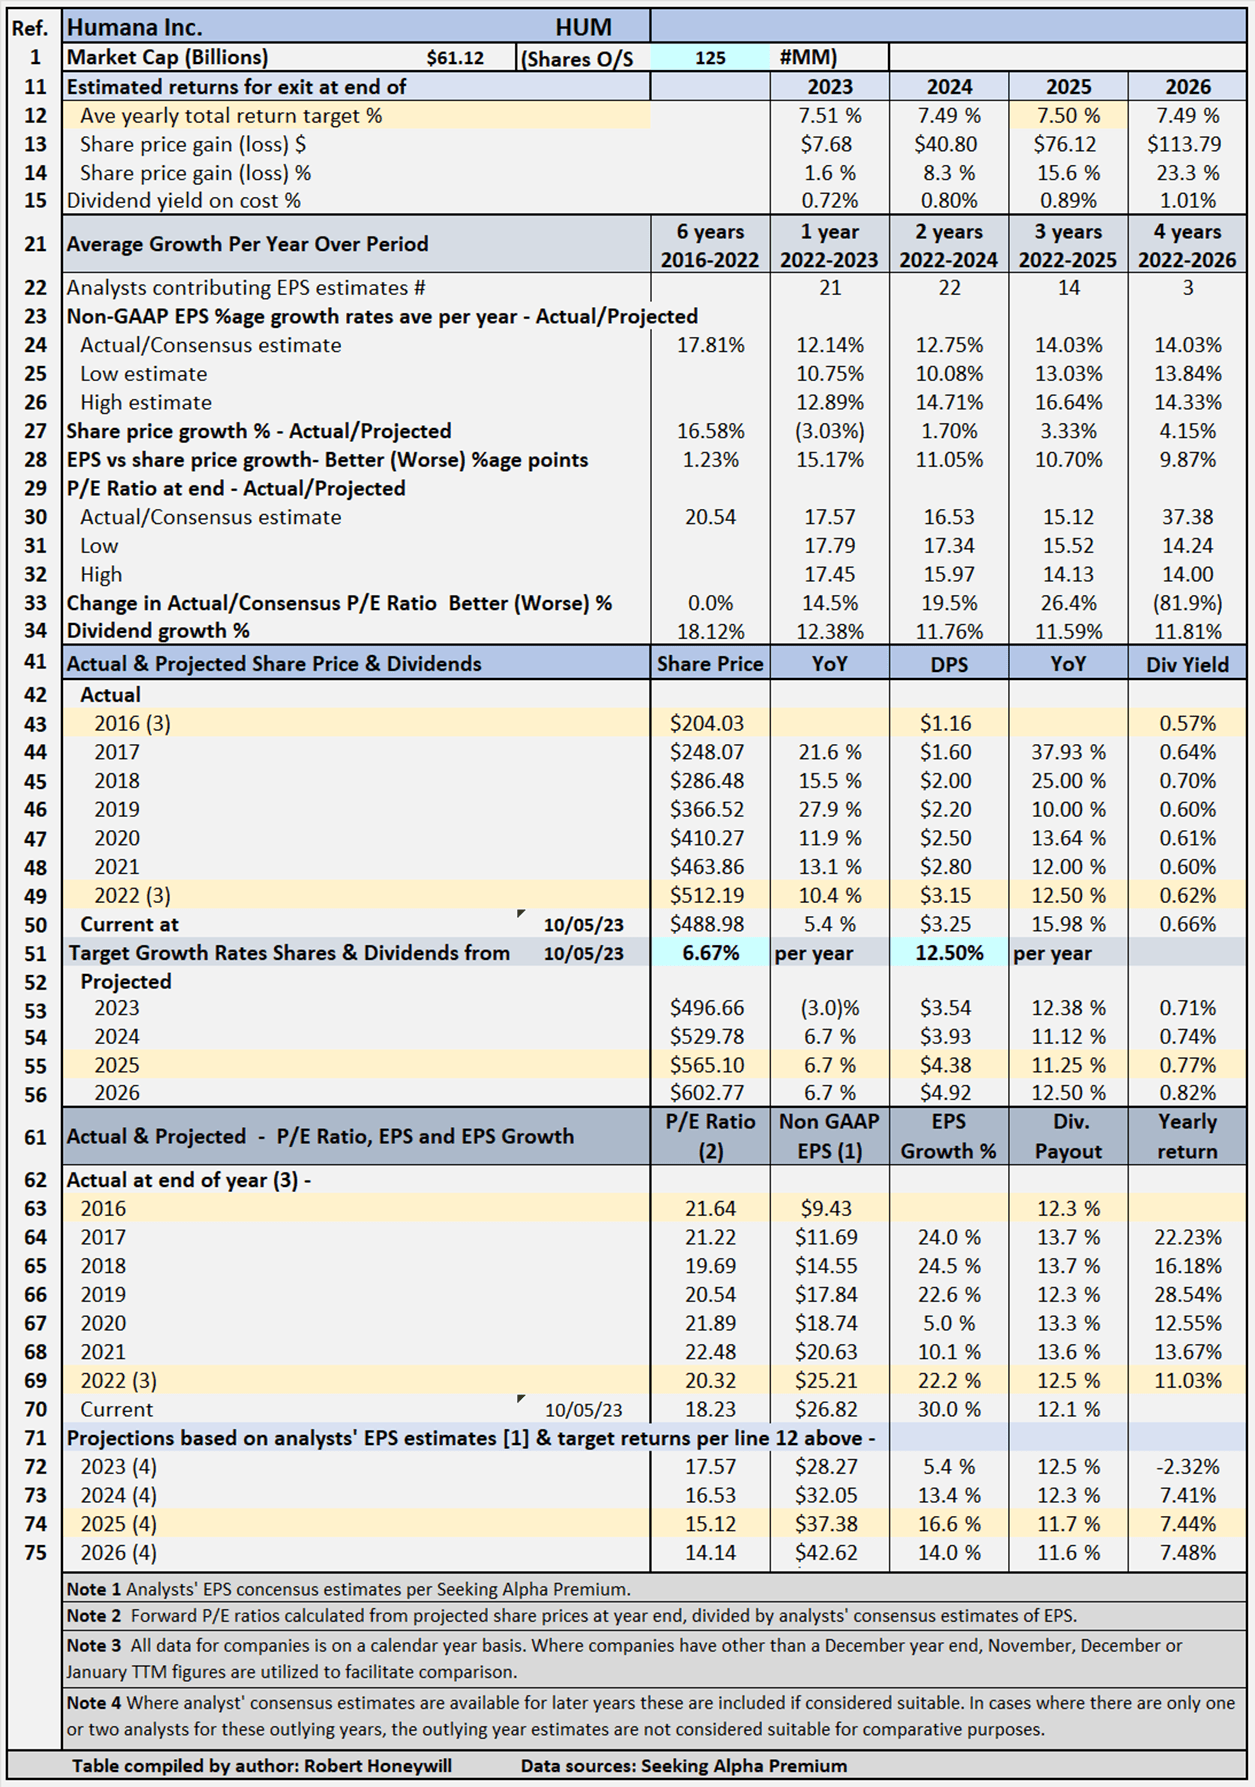
Table 1 - Detailed Financial History And Projections
Table 1 documents historical data from 2016 to 2022, including share prices, P/E ratios, EPS and DPS, and EPS and DPS growth rates. The table also includes estimates out to 2026 for share prices, P/E ratios, EPS and DPS, and EPS and DPS growth rates. (Note - while estimates are shown for analysts' EPS estimates out to 2023 to 2026 where available, estimates do tend to become less reliable, the further out the estimates go. These estimates are only considered sufficiently reliable if there are at least three analysts' contributing estimates for the year in question). Table 1 allows modeling for target total rates of return. In the case shown above, the target set for total rate of return is 7.5% per year through the end of 2025 (see line 12), based on buying at the Oct. 5, 2023, closing share price level. As noted above, estimates become less reliable in the later years. I have decided to input a target return based on the 2025 year, which has EPS estimates from fourteen analysts, because it allows for the impact of the projected EPS growth rates to be taken into account in the assessment of the value of Humana shares. The table shows to achieve the 7.5% return, the required average yearly share price growth rate from Oct 5, 2023 through Dec. 31, 2025, is 6.67% (line 49). Dividends and dividend growth account for the balance of the target 7.5% total return.
Reviewing Potential Total Return
First of all, I should explain a little about my approach to financial analysis of stocks. Rather than targeting a specific rate of return, I look at historical P/E ratios to see the potential impact on total return of a reversion to a range of P/E ratios above and below historical averages.
Total Return, Dividends, Share Price
The only way an investor can achieve a positive return on an investment in shares is through receipt of dividends and/or an increase in the share price above the buy price. It follows what really matters in share value assessment is the expected price at which a buyer will be able to exit shares, and expected cash flow from dividends.
Changes in Share Price
Changes in share price are driven by increases or decreases in EPS and changes in P/E ratio. Changes in P/E ratio are driven by investor sentiment toward the stock. Investor sentiment can be influenced by many factors, not necessarily stock specific.
"Equity Bucket"
Earnings are tipped into the "Equity Bucket" for the benefit of shareholders. It's prudent to check whether distributions out of and other reductions in the "Equity Bucket" balance are benefiting shareholders.
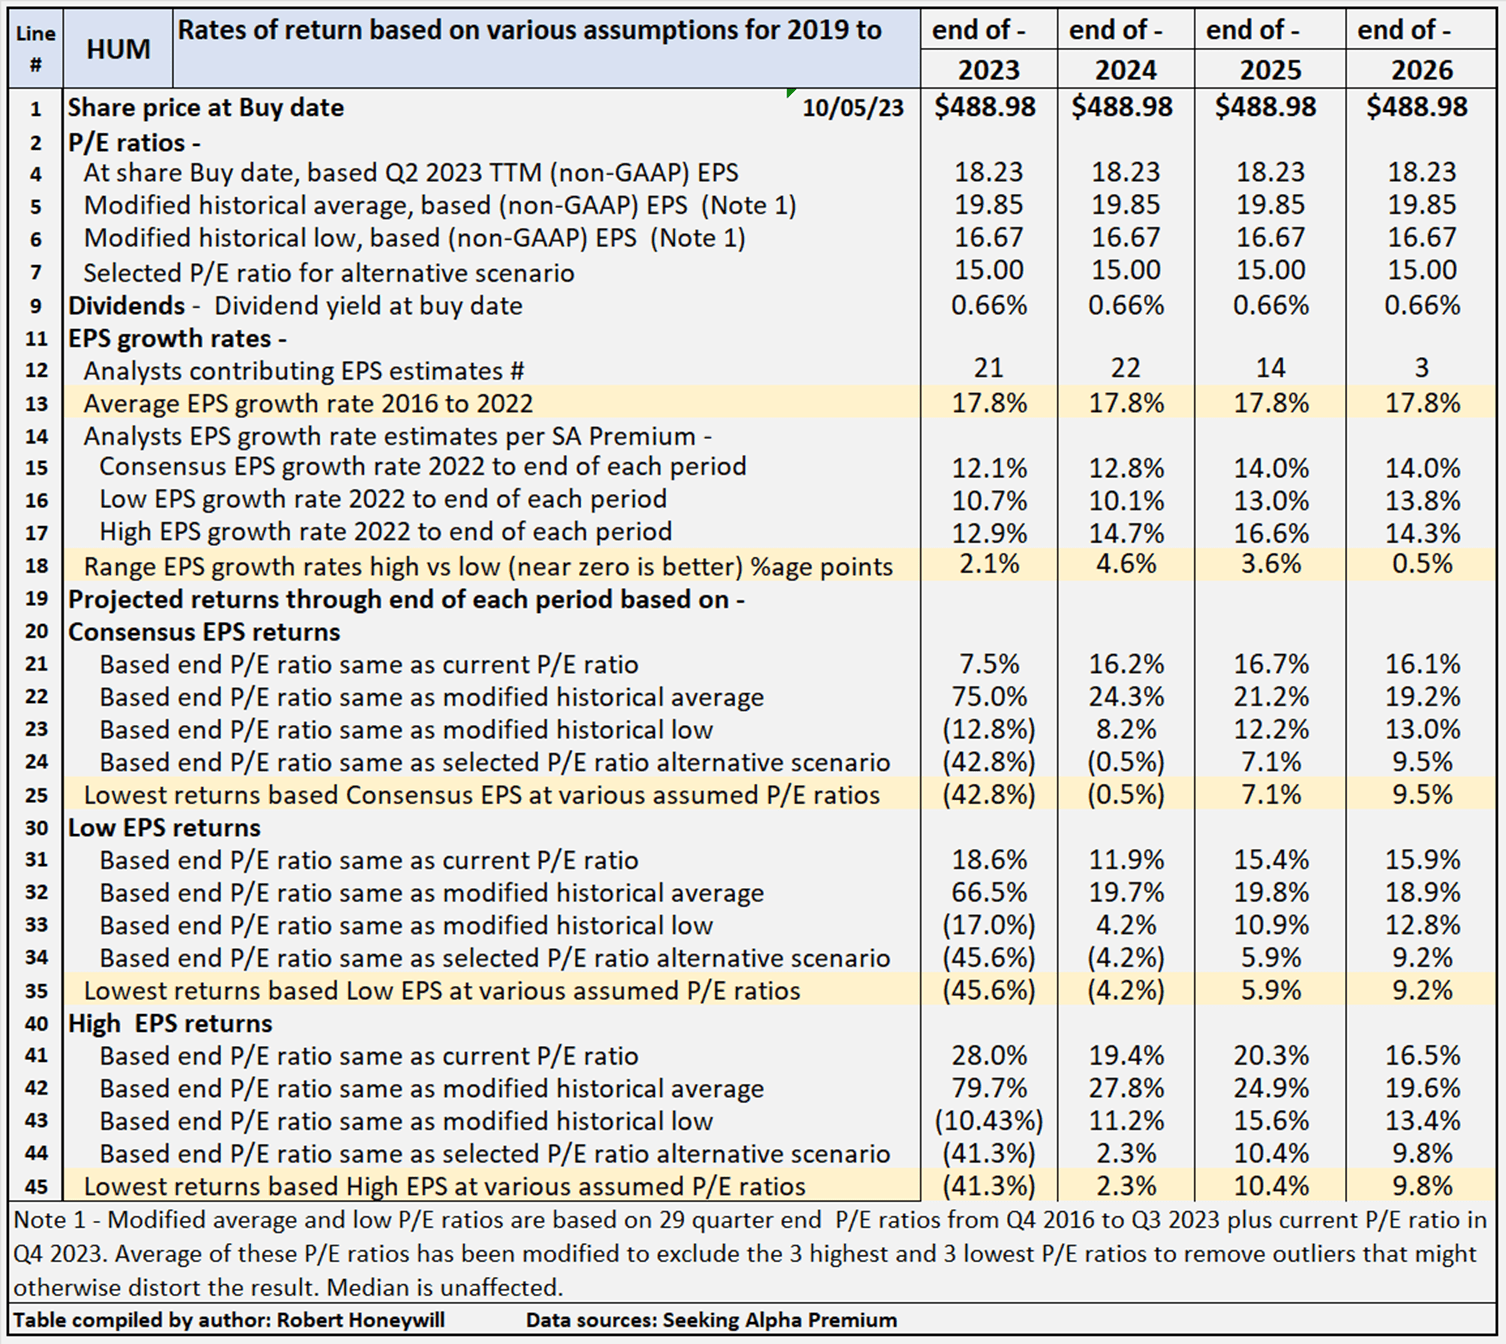
Humana's Projected Returns Based On Selected Historical P/E Ratios Through The End Of 2025
Table 2 below provides scenarios projecting potential returns based on select historical P/E ratios and analysts' consensus, low, and high EPS estimates per Seeking Alpha Premium through the end of 2025.
Table 2 - Summary of relevant projections Humana
Table 2 provides comparative data for buying at closing share price on Oct. 5, 2023, and holding through the end of years 2023 through 2026. There's a total of twelve valuation scenarios for each year, comprised of three EPS estimates (SA Premium analysts' consensus, low and high) across three different P/E ratio estimates, based on historical data, plus a fourth P/E ratio selected to provide an alternative scenario. Humana's P/E ratio is presently 18.23, which is below the historical average P/E ratio of 19.85. Table 2 shows potential returns from an investment in shares of the company across the range of P/E ratios This analysis, from hereon, assumes an investor buying Humana shares today would be prepared to hold through 2025, if necessary, to achieve their return objectives. Comments on contents of Table 2, for the period to 2023 column follow.
Consensus, low and high EPS estimates
All EPS estimates are based on analysts' consensus, low and high estimates per SA Premium. This is designed to provide a range of valuation estimates ranging from low to most likely, to high based on analysts' assessments. I could generate my own estimates, but these would likely fall within the same range and would not add to the value of the exercise. This is particularly so in respect of well-established businesses such as Humana. I believe the "low" estimates should be considered important. It's prudent to manage risk by knowing the potential worst-case scenarios from whatever cause.
Alternative P/E ratios utilized in scenarios
- The actual P/E ratios at the share buy date are based on actual non-GAAP EPS for Q2-2023 TTM.
- A modified average P/E ratio based on 29 quarter-end P/E ratios from Q4 2016 to Q3 2023 and current P/E ratio in Q4 2023. The average of these P/E ratios has been modified to exclude the three highest and three lowest P/E ratios to remove outliers that might otherwise distort the result.
- A modified low P/E ratio calculated using the same data set used for calculating the modified average P/E ratio, and calculated on a similar basis, with the three highest and lowest P/E ratios excluded.
- A median P/E ratio is calculated using the same data set used for calculating the modified average P/E ratio. Of course, the median is the same whether or not the three highest and lowest P/E ratios are excluded. In the case of Humana, I have chosen to use an assumed P/E ratio of 15.0 in place of the historical median of 20.32 (similar to the average). I have done this to provide an idea of the impact on returns of the multiple declining significantly below the present level and the historical average. The selected P/E multiple of 15.0 is also well below the sector median of 18.56 for PE Non-GAAP [FWD], per Seeking Premium metrics.
Reliability of EPS estimates (line 18)
Line 18 shows the range between high and low EPS estimates. The wider the range, the greater disagreement there is between the most optimistic and the most pessimistic analysts, which tends to suggest greater uncertainty in the estimates. There are fourteen analysts covering Humana through the end of 2023. In my experience, a range of 3.6 percentage points difference in EPS growth estimates among analysts is low, suggesting a reasonable degree of certainty, and thus reliability.
Projected Returns (lines 19 to 45)
Lines 25, 35 and 45 show, at the selected P/E ratio level of 15.0, Humana is indicated to return between 5.9% and 10.4% average per year through the end of 2025. The 5.9% return is based on analysts' low EPS estimates, and the 10.4% on their high EPS estimates. Indicated return based on consensus EPS estimates is 7.1%. Given the 15.0 P/E ratio used, these results are quite encouraging. Adopting the higher historical average P/E ratio of 19.85 results in indicative returns through end of 2025 ranging from 19.8% to 24.9%, with consensus 21.2%. Even at historical average low P/E ratio of 16.67, indicative returns range from 10.9% to 15.6%, with consensus 12.2%.
Checking Humana's "Equity Bucket"
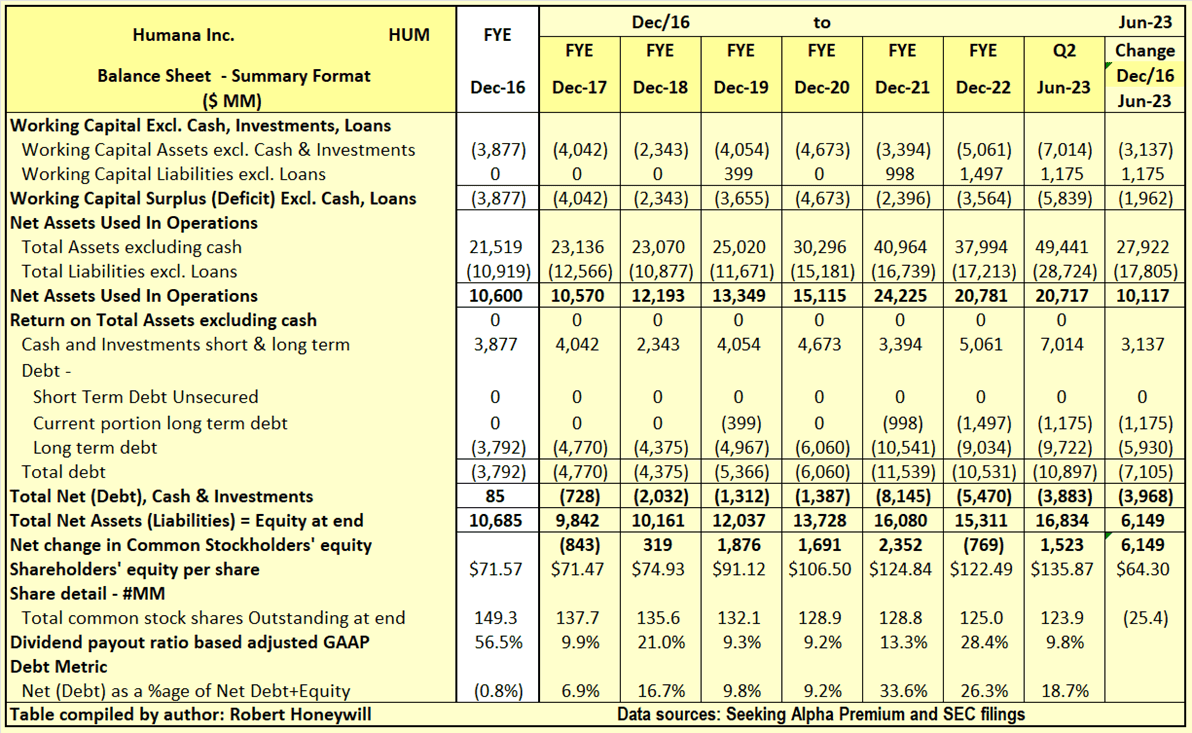
Table 3.1 Humana Balance Sheet - Summary Format
Seeking Alpha Premium and SEC filings
Over the 6.5 years end of 2016 to the end of Q2-2023, Humana has increased net assets used in operations by almost double, from $10,600 million to $20,717 million. The increase of $10,117 million was funded by an increase in net debt of $3,968 million and $6,149 million increase in shareholders' equity. A significant $8,329 million of the $10,117 million increase in net assets used in operations occurred in 2021, with the acquisition of the balance 60% interest in Kindred at Home, or KAH, the nation’s largest home health and hospice provider. This was offset in part in 2022, with the sale in August of 60% of the at home hospice arm of Kindred for $2,700 million. Net debt as a percentage of net debt plus equity is a modest 18.7% at end of Q2-2023, despite an increase following the KAH transaction. Outstanding shares decreased by 25.4 million from 149.3 million to 123.9 million, over the period, due to share repurchases partially offset by shares issued for stock compensation. The $6,149 million increase in shareholders' equity over the last 6.5 years is analyzed in Table 3.2 below.
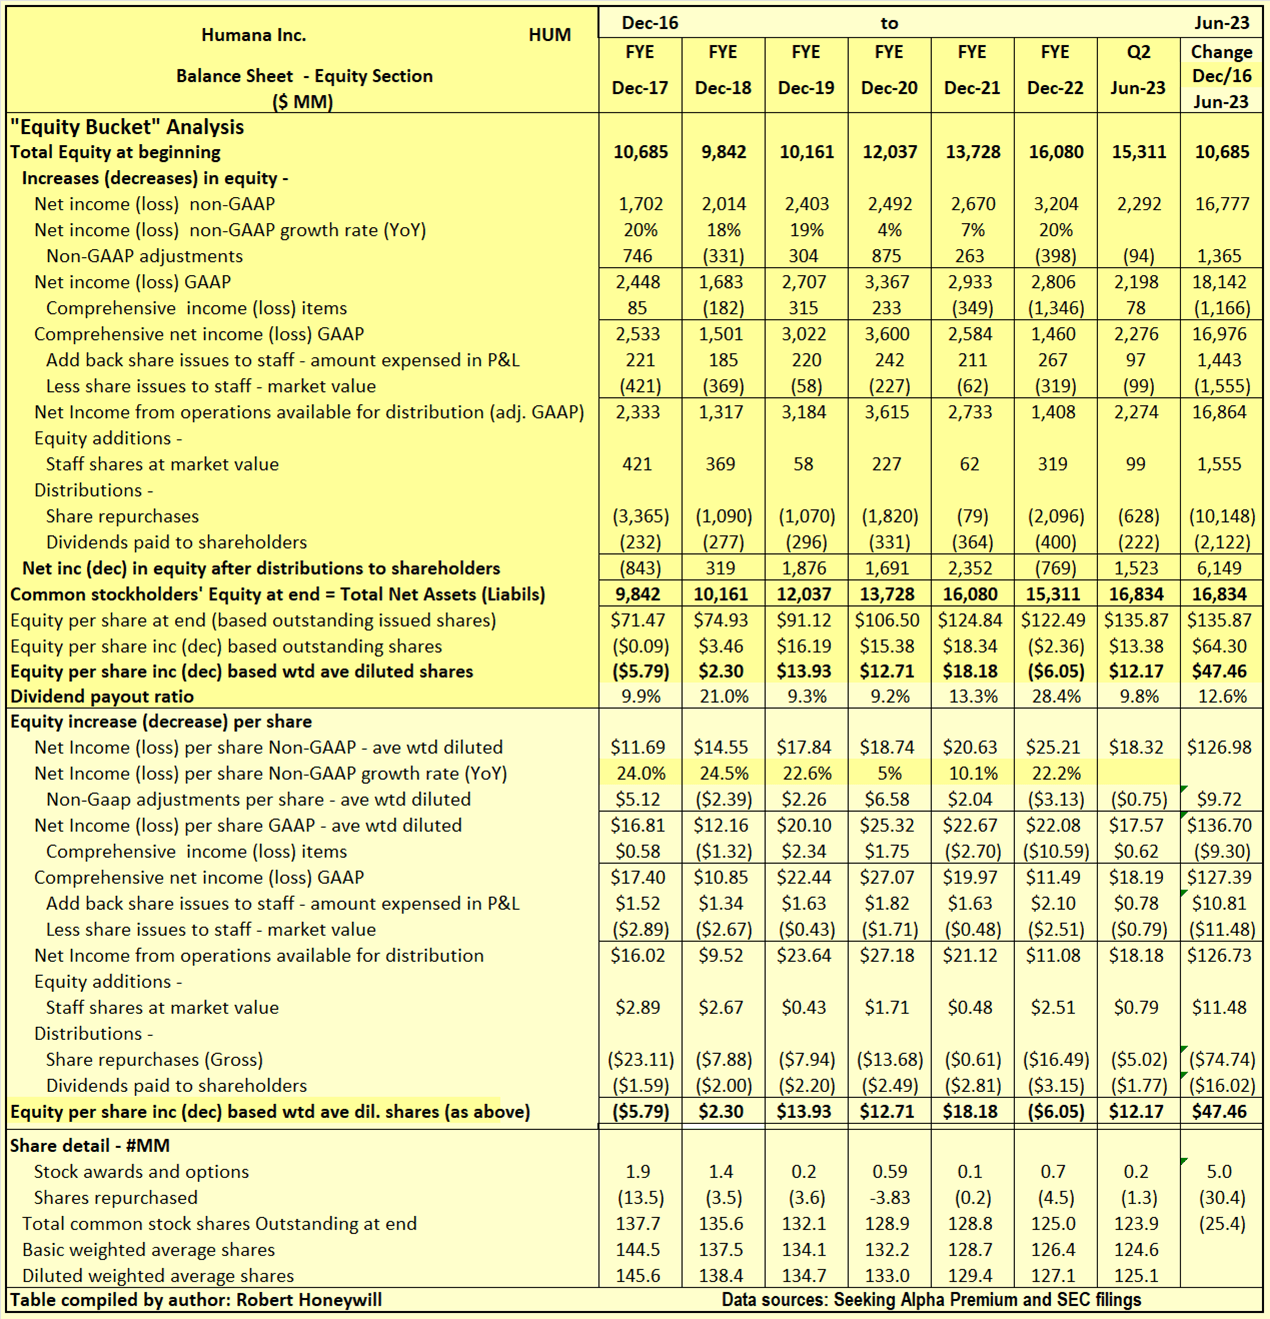
Table 3.2 Humana Balance Sheet - Equity Section
Seeking Alpha Premium and SEC filings
I often find companies report earnings that should flow into and increase shareholders' equity. But often the increase in shareholders' equity does not materialize. Also, there can be distributions out of equity that do not benefit shareholders. Hence, the term "leaky equity bucket." I do not see this happening with Humana.
Explanatory comments on Table 3.2 for the period end FY-2016 to end Q2-2023.
- Reported net income (non-GAAP) over the 6.5-year period totals to $16,777 million, equivalent to diluted net income per share of $126.98.
- Net income growth has been strong through the end of 2019, slowing in 2020 due to COVID-19 impact, but accelerating again in 2022 and into 2023. EPS growth averaged 17.81% per year from 2016 to the end of 2022 (see Table 1, line 24).
- Over the 6.5-year period, the non-GAAP net income excludes a significant $1,365 million of GAAP income (EPS effect $9.72) of items regarded as unusual or of a non-recurring nature in order to better show the underlying profitability of Humana. Such exclusions by companies are usually expense items. In the case of Humana the net effect is to reduce non-GAAP net income below GAAP net income.
- Other comprehensive income includes such things as foreign exchange translation adjustments in respect to buildings, plant, and other facilities located overseas and changes in valuation of assets in the pension fund - these are not passed through net income as they fluctuate without affecting operations and can easily reverse in a following period. Nevertheless, they do impact the value of shareholders' equity at any point in time. For Humana, these items amounted to a net loss of $1,166 million (EPS effect $9.30) over the 6.5-year period.
- Amount taken up in equity to account for shares issued to staff over the 6.5 years is $1,443 million. This compares to an estimated market value of $1,555 million at the time of issue of these shares. The estimated market value of these shares is greater by $112 million (EPS effect $0.67) than allowed for in arriving at non-GAAP EPS. This is not material in the context of non-GAAP earnings of $16,777 million.
- By the time we take the above-mentioned items into account, we find, over the 6.5-year period, the reported non-GAAP EPS of $16,777 million has increased slightly to $16,864 million, added to funds from operations available for distribution to shareholders.
- Dividends of $2,122 million, and share repurchases of $10,148 million, together totaled $12,270 million. These were adequately covered by $16,864 million generated from operations, resulting in an increase of $4,594 million in equity
- This net $4,594 million increase in equity from operations, together with the $1,555 million capital raised through share issues to staff, resulted in the $6,149 million net increase in shareholders' funds per Table 3.1 above.
Humana: Summary and Conclusions
The results for Humana, past present and projected, are positive. Indicative returns for buying now and holding through the end of 2023 are in the double digit range. Even should the P/E multiple decline from the current level to 15.0, well below the historical average of 19.85, positive returns are still indicated for buying now and holding through end of 2025. Dividend yield at 0.66% is low, but based on historical growth, expected future dividend growth rates of ~12.5% appear reasonable. Humana has a strong balance sheet as evidenced by analysis above. Taking all the foregoing into account, Humana is upgraded from Hold to Buy.
For further details see:
Humana: Upgrade To Buy