HYGV - HYGV: Finds Alpha In Junk Bonds But Still Unattractive
Summary
- HYGV is a “junk bond" ETF, namely a high-yield corporate bond fund.
- It invests only in issuers selected based on value characteristics.
- This strategy has effectively found some alpha in the junk bond universe.
- However, share price and distribution history is not attractive at all.
Strategy and portfolio
The FlexShares High Yield Value-Scored Bond Index Fund ( HYGV ) is a high-yield bond fund with a 12-month trailing distribution rate of 7.58% and a net expense ratio of 0.37%. It pays monthly distributions. It was launched on 07/17/2018 and tracks the Northern Trust High Yield Value-Scored US Corporate Bond Index.
As described by FlexShares , the underlying index selects US-dollar denominated bonds of companies with favorable fundamental qualities, market valuations and liquidity, based on proprietary scoring models. Eligible securities are below investment grade, but not in default, and include issues with a credit rating of BBB or below by Moody’s and S&P. They must be listed in the U.S., but issuers may be based elsewhere.
Currently, the portfolio has a weighted average maturity of 5.79 years, a weighted average effective duration of 4.04 years and a weighted average yield-to-worst of 10.33%. As of writing, over 84% of the portfolio has been issued by U.S. companies. The next table lists weights for every rating in percentage of asset value.
| S&P |
| Moody's |
| Fitch |
| BBB |
| 1.58% |
| Baa |
| 1.49% |
| A |
| 0.01% |
| BB |
| 30.46% |
| Ba |
| 22.74% |
| BBB |
| 1.56% |
| B |
| 44.53% |
| B |
| 50.04% |
| BB |
| 24.43% |
| CCC |
| 19.87% |
| Caa |
| 21.67% |
| B |
| 8.82% |
| CC |
| 0.14% |
| Ca |
| 1.04% |
| CCC |
| 1.61% |
The sector breakdown of issuers shows that the fund is overweight in industrials (about 36%).
Sector breakdown (Chart: author; data: FlexShares)
The top 10 holdings, listed below, represent less than 7% of the portfolio.
| Name |
| Weight |
| CASH |
| 0.86% |
| NGL ENERGY OPERATING LLC, NGL ENERGY FINANCE CORP |
| 0.80% |
| ATHENAHEALTH GROUP INC CALLABLE NOTES FIXED 6.5% |
| 0.76% |
| CONDOR MERGER SUB INC CALLABLE NOTES FIXED 7.375% |
| 0.70% |
| DISH DBS CORP CALLABLE NOTES FIXED 7.75% |
| 0.70% |
| CLOUD SOFTWARE GROUP HOLDINGS INC CALLABLE NOTES |
| 0.61% |
| CSC HOLDINGS LLC CALLABLE NOTES FIXED 5.75% |
| 0.56% |
| MPT OPERATING PARTNERSHIP LP / MPT FINANCE CORP |
| 0.50% |
| NEPTUNE BIDCO US INC CALLABLE NOTES FIXED 9.29% |
| 0.48% |
| AMERICAN AIRLINES INC CALLABLE NOTES FIXED 11.75% |
| 0.48% |
Performance
The next table compares HYGV since inception in 2018 with a junk bond benchmark: the iShares iBoxx $ High Yield Corporate Bond ETF ( HYG ). Distributions are reinvested.
| Total Return |
| Annual Return |
| Drawdown |
| Sharpe ratio |
| Volatility |
| HYGV |
| 12.33% |
| 2.64% |
| -23.47% |
| 0.14 |
| 11.31% |
| HYG |
| 8.41% |
| 1.83% |
| -22.03% |
| 0.07 |
| 9.90% |
HYGV beats HYG by 81 bps in annualized return, but shows a slightly higher risk measured in drawdown and standard deviation of monthly returns (volatility). However, HYGV still outperforms in risk-adjusted performance (Sharpe ratio). It is not spectacular, but the strategy has reached its goal: finding alpha in the junk bond universe.
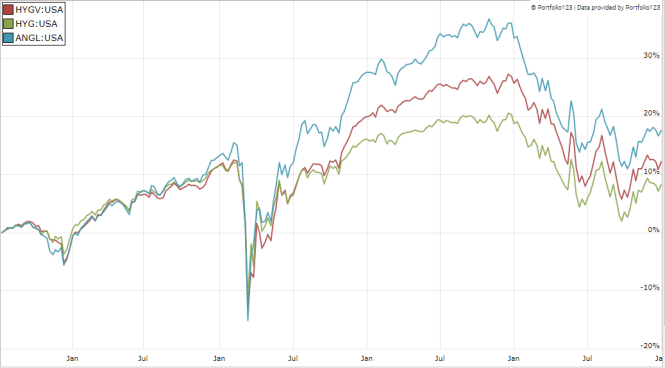
The next chart compares HYGV and HYG with another strategy ETF in high-yield corporate bonds: the VanEck Vectors Fallen Angel High Yield Bond ETF ( ANGL ).
The Fallen Angels bond ETF has been the best performer since July 2018. Its holdings are bonds that were initially rated as investment grade, and fell to junk status because of issuers’ financial troubles. The idea behind this strategy is that fallen angels have a lower probability to default than other junk bond issuers.
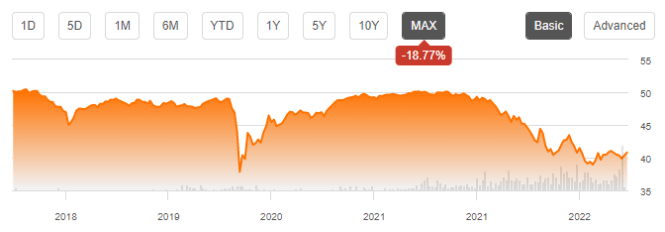
The annualized return since inception of HYGV, reinvesting distributions, is below the distribution rate. This is a red flag pointing to capital decay. It is confirmed by HYGV share price history: it has lost over 18% since inception.
HYGV share price, without dividends (TradingView on Seeking Alpha )
Moreover, the annual sum of distributions per share went down from $3.86 in 2019 to $3.04 in 2022, based on payable dates. For shareholders, it is an income reduction of 21%.
This decay in capital and income is not a management issue: it is a problem with most high-yield funds (there are rare exceptions). HYGV can be useful for swing trading or tactical allocation, but history shows it may be harmful to an investor’s capital and income stream in the long term. Once again, this is true for most high-yield funds: ETFs and also CEFs.
How to manage capital decay in high yield securities
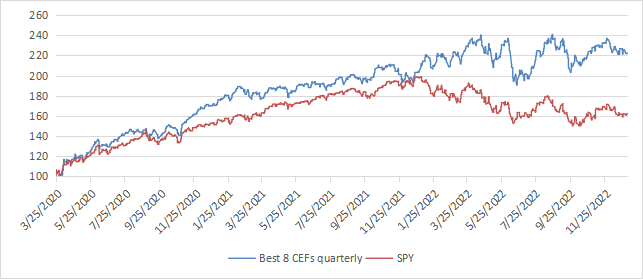
Capital and income decay is also an issue in closed-end funds, but it is possible to mitigate it thanks to specific anomalies and rotational strategies. I designed a 5-factor ranking system in 2016, and monitored its performance during several years. I started publishing the eight best ranked CEFs in Quantitative Risk & Value (QRV) after the March 2020 meltdown. The list is updated every week. Its average dividend yield varies around 7%. It's not a model portfolio: trading the list every week is too costly in spreads and slippage. Its purpose is helping investors find funds with a good entry point. In the table and chart below, I give the hypothetical example of starting a portfolio on 3/25/2020 with my initial “Best 8 Ranked CEFs” list and updating it every 3 months since then, ignoring intermediate updates. Return is calculated using closing prices, with holdings in equal weights and reinvesting dividends at the beginning of every 3-month period.
| since 3/25/2020 |
| Total Return |
| Annual Return |
| Drawdown |
| Sharpe ratio |
| Volatility |
| Best 8 CEFs quarterly |
| 122.14% |
| 33.23% |
| -20.60% |
| 1.43 |
| 20.43% |
| SPY |
| 62.17% |
| 18.98% |
| -24.50% |
| 0.87 |
| 19.69% |
This simulation is not a real portfolio and not a guarantee of future return (Chart: author; data: Portfolio123)
The “Best 8” model shows a positive total return in 2022, about 8%. Of course, past performance (real or simulated) is not representative of future return. It is unlikely to perform as well in the near future as since March 2020. The 2020 meltdown and 2022 volatility resulted in price dislocations and exceptional opportunities in the CEF universe. However, I think a time-tested rotational strategy in CEFs has a much better chance to protect both capital and income stream against erosion and inflation than a high-yield passive investment.
For further details see:
HYGV: Finds Alpha In Junk Bonds, But Still Unattractive