HYGV - HYGV: Opportunistic Exposure To Attractive Credit As Equities Remain Expensive
2023-10-23 17:12:31 ET
Summary
- 2023 saw a severe bear market and low valuations in the bond market, creating an opportunity for bond allocation in portfolios.
- The bond market experienced sharp declines while equities reached all-time highs, highlighting the difference in reaction to interest rate increases.
- The HYGV smart beta ETF offers credit exposure with a 9.3% yield, making it an attractive option compared to the 4% earnings yield of US equities.
We tend to cover equities, which offer many interesting opportunities as an asset class. However, 2023 was characterized by one of the most severe bear markets and the lowest valuations. The only problem is that it happened in the bond market, and not with equities. In our opinion, this created an interesting opportunity to get an opportunistic allocation on bonds as part of a more general portfolio strategy.
We also believe that FlexShares® High Yield Value-Scored Bond Index Fund ETF (HYGV) offers a great way to get this exposure at very favorable terms.
The macro view: bonds vs equities
In the last year, we have experienced one of the fastest and most aggressive increases in interest rates in decades. Higher-than-expected inflation forced the FED to raise and maintain a strong hawkish policy that deeply affected the markets. However, the reaction was very different across the bond and the equities markets, with the former experiencing very sharp declines, while the latter is close to its all-time highs.
S&P Treasury Bond Index (S&P )
This is how the S&P U.S. Treasury Bond Current 10-Year Index performed over the past 3 years. As yields are negatively correlated with bond prices, the investors who were exposed to low yields in 2020-2021 experienced a 24% drop in the index price.
On the other hand, the S&P 500 performance over the past 3 years accumulated a positive performance of around 23%. An overall outperformance close to 50%.
But it is also important to look at yields. Right now the treasury yield curve offers a perspective on what kind of yield investors can lock in for different periods of time.
US Treasury Yield Curve (ustreasuryyieldcurve.com)
As we can notice, it is oddly shaped, as the 20Y and 30Y maturities are much higher than the 2Y-10Y ranges. Still, virtually any maturity trades above 4.8% of annualized yield. The 20Y treasury even reaches 5.3%.
Since US government bonds are a risk-free asset by definition, we expect a premium on the yield of virtually any other asset class. Equities in particular should bear the so-called "Equity Risk Premium" (ERP), that is the excess yield that investors should earn over treasuries.
However, the S&P 500 currently has a P/E ratio of 24, from which we can compute the earnings yield. That is the expected return from the earnings of the components of the index. The current yield is 1/24 = 4.2%. While this methodology excludes many aspects such as EPS growth, valuation multiples expansion, and other aspects that affect performance over time, this negative spread of around 1% between bonds and equities is still of particular concern to us.
This is why we believe that with the structure of the current market positioning, even investors that historically had 100% equities allocation, should now start to give a chance to some bonds exposure in the portfolio.
HYGV: An opportunistic way to gain credit exposure
And this is where HYGV comes into play. This smart beta ETF is replicating an actively-picked index that covers sub-investment grade bonds in the market. They have a highly diversified positioning in senior bonds that usually pay a generous fixed coupon since they are below IG. Let's take a look at some of the fund's statistics:
| Price |
| $38.5 |
| NAV per share |
| $38.5 |
| Distribution Yield |
| 9.22% |
| N. of holdings |
| 906 |
| Average maturity |
| 5.3 years |
This data is important to understand key factors: NAV discount, yield, and diversification/maturity risks. In this case, we notice that we are not getting a great deal in terms of discount to NAV, as it trades at perfectly par to NAV per share. It makes sense as holdings are reported at fair value rather than at cost like other funds.
Indeed, the market has consistently priced the fund very close to its reported daily NAV. It is a smart beta ETF and not an obscure CEF, so we can be comfortable buying at par.
Then we focus on yield. A 9.3% yield seems very juicy, especially if compared to the 4% earnings yield currently offered by US equities. This is the main reason behind our decision to include this ETF in the portfolio allocation. The chance to get a yield of almost twice the one offered by equities, by sitting above equities within the capital structure.
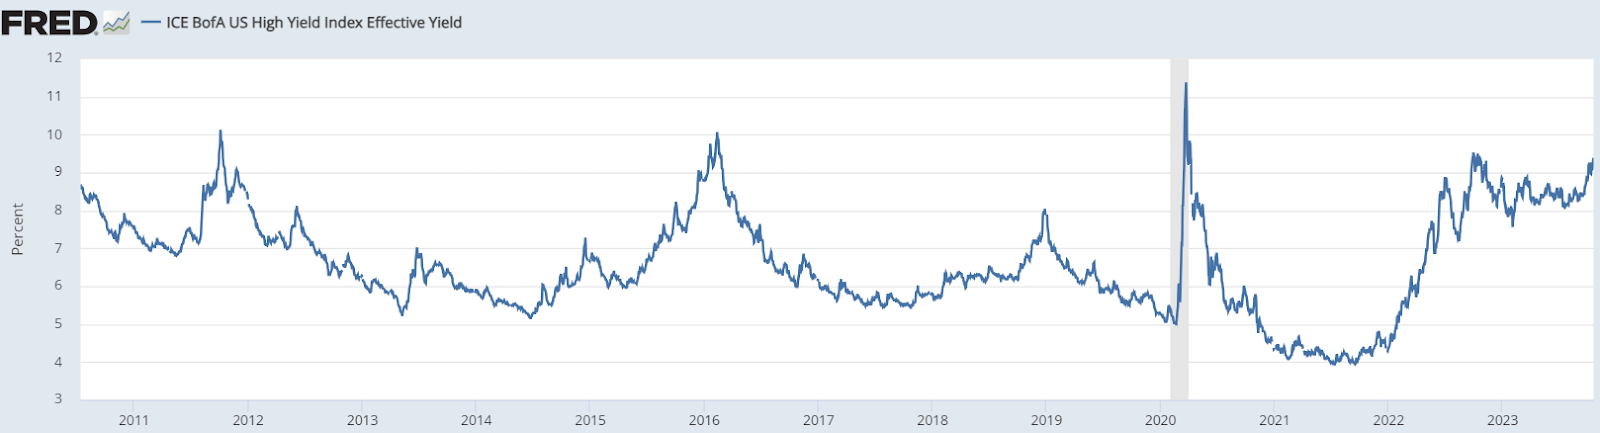
If we compare the current high-yield bonds yield to the historical levels of the last 12 years, we notice that we are at multi-year highs. With the exception of the great financial crisis, yields historically have mostly been lower than the current levels. So on top of the earnings from the dividends and distributions, we may also expect significant gains from increases in prices due to decreases in yield.
A closer look at the portfolio: assets, diversification, and duration
Since buying funds often means not having direct control over the final assets that are purchased, we want to understand better the composition of this index. We extracted data from a CSV file that contains all the holdings as of October 20. We will focus on two main aspects by analyzing data at the asset level: diversification, and duration. We want to understand the exposure that HYGV may have to excessive concentration, and also for how long we can benefit from the current yield.
HYGV - Weight Components Distribution (Data from HYGV Website)
This chart represents all the different 906 holdings, ordered by weight in the fund. As we can see, few holdings make up to 1% with all the others well below the 0.6% level. This is definitely encouraging as it means we have no particular exposure to idiosyncratic risks coming from the bankruptcies of the issuers.
Distribution of maturities by weight (Data from HYGV Website)
On the other hand, this chart shows the maturities in years and the associated weight of the fund that matures on those terms. As we can notice, there is a concentration of maturities around 3-6 years. If we adjust the maturities for the coupon received before we can derive the duration, which can be seen as the weighted average (by term) of all cash flows. HYGV has a duration of 3.7 years.
So we understand two things from this analysis: (1) we are highly diversified, and (2) we are locking in a yield that should be around 9% for at least 3.7 years.
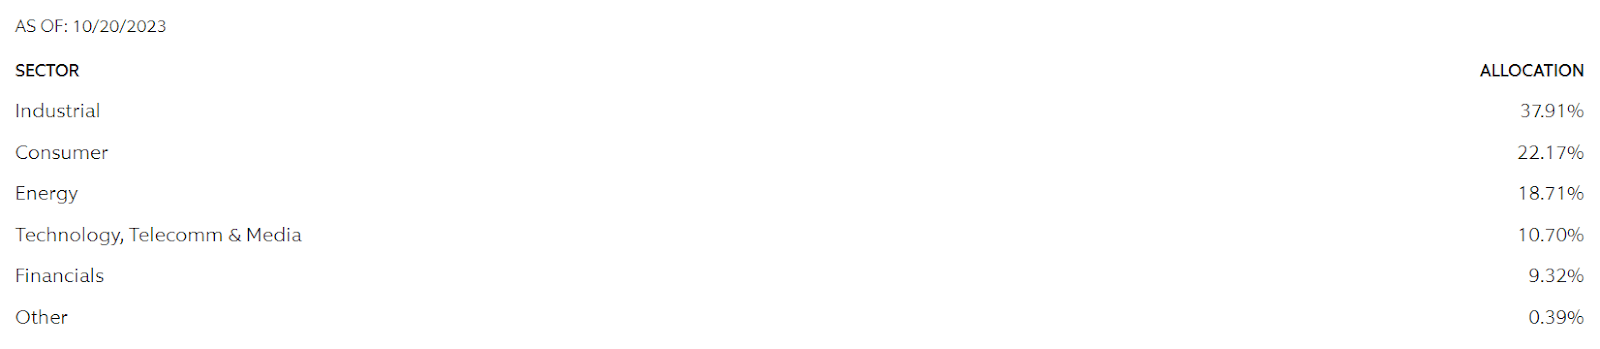
There are also some risks. In particular, the fund seems excessively exposed to certain sectors. So while there is no issuer-related idiosyncratic risk, there is some systemic risk around general sectors. HYGV has a 38% concentration in industrial companies because the majority of these high-yield bonds are issued in this sector.
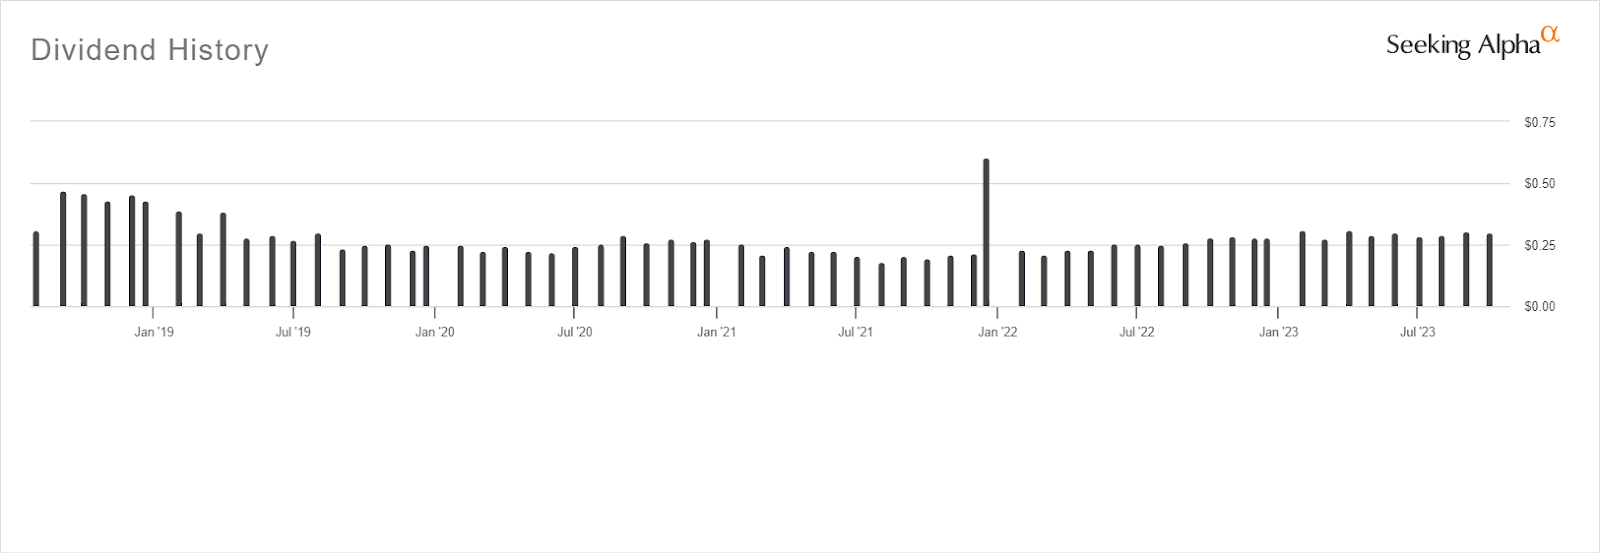
Last but not least, HYGV has a very good track record of timely dividend payments throughout its history. The fund has paid consistently with the yields it is earning on its assets, and we expect this to serve as a good precedent looking into future dividends.
Conclusion
We believe that equities as an asset class are particularly expensive, and investors should start to opportunistically look at some exposure to bonds. Indeed, we have seen one of the worst bond bear markets in history, and we can now lock in very attractive yields that are almost twice that of equities. HYGV looks particularly interesting as there is good diversification, attractive yield, and reasonable duration.
For further details see:
HYGV: Opportunistic Exposure To Attractive Credit As Equities Remain Expensive