HY - Hyster-Yale Materials: Rally Fully Extended Economic Value Absent At Current Numbers
2023-09-27 03:46:52 ET
Summary
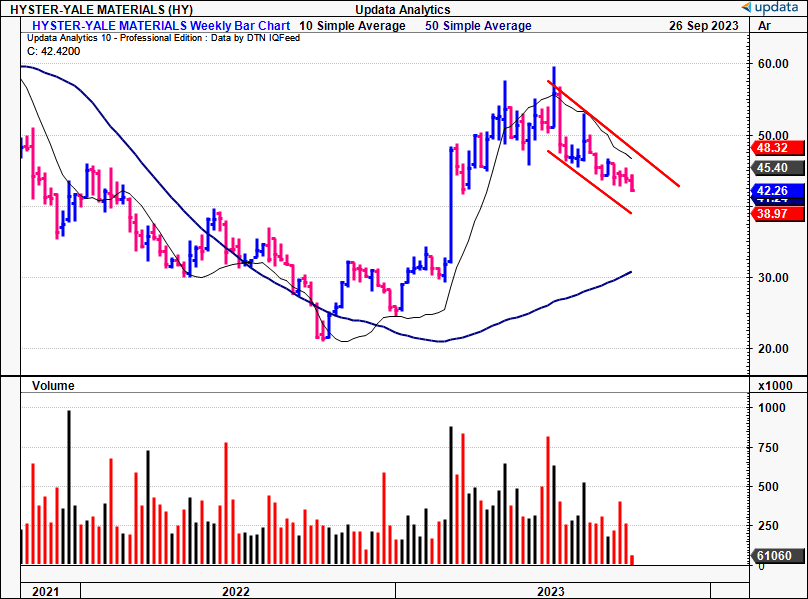
- Hyster-Yale Materials Handling had an impressive run on the chart across FY'23, but has rolled over in recent weeks.
- HY has a robust competitive position with its global brand, but high capital requirements and low operating margins hinder its economic value.
- Despite strong Q2 numbers, HY's return on capital invested is low, leaving little room for FCF growth or significant business expansion.
Investment briefing
Those companies in the industrial machinery business have potential consumer advantages and cost differentiation benefits that enable them to increase prices ahead of inflation. Upon rigorous examination, lift truck (forklift) manufacturer Hyster-Yale Materials Handling, Inc. ( HY ) does not appear to enjoy these advantages. The company enjoys a robust competitive position, given its global brand, but the capital requirements HY must employ to maintain this position are high, without the operating margins or returns on capital to show for it.
As mentioned, HY is a renowned manufacturer of lift trucks with a global footprint. It offers a diverse range of lift trucks, attachments, and aftermarket parts under the Hyster and Yale brands. It also owns Bolzoni , a company that produces attachments, forks, and lift tables sold under various brand names. Additionally, HY operates a venture firm known as Nuvera Fuel Cells , which is an alternative-power technology company that is innovating and selling both hydrogen fuel cell stacks and engines.
After an impressive run across FY'23, it was indeed worth investigating HY's economic value and investment prospects moving forward. This analysis will cover all of these factors and more, illustrating why I believe it to be a hold, with the view of sub-par rates on capital invested, high reinvestment needs moving forward, balanced by an increasing turnover of inventories to grow sales. Net-net, I rate HY stock a hold.
Figure 1.
Critical investment facts underpinning buy thesis
1. Latest numbers—backlog work through, unit sales up low 20s'
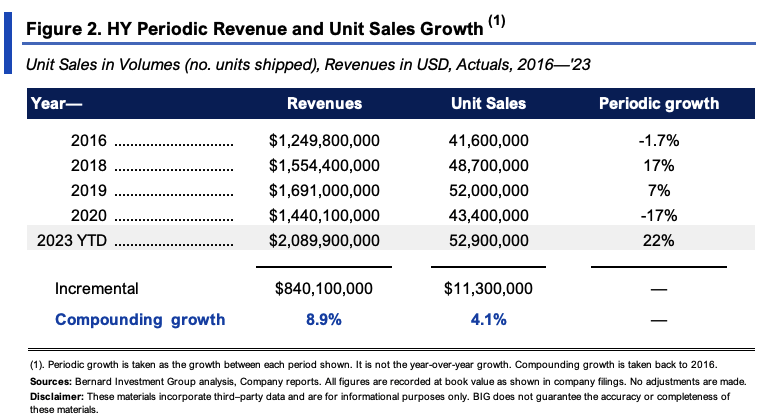
HY put up Q2 sales of $1.1Bn, growing 22% YoY, on operating income of ~$60mm and earnings of $2.21 per share. Growth was underscored by a 23% YoY increase in shipped orders to 27,700 units—well above the 10% rate on shipments in Q2 last year. A longitudinal view of the company's sales growth and unit sales is seen in Figure 2. Since 2016, it has compounded sales at a c.9% rate, with unit volumes growing at a 4.1% geometric rate. Since 2020, unit sales have growth by 22%.
Despite the order rates in Q2, its backlog is lower YoY, and forward bookings are down ~9% from Q3 this time last year. It left the quarter with 21,300 units booked and a backlog of 92,800. This is somewhat of a positive in my view. It suggests the company is working through inventories and getting unit sales printed onto its books.
Backlog was down 600bps YoY, and has tightened by ~20% since its peak in FY'22. Further, average sales price ("ASP") on its backlog was up 23% YoY and up ~5% from Q1. So backlog is tighter, but the value of orders is higher, coming to $3.6Bn. This is a critical fact because HY had a number of orders booked at a lower margin from FY'21 and FY'22, so it looks to have worked through these lower-margin orders and the production schedule is full. The backlog of $3.6Bn is around ~1 year's worth of sales revenue at its current run rate.
As to the divisional breakdown in Q2, the following takeouts are relevant:
- Lift trucks pulled in ~$1Bn in quarterly sales on a 6% operating margin. This is above what the company has clipped in previous quarters. The gain in operating income was a result of the higher margin/higher ASP orders mentioned earlier (including both trucks and parts).
- Its Bolzoni arm did $96.6mm of business in the quarter on operating profit of $5.4mm, up ~60% YoY. For the YTD Bolzoni brought in $195.2mm in sales, up from $181mm in H1 last year.
- Its Nuvera business clipped ~$1mm in revenues and its operating loss widened to ~$9mm. Critically, its Nuvera arm is where it is innovating the most. It is working on a 125kW fuel cell engine that it can place in its larger units (into top-loaders and container handlers). HY reports it is also developing this engine to be worked into a bus application in China, and a marine application in the Netherlands. An example of a bus application is seen in the exhibit below.
Figure 2a.
Source: HY Q2 Investor Presentation
2. Economic performance + economic value
Deeper analysis of HY's business characteristics reveals the mountain still left to climb before it starts exhibiting its economic value. Whilst the sales and marginal growth from above is commendable, as a function of assets required to generate them, the picture is less rosy.
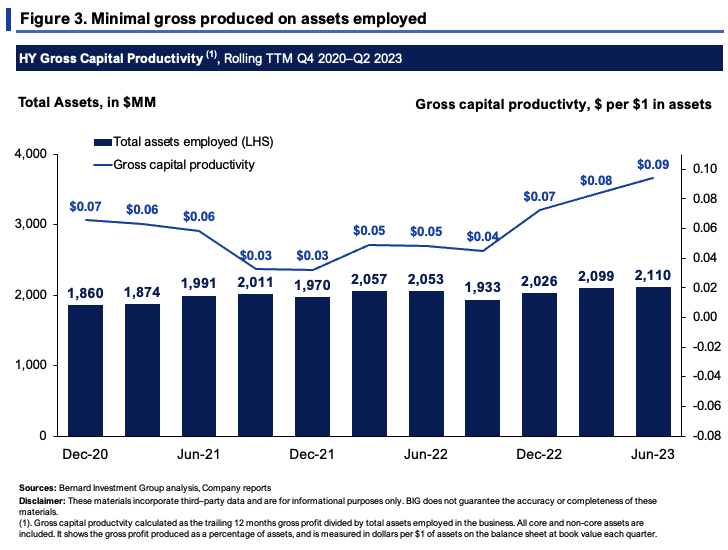
For starters, the company is only rotating back ~$0.09 in gross profit per $1 of assets employed into the business. Figure 3 shows this on a rolling TTM basis. Whilst total asset value has increased to $2.1Bn off $1.86Bn in 2020, these investments haven't added a corresponding rate of gross on assets employed. With just $0.09 on the dollar in gross, it implies just 9% gross return on assets, leaving little headroom for income down the P&L or cash flows.
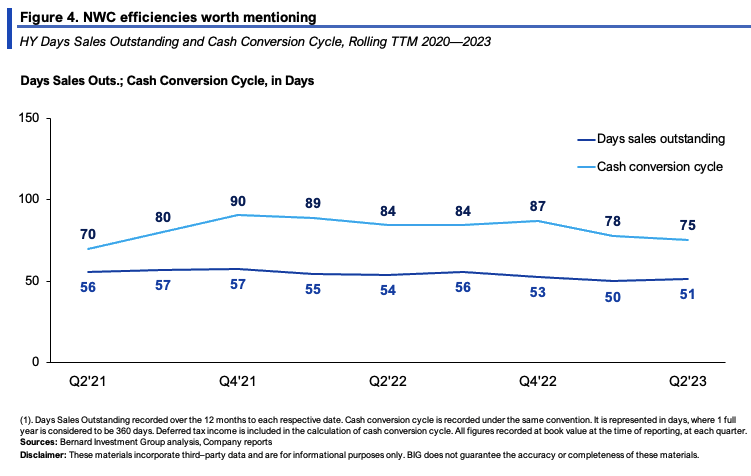
Most of HY's assets are tied up in NWC, in inventory balance and the receivables account. To this point, it has sped up the pace of cash collections, now recycling each $1 investment in NWC back to cash in 75 days, down from 84 days last year (Figure 4). It could turn over its NWC around 4.8x per year at this rate, up from 4.3x in Q2 FY'22.
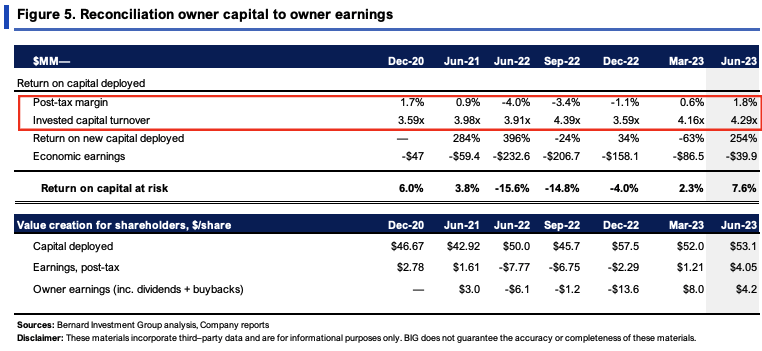
The economic value HY is creating for shareholders is less attractive than its NWC efficiencies. Consider that:
- It had invested $53.10 per share in business capital in Q2, up from $50/share in 2021. From 2020–date, it has invested another $6.43/share towards growing the business.
- The $53.10/share produced $4.05/share in post-tax earnings in Q2, corresponding to a 7.6% return on investment. The $6.34/share investment added another $1.25 per share in NOPAT, otherwise 19% incremental return on capital. All dividends paid up, it spun off $4.20/share in cash to its owners.
- Given the high inventory/NWC numbers listed earlier, it's positive to see HY's sales as a ratio of business capital higher at ~4.3x. This has been tracking higher since 2020 as well, but on razor-thin after-tax margins of 1.8%. This tells me it enjoys production advantages and is employing a cost leadership strategy, pricing its offerings below industry peers to maintain its competitive position.
This squares off with the economics outlined thus far, in (i) tight margins, (ii) high growth in unit sales [plus inventory/receivables turnover], and (iii) reinvesting earnings at sub-par rates of return.
This is critical information to gauge what HY can generate in earnings and FCF going forward.
In fact we see further evidence of this in Figure 6, which shows HY's value drivers for the last 3 years. Critically, for every $1 in new sales, it has reduced fixed asset intensity by $0.1, but a dollar of sales growth has required $0.14 of investment in NWC. Going forward, at this steady-state, if HY was to grow at an average 4.6% the coming 2 years—as per consensus forecasts—this would call for an additional $53.5mm investment in NWC per quarter, ~$212mm annualized.
HY's big push is to achieve a 7% operating margin on 140,000 unit sales, as confirmed in its Q2 notes . At HY's forecast ASP of $31,924 per unit, this calls for sales of $4.47Bn, or 13.7% sales growth from FY'23 estimates. Assuming a 2% fixed capital rate, and the 14% NWC rate, this would call for $76mm–$128mm in quarterly capital investment, otherwise 30% reinvestment of earnings each quarter.
BIG Insights
3. Technical considerations
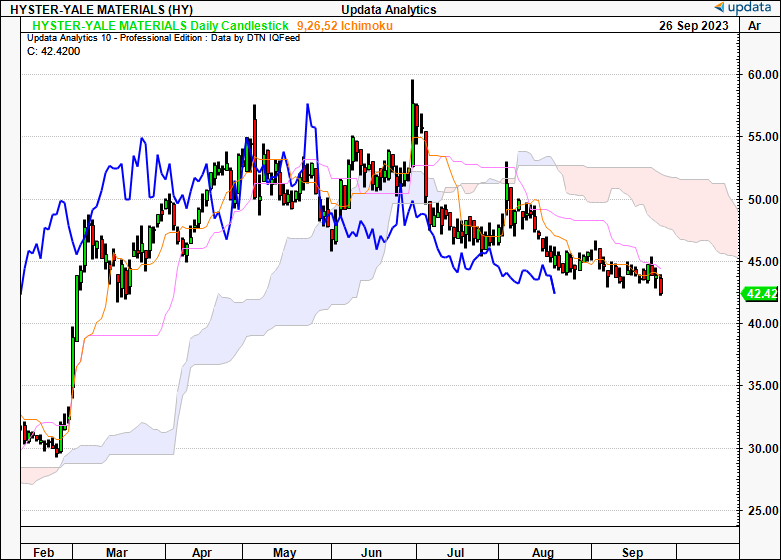
Market-generated data isn't supportive of a bullish viewpoint either. In Figure 7, the daily cloud chart is shown. It looks to the coming weeks. Both price and lagging lines are beneath the cloud, having crossed in June with no recovery. The trend is tracking the base of the cloud in symbiotic fashion. To me, this supports a neutral view over the coming weeks.
Figure 7.
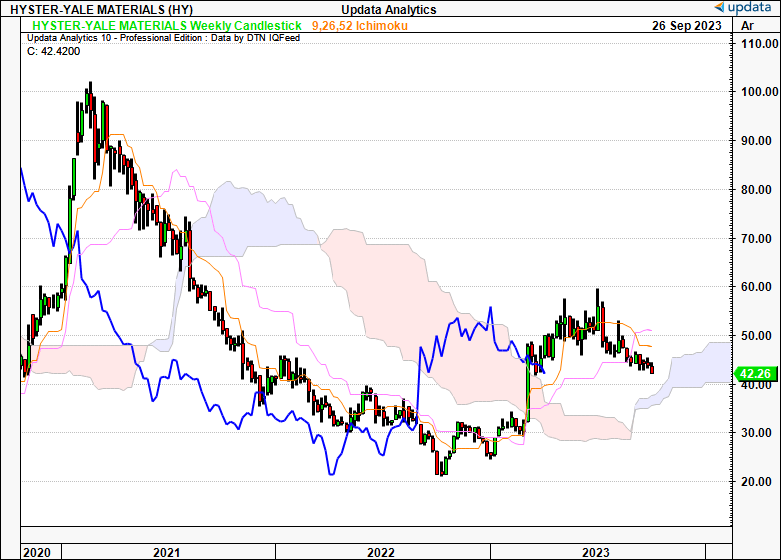
Figure 8 shows the weekly chart, looking to the coming months. Price structure has begun to break down on this frame as well, even though both price and lagging lines are positioned above the cloud. HY is looking to test the cloud top at this current direction, and the lagging line is conforming to the superior portion of the cloud. If it continues at this direction, and gradient of downtrend, it could cross at $38 by November. This is also a neutral view.
Figure 8.
We see more objective evidence of a break further to the downside in Figure 9, showing the daily point and figure studies at a 0.5x2 box reversal. The stock has broken a key support line and taken out the $45 and $41 targets in recent weeks. We have a further downside target to $36.50, and a break lower could see this as a valid objective to look towards. Again this supports a neutral posture.
Figure 9.
Data: Updata
Valuation and conclusion
The stock sells cheaply at 10x forward earnings and 9.8x forward EBIT, 41% and 39% discounts to the sector, respectively. One could argue there's value at these compressed multiples. One might also argue there's a reason that investors are paying no serious price for the company.
To understand further, thinking in first principles, consider that:
(i). This is a capital-intensive business that produces an earnings rate of <10% on the capital required to run the business. This is not economically valuable in my eyes.
(ii). Margins are thin despite the high capital turnover, and investors are realizing a series of economic losses. At the current state of affairs, this looks to continue moving forward.
(iii). Market-generated data is pointing to a lack of upside stimulus.
Moreover, compounding the firm's intrinsic value at the function of its ROIC and reinvestment rates moving forward implies an intrinsic value of $569mm by FY'24, around $33/share. The market looks to have been an accurate judge of HY's intrinsic value, as seen in Figure 10. This is further support of a neutral view.
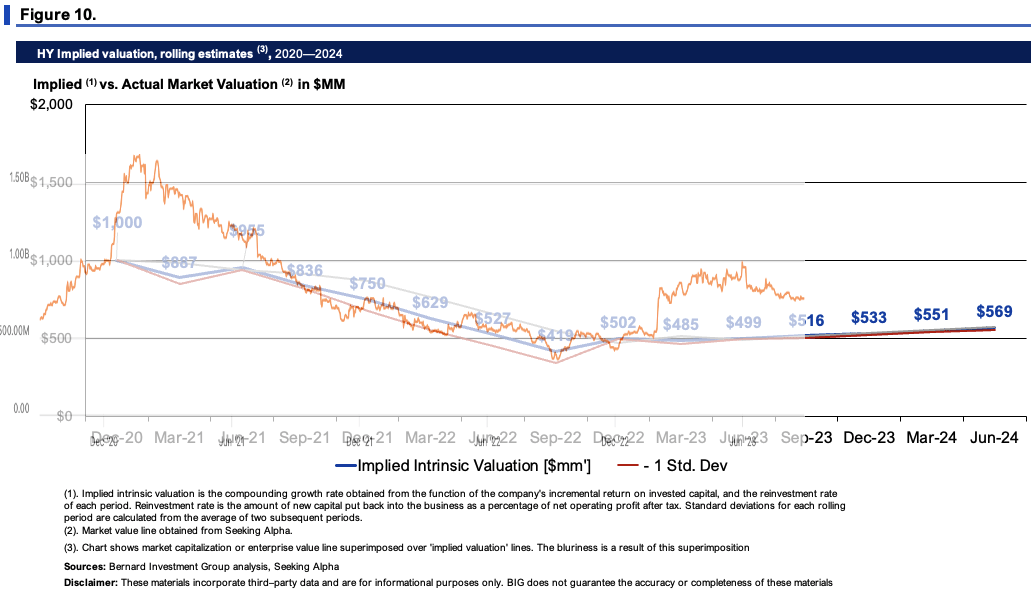
In short, HY is gaining traction in unit volumes and product revenues. It came in with reasonably strong Q2 numbers, laying the platform for momentum into H2 FY'22. But this is a capital-intensive business with heavy reinvestment requirements to fulfil its growth targets. That would be fine, except the company produces single-digit post-tax margins on each $1 of invested capital and the bulk of its capital allocation is towards NWC. Consequently, its return on capital invested is low and doesn't leave much room for FCF growth or outsized business growth for that matter. The key upside risk here is at the margin. HY is eyeing 7% operating margins at some point in the future, and this would be a nice thing to see. My only concern is that it would take a heavy redistribution of investment to achieve this, compressing the earnings rate on capital invested. Net-net, I rate HY a hold for the reasons discussed here today.
For further details see:
Hyster-Yale Materials: Rally Fully Extended, Economic Value Absent At Current Numbers