ICAP - ICAP Vs. SPYV: Comparing Large-Cap Value ETFs
2023-06-19 07:30:00 ET
Summary
- The InfraCap Equity Income Fund ETF ranks near the bottom of Seeking Alpha's 102 Large-Cap Value ETFs, while the SPDR Portfolio S&P 500 Value ETF ranks at the top.
- This article compares the two ETFs to help investors decide if the Seeking Alpha rankings make sense.
- ICAP's large exposure to Financials and Real Estate sectors has hurt its performance since the March banking crisis. That, plus 171bps fee earns ICAP a Sell rating.
(This article was co-produced with Hoya Capital Real Estate )
Introduction
Seeking Alpha has 102 ETFs listed as Large-Cap Value. The InfraCap Equity Income Fund ETF ( ICAP ) ranks near the bottom of that asset sub-class. To try to determine why, I compared it against the top ranked one, the SPDR Portfolio S&P 500 Value ETF ( SPYV ).
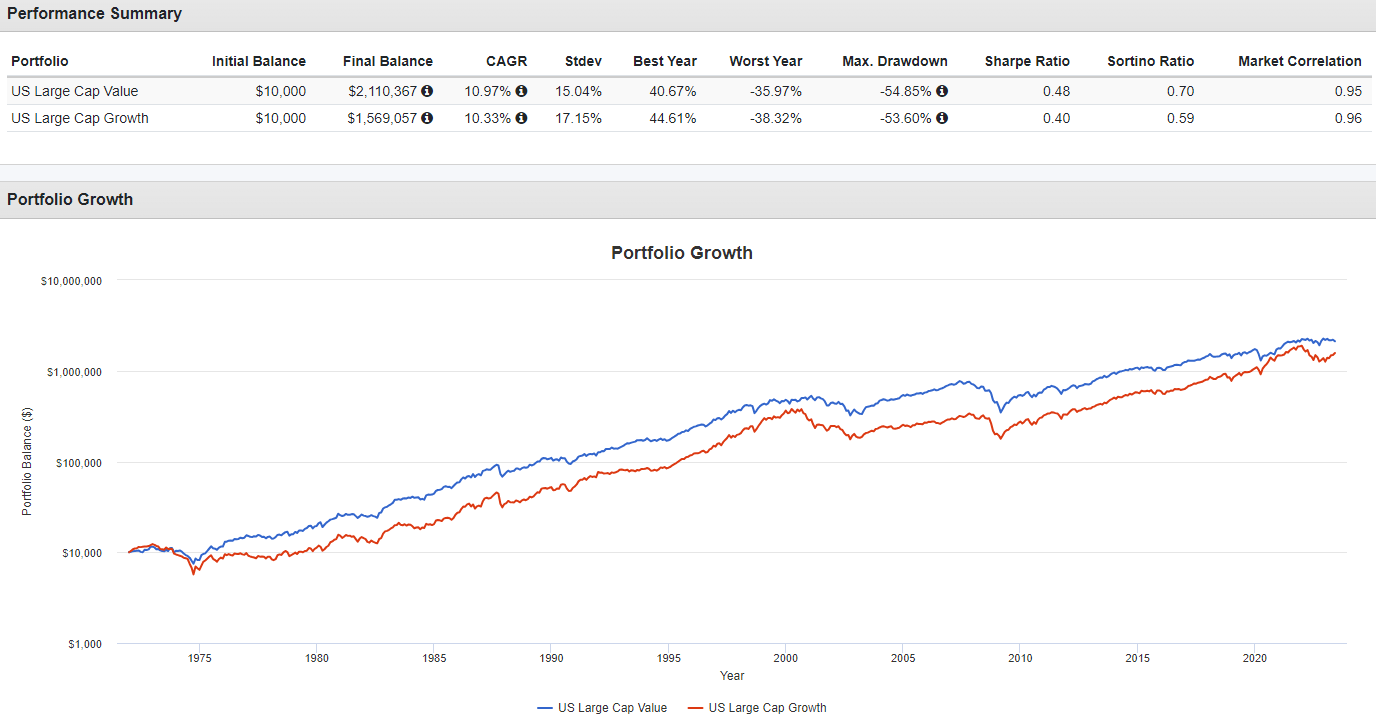
Before I start, here is how this asset sub-class has performed compared to Large-Cap Growth stocks.
Over the past 50+ years, LCV stocks pulled off the rate double-feat: higher CAGR and lower StdDev. The return leader between Value and Growth has been in rotation mode recently, as shown by the next set of data.
SPDR Portfolio S&P 500 Value ETF review
This is how Seeking Alpha describes the top ranked LCV ETF:
The investment seeks to provide investment results that, before fees and expenses, correspond generally to the total return performance of the S&P 500 Value Index that tracks the performance of large capitalization exchange traded U.S. equity securities exhibiting "value" characteristics. SPYV started in 2000.
Source: seekingalpha.com SPYV
SPYV has $15.1b in AUM and costs investors only 4bps in fees. The TTM Yield is 2.04%.
Index review
S&P describes their index as:
We measure value stocks using three factors: the ratios of book value, earnings, and sales to price. S&P Style Indices divide the complete market capitalization of each parent index into growth and value segments. Constituents are drawn from the S&P 500®.
Source: spglobal.com indices
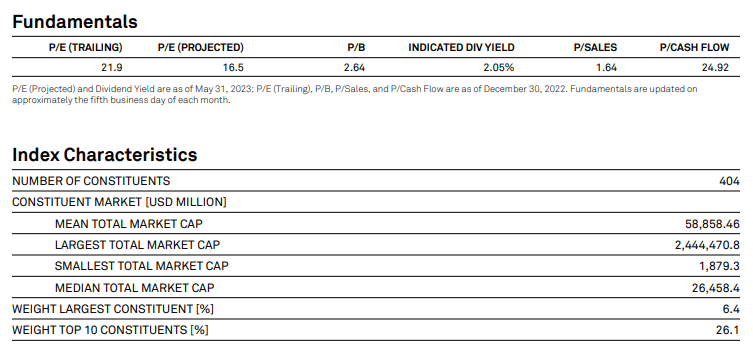
S&P provided some basic data about the index components.
SPYV holdings review
Let's start by looking at sectors, which later I compared to ICAP's allocation.
ssga.com SPYV sectors
Compared to an ETF like SPDR S&P 500 Trust ETF ( SPY ), the Value version has less Technology and more Financial exposure. The next two sectors also play larger roles, with Health Care moving down.
Top 20 holdings
ssga.com; compiled by Author
These stocks represent 35% of the portfolio; the smaller half only 14%. S&P classifies many stocks as both Value and Growth, just at different allocations. This explains why SPYV holds over 400 stocks that comprise the S&P 500 Index.
SPYV distribution review
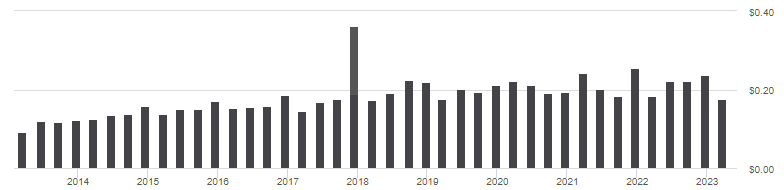
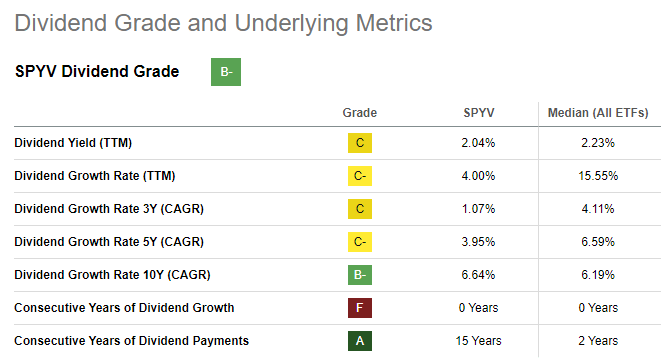
Dividend growth has been dropping over the past decade, up only 1.07% in the last three years, 3.95% over the last five. Seeking Alpha graded these results as a "B-".
seekingalpha.com SPYV scorecard
InfraCap Equity Income Fund ETF review
This is how Seeking Alpha describes this low ranked ETF:
The fund invests primarily in securities of U.S. companies, but may invest in foreign securities, including securities of companies located in emerging markets. To obtain high yield and total return, the adviser will favor sectors and industries that it currently views are undervalued on a relative basis. Benchmark: S&P 500 TR USD. ICAP started in December of 2021.
Source: seekingalpha.com ICAP
ICAP has $47.4m in AUM, a mere fraction of what SPYV has. While it provides a 9% yield, the fees are one of the highest I have seen on an ETF: 171bps! The managers pocket 80bps and the cost of the broker loan is 91bps. The Annual Report describes the loan as:
The Fund entered into a Tri-Party Lending Arrangement (the “Arrangement”) with Wells Fargo Securities, LLC (the “Broker”) that allows the Fund to borrow cash from the Broker. Borrowings under the Arrangement are collateralized by investments of the Fund. If the Fund defaults with respect to any of its obligations under the Arrangement, the Broker may foreclose on pledged assets of the Fund and/or the Fund may be required to repay immediately, in part or in full, the loan balance outstanding under the Arrangement, necessitating the sale of securities at potentially inopportune times. Interest is charged at the OBFR (Overnight Bank Funding Rate) plus an additional percentage rate on the amount borrowed. The Arrangement has an on-demand commitment term. For the period ended November 30, 2022 the interest rate was 4.88%.
Source: infracapequityincomefundetf.com ICAP AR
ICAP is allowed to execute option strategies, which the Annual Report described as such:
We will purchase and write put and call options in an effort to generate additional income and reduce volatility in the portfolio, remove or add securities from the portfolio (i.e., convertible securities), facilitate total return opportunities, and hedge against market risks or other risks in the Fund’s portfolio.
Source: infracapequityincomefundetf.com 2022 AR
Since ICAP is actively managed, there is no index to review.
ICAP holdings review
seekingalpha. com ICAP sectors
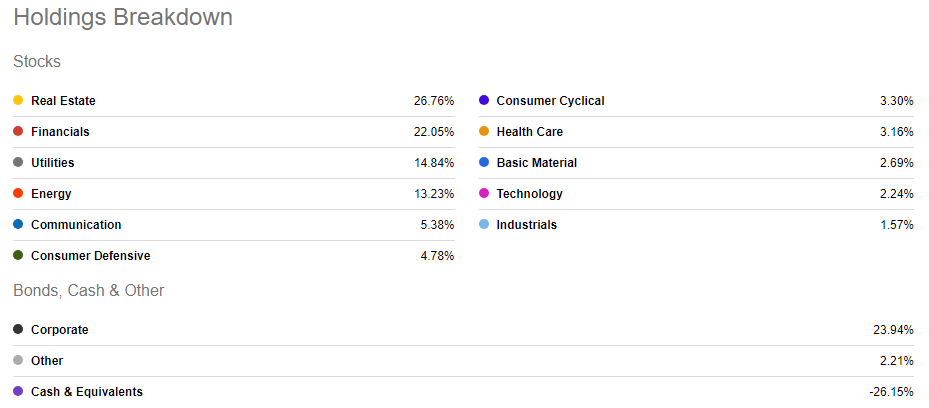
The download of the ICAP portfolio allowed me to classify the holdings by asset type. All the options were sold and I am assuming the cash is used to cover that exposure.
infracapequityincomefundetf.com; compiled by Author
Top holdings
infracapequityincomefundetf.com; compiled by Author
These assets are almost 50% of the total portfolio. That said, stocks are 121% when ignoring the large cash position.
Option strategy
While the rules allow for option positions where ICAP is the buyer, none were shown in the last holdings report. There are 62 Calls that expire in June, another 40 in July, with the rest spread out as far as November expirations. Currently, there are about 50 stocks, out of 91 held, with options written against the ICAP positions held, many with multiple strikes/expiration dates. With acquisition data missing, I do not know if ICAP follows an ITM or OTM strategy when establishing their option exposures. The last Annual Report did list that it cost the ETF $100k to close out ITM options before ICAP might have been Called on them.
ICAP distribution review
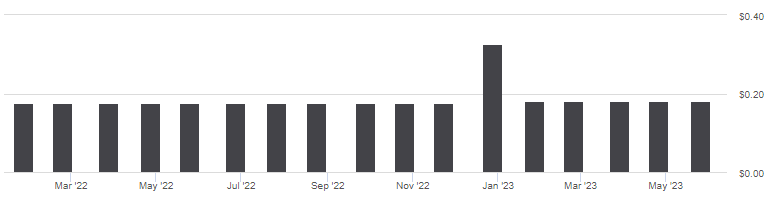
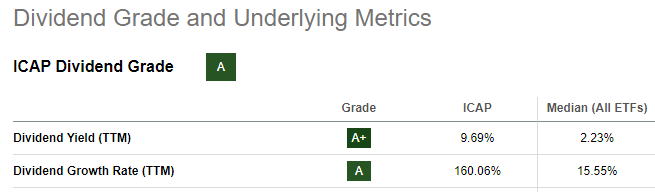
Starting in 2023, the monthly payout changed from $.175 to $.18. Seeking Alpha gives this ETF an "A" grade. Despite the fact that the ETF writes options, all of the 2022 payouts were from income or capital gains, no ROC which is common for option-writing ETFs.
seekingalpha.com ICAP scorecard
Comparing ETFs
I will start the comparison with basic facts about both ETFs.
| AUM |
| $15.1b |
| $47.4m |
| Fees |
| 4bps |
| 171bps |
| Yield |
| Price/Earnings |
| 16.40 |
| 9.89 |
| Price/Book |
| 2.31 |
| 1.23 |
| Price/Sales |
| 1.57 |
| 1.05 |
| Price/Cash Flow |
| 10.83 |
| 3.96 |
| LT Earnings growth |
| 10.36% |
| 7.21% |
| Cash Flow growth |
| -3.80% |
| 5.16% |
| Book Value growth |
| 2.78% |
| 4.24% |
With the green-filled boxes representing the better value as I see it, ICAP shows better Value and Growth data. ICAP's big negative is the 171bps in fees, which is off the charts even for an actively managed ETF.
The Vanguard Style boxes show the following allocations.
advisors.vanguard.com
The above boxes confirm the data points; ICAP has twice the weight in Value stocks as does SPYV; at least by how Vanguard classifies them. ICAP also has almost twice the weight in stocks below the Large-Cap ones, including 21% in Small-Cap, whereas SPYV has none.
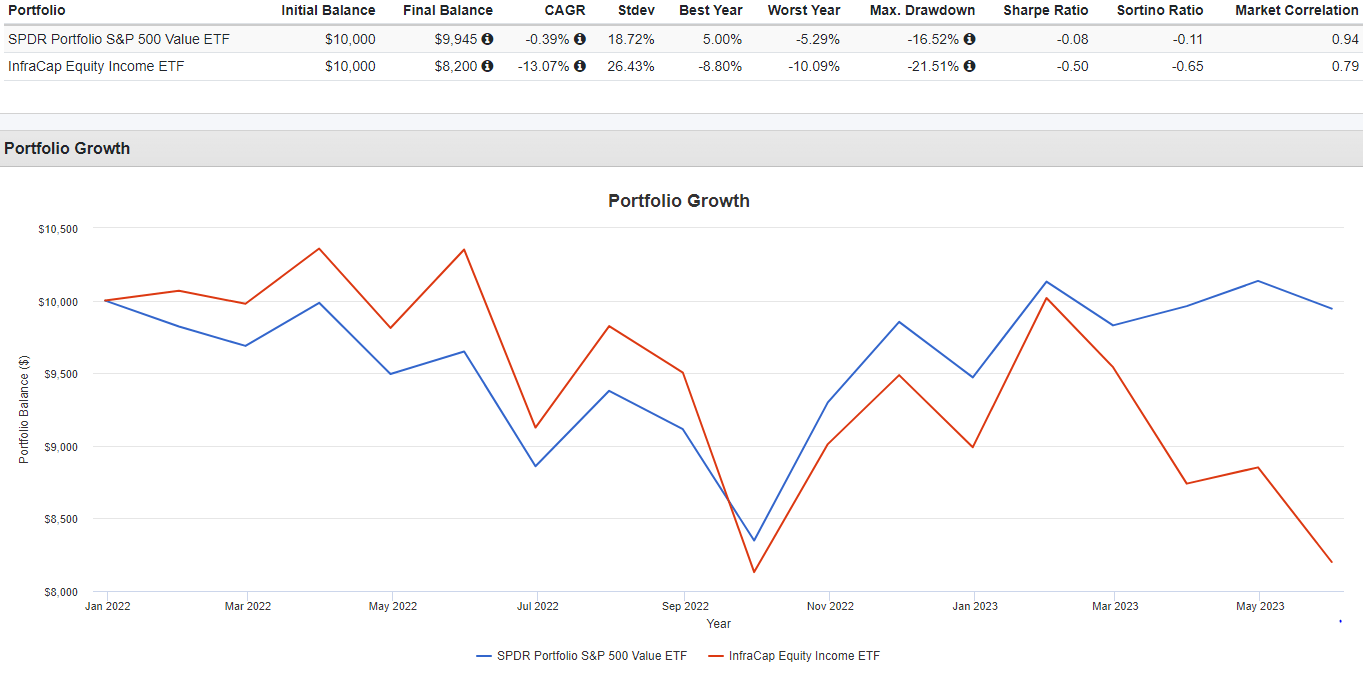
Sector allocation differences (SPYV less ICAP) can lead to a large divergence in returns, as the PortfolioVisualizer chart later shows started in earnest in March'23.
ETFRC.com
Six of the eleven sectors differ by 10% or more, with both Real Estate and Technology being 15% or more.
ICAP was holding its own until the end of January but its large exposure to Financials and Real Estate has hurt since the March banking crisis broke. That illustrates the importance of knowing what sector “bets” the managers are making with their active allocation strategy. Selling Covered Calls during the recent market rally could be hurting ICAP too.
Portfolio strategy
One question to ask is where is ICAP getting the funds to provide a 9% yield? The latest Prospectus states the Net Investment Income was only yielded 4.89%, or $1.25 for the 11 months covered since inception. Net option income adds $.30, which still doesn't cover the $2.16 annual payments. December $.02166 LTG is the only part not listed as income. Assuming the option income is not included in the NII number, that comes up $.61 short of the income required to cover the dividends at the current rate. I admit I could be missing something; ICAP was confident enough to raise the payout this year.
For those wanting ICAP for the yield, I suggest checking out the Trapping Value article that compares this ETF against the popular, high-yielding JPMorgan Equity Premium Income ETF ( JEPI ).
Final thoughts
I have decided to give the ICAP ETF a Sell rating for these reasons:
- 171bps in fees. With rates still climbing, the cost of their broker loan will too.
- Uncertainty on how they are funding the dividend.
- Sector allocations versus a major index-invested LCV ETF.
- Writing Covered Calls can limit gains when the market is rising.
For further details see:
ICAP Vs. SPYV: Comparing Large-Cap Value ETFs