HDEF - IDV: Attractive Yield And Dividend Growth Underwhelming Return
2023-09-05 04:43:07 ET
Summary
- iShares International Select Dividend ETF is invested in 100 dividend stocks from developed countries.
- It is overweight in financials but well-diversified across countries and holdings.
- IDV has an attractive 7% yield and a dividend growth rate beating inflation, but total return is underwhelming relative to peers.
This article series aims at evaluating ETFs (exchange-traded funds) regarding past performance and portfolio metrics. Reviews with updated data are posted when necessary.
IDV strategy and portfolio
iShares International Select Dividend ETF (IDV) started investing operations on 06/11/2007 and tracks the Dow Jones EPAC Select Dividend Index. It has a portfolio of 100 stocks (plus cash in various currencies and derivatives), a 12-month distribution yield of 7%, and a total expense ratio of 0.51%.
As described by S&P Dow Jones Indices , the investable universe includes stocks incorporated in developed countries except the U.S.
At every annual reconstitution, eligible stocks must have:
- paid dividends in each of the previous three years,
- dividend-per-share greater or equal to its three-year average,
- a 5-year average dividend coverage ratio greater than or equal to two-thirds of the 5-year average of the S&P BMI country index, or greater than 118%,
- a non-negative trailing 12-month earnings-per-share,
- at least US$1 billion in float-adjusted market capitalization (US$750 million for current constituents),
- at least US$3 million in 3-month average daily volume.
Then, eligible stocks are ranked by IAD yield with the objective of selecting 100 of them. Current constituents that are not in the top 200 are excluded and replaced by new constituents among the best-ranked stocks. Weights are calculated based on IAD yield and adjusted by country, with a maximum weight of 10% by constituent, 30% by country, and 30% by GICS sector. A constituent may be excluded at any time if the company drastically cuts its dividend, or if it is delisted or affected by bankruptcy. In the most recent fiscal year, the portfolio had a turnover rate of 29%.
About 54% of asset value is in Europe and 53% is in large-cap companies. The UK and Canada are the heaviest countries in the portfolio, with weights of 14.1% and 10.4%, respectively.
IDV geographical allocation, % of asset value (chart: author; data: iShares)
The fund is overweight in financials (26.9%). Industrials, materials, and utilities are between 15% and 17% each. Other sectors are below 7%. Information technology is almost ignored, and healthcare is totally missing.
IDV sector breakdown, % of asset value (chart: author; data: iShares)
The top 10 holdings, listed below, represent 29.9% of asset value. The top name weighs about 5%, so risks related to individual companies are moderate.
| Name |
| Weight (%) |
| Sector |
| Location |
| Ticker |
| RIO TINTO GROUP |
| 5.23 |
| Materials |
| UK |
| RIO |
| BHP GROUP LIMITED |
| 3.39 |
| Materials |
| Australia |
| BHP |
| MITSUI O.S.K. LINES, LTD |
| 3.31 |
| Industrials |
| Japan |
| 9104 |
| BRITISH AMERICAN TOBACCO P.L.C. |
| 2.94 |
| Consumer Staples |
| UK |
| BATS |
| NIPPON YUSEN |
| 2.89 |
| Industrials |
| Japan |
| 9101 |
| ACS ACTIVIDADES DE CONSTRUCCION |
| 2.63 |
| Industrials |
| Spain |
| ACS |
| ENI |
| 2.56 |
| Energy |
| Italy |
| ENI |
| YARA INTERNATIONAL |
| 2.38 |
| Materials |
| Norway |
| YAR |
| AGEAS SA |
| 2.33 |
| Financials |
| Belgium |
| AGS |
| BANK OF NOVA SCOTIA |
| 2.24 |
| Financials |
| Canada |
| BNS |
Valuation
The next table reports valuation ratios of IDV and four other global dividend ETFs:
- Xtrackers MSCI EAFE High Dividend Yield Equity ETF (HDEF), reviewed here
- SPDR S&P Global Dividend ETF (WDIV), reviewed here
- First Trust Dow Jones Global Select Dividend Index Fund ETF (FGD), reviewed here
- SPDR S&P International Dividend ETF (DWX), reviewed here
These funds have common characteristics: international equity exposure, yield above 4.5%, and no currency hedge. I have explained here why currency-hedged funds should not be compared with non-hedged funds.
| IDV |
| HDEF |
| WDIV |
| FGD |
| DWX |
| Price / Earnings TTM |
| 5.85 |
| 9.92 |
| 11.86 |
| 5.95 |
| 14.1 |
| Price / Book |
| 0.85 |
| 1.58 |
| 1.08 |
| 0.8 |
| 1.26 |
| Price / Sales |
| 0.72 |
| 0.92 |
| 0.77 |
| 0.66 |
| 0.85 |
| Price / Cash Flow |
| 4.17 |
| 6.25 |
| 8.04 |
| 3.95 |
| 7.47 |
S ource: Fidelity
IDV is one of the two cheapest funds regarding these metrics, along with FGD. A note of caution: these ratios may be biased by sector and country allocations. IDV and FGD are heavier in financials, where valuation ratios are usually lower and less reliable. Moreover, countries may have a discount or premium due to perceived risks related to their economic and political contexts.
Past performance compared to competitors
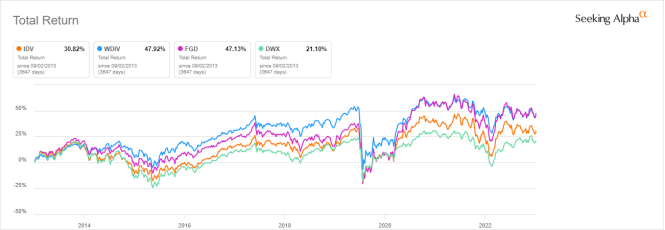
The next chart compares 10-year total returns of the same funds, except HDEF, whose inception date is more recent. IDV has been lagging WDIV and FGD.
IDV vs. WDIV, FGD, DWX, 10-year returns (Seeking Alpha)
In 2023 to date, IDV is the worst performer, almost on par with WDIV and FGD. HDEF and DWX are leading in this time frame.
IDV vs. WDIV, FGD, DWX, HDEF, year to date (Seeking Alpha)
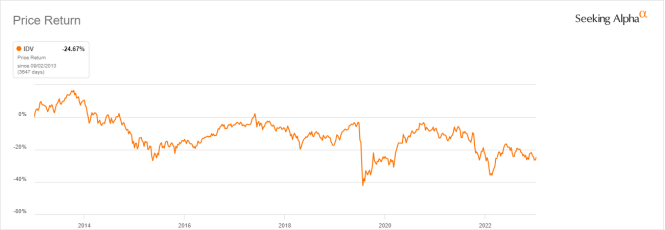
IDV has suffered a price decay close to 25% in 10 years, as reported in the next chart. The cumulative inflation at the same time has been about 30% (based on CPI), resulting in a loss of 41% in inflation-adjusted value (the formula is 1-0.75*0.7).
IDV 10-year price return (Seeking Alpha)
As the geographical allocation has changed over time, it would be very complicated to calculate the impact of forex rate variations. For a rough evaluation, the dollar index has gained about 30% in 10 years. It doesn’t change the return for U.S. shareholders, but it makes it better for non-dollar-based investors. Currency risk may play in favor or against global equity funds in the future.
The next table reports the annual sum of distributions per share in 2015 and 2022.
| IDV |
| WDIV |
| FGD |
| DWX |
| 2015 |
| 1.46 |
| 2.86 |
| 1.10 |
| 1.94 |
| 2022 |
| 1.99 |
| 3.00 |
| 1.26 |
| 1.51 |
| Variation |
| 36.30% |
| 4.90% |
| 14.55% |
| -22.16% |
IDV has the best 7-year dividend growth rate with 36.30%, beating the cumulative inflation (about 25%).
Takeaway
iShares International Select Dividend ETF is invested in 100 dividend stocks from developed countries. The portfolio is overweight in financials, but it is well-diversified across countries and holdings. The fund has an attractive 7% yield and a dividend growth rate beating inflation since 2015, but total return is underwhelming compared to peers, and the fund has lost about 40% in 10 years in inflation-adjusted value.
For further details see:
IDV: Attractive Yield And Dividend Growth, Underwhelming Return