IGA - IGA: Discount Looking Attractive
2023-05-30 03:32:18 ET
Summary
- Voya Global Advantage and Premium Opportunity Fund trades at a deep discount, offering an attractive distribution yield.
- The fund's value-oriented portfolio has performed well in 2022, but heavy financial exposure has impacted 2023's results.
- The large discount allows investors to receive a higher distribution rate, with the current payout level considered reasonable.
Written by Nick Ackerman. This article was originally published to members of the CEF/ETF Income Laboratory on May 15th, 2023.
Voya Global Advantage and Premium Opportunity Fund ( IGA ) continues to trade at a deep discount. While the discount remains a fixture perpetually for this fund, the latest discount appears to be wider than is historically usual. That can often present a fairly attractive time to consider a closed-end fund. It isn't the absolute discount/premium but relative to its longer-term average as a way to play the reversion to the mean.
The fund also sports an attractive distribution yield. This distribution is funded through capital gains primarily. So any market downturn for a prolonged period will be met with distribution cuts. However, this fund certainly isn't the 'market,' and 2022 showed that with the fund barely showing any losses. This was largely thanks to their derivatives and portfolio being value-oriented.
Since our last update , the total returns of this fund have been mostly flat. However, the fund's share price had underperformed the NAV performance. Thus, we've seen the discount widen even further. The fund also posted its latest annual report for the fiscal year-end 2023, which ended February 28th.
YCharts
The Basics
- 1-Year Z-score: -2.27
- Discount: -15.20%
- Distribution Yield: 9.15%
- Expense Ratio: 0.99%
- Leverage: N/A
- Managed Assets: $155 million
- Structure: Perpetual
IGA's investment objective is "a high level of income; capital appreciation is secondary." They intend to write " call options on indexes or ETFs, on an amount equal to approximately 50-100% of the value of the Fund's common stock holdings."
Having the flexibility of active management means they don't need to target an exact percentage overlay of their portfolio specifically. Adding more flexibility can be positive because a call-writing strategy has its pros and cons. They can provide steady capital gains while the market is flat. However, they can potentially hinder the upside in a raging bull market.
They last reported being 49.55% overwritten with call options, putting them in a more bullish stance in their portfolio. This was actually quite close to the 49.93% overwritten they were when we last reported on the fund.
An additional positive for this fund could be seen as not being leveraged. Being non-leveraged in a time of significantly higher interest rates and uncertain market means relatively less volatility compared to their leveraged cousins. The majority of CEFs are leveraged, but there are these non-leveraged gems where discounts/premiums can still be played without the added risk of leverage.
Performance - Deep Discount
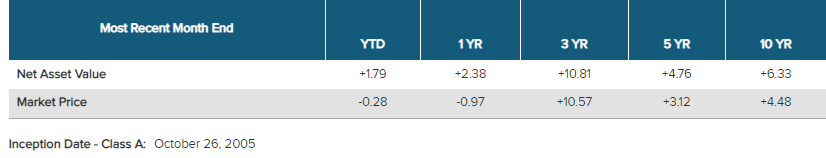
As I regularly cover IGA, I know no update could be complete without always touching on the historical results.
The fund investing in global securities primarily drove these relatively lackluster longer-term historical results. Global securities had significantly underperformed the U.S. in the last decade. Additionally, these aren't the types of results that the U.S. 'market' would show primarily because IGA is invested heavily in value-oriented sectors, not growth sectors.
This year, having their largest sector exposure to financials has provided some muted results. My February update on this fund provided to be poor timing as banks decided to collapse the following month. Even healthcare, their second largest exposure, currently hasn't provided any performance to boast about, with basically flat YTD results.
Will the performance be better going forward than it has been over the last decade? That is, of course, impossible to predict. However, global investments have been starting to get some love so far in 2023 after all these years of underperformance.
Cycles of U.S. equity outperformance (JPMorgan)
The catalyst for seeing this continue is that international investments are still cheaper than U.S. peers. The U.S. continues to trade above its longer-term P/E average while international markets trade below their historical levels.
To help performance going forward could be a potential narrowing of IGA's discount. While the fund experienced an almost perpetual discount since its inception, some discount narrowing back to its longer-term average could be in the cards. At the very least, one could be picking up shares near its all-time lows. The periods where the fund dropped to further discounts were in the GFC and Covid, two particularly unique situations.
YCharts
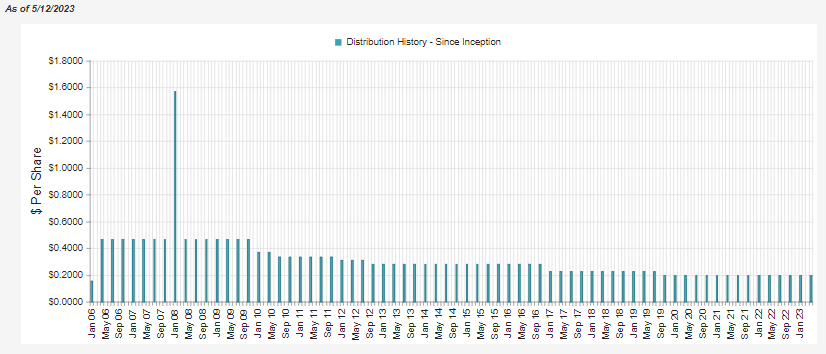
Distribution - Attractive, But We Do Need Some Gains
The current distribution yield of 9.48% is fairly attractive for shareholders. This is an elevated yield relative to the more reasonable NAV rate of 8.04%. This is another way that the fund's discount benefits shareholders; we get to collect a higher rate while the portfolio doesn't have to hit the same level to keep it sustainable.
Historically, they had cut several times due to once again being global investments with a value-oriented portfolio. They simply just didn't produce the results they needed. Even the ~8% isn't something they've been able to reach in the last 10 years of performance, though, in the last three years, they were able to top it.
So a cut isn't completely off the table, but it goes back to believing that international markets can outperform going forward. Additionally, the relatively flat performance in 2022 relative to most other investments should give them more cover to keep paying the same rate for now.
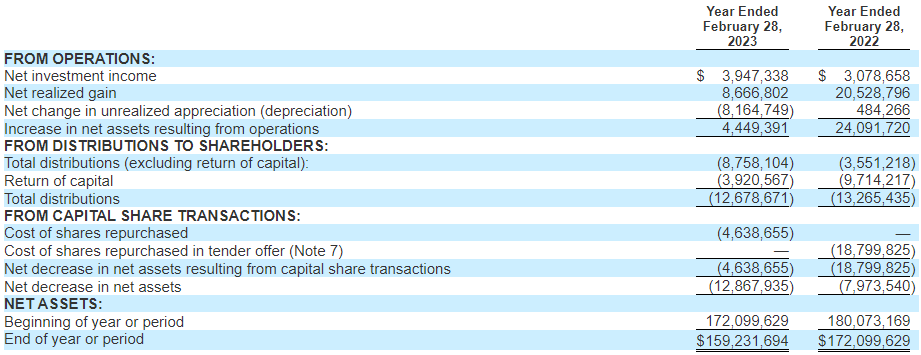
As with most equity funds, we can see that net investment income isn't enough to cover their payout to shareholders. However, NII did increase in the last year .
Any increase in NII is welcomed as it means less pressure on what the fund will need for capital gains. On a per-share basis, this went from $0.18 in fiscal 2022 to $0.25 in fiscal 2023.
Putting together the NII and realized capital gains that put the fund just shy of covering its payout for 2023. Of course, they also still experienced sizeable unrealized losses that also mostly offset the realized gains.
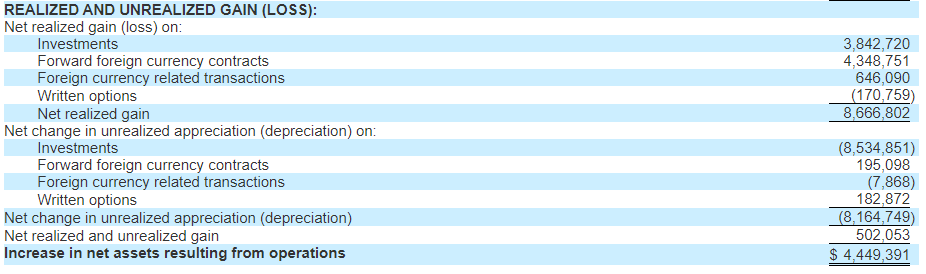
What might be more interesting is to see the breakdown of these realized and unrealized gains and losses. That's where we start to see the derivatives in action; the written options, which are a key focus of the fund, but also forward foreign currency contracts and foreign currency-related transactions also contributed to realized gains.
Interestingly, this fund lost money due to its written options, which were offset entirely by the unrealized written options gains. Most other call-writing funds showed meaningful gains realized from their written options contracts. Losses can come from the fund writing index calls or writing covered calls that they ultimately close for a loss. This can also do a lot with timing. In their previous semi-annual report, they had shown a realized gain of $2.519 million.
In this case, it was the currency contracts of IGA that provided most of the heavy lifting in terms of realized gains. The underlying portfolio also contributed a healthy portion of realized gains in the prior year.
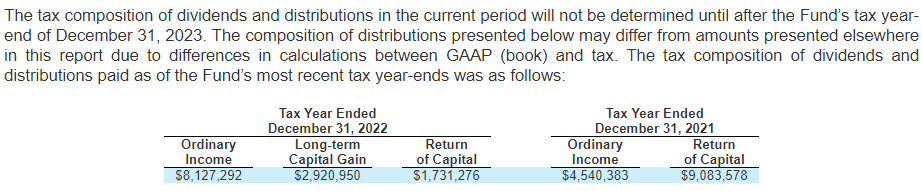
For the prior two years, the fund's tax classifications for its distributions have been spread across different classifications. In 2022, it was mostly ordinary income, followed by long-term capital gains and some return of capital. In 2021, the majority was classified as ROC, with the rest being ordinary income.
That puts it in sort of a weird spot where an argument could be made for holding this fund in either a taxable or tax-sheltered account.
IGA's Portfolio
The fund lists 246 different positions in the portfolio, providing plenty of diversification for investors. With a portfolio turnover rate of 81% reported in the last year, this also tells us that the management is fairly active. Going back to 2014 or the last 10 years, the fund averaged a turnover of 75.6%. So being active is a fairly regular occurrence in most years.
While that is the case, the actual portfolio has generally emphasized a value-oriented approach since I've been following the fund. We once again see financials as the largest weighting in the fund, as it was in December 2022 . At that time, financials made up 21.05% of the fund. If we go back to over a year ago, at the end of February 2022 , we would see that financials at that time made up 20.94% of the fund too. As I mentioned, despite a higher turnover rate of the portfolio, the actual composition on the surface of the fund stays relatively similar.
Despite the banking crisis taking down plenty of banking names, the exposure here increased. This could suggest that they actually picked up some financial exposure while prices were depressed. They mostly stick to larger caps, better-known names, so this could prove beneficial over the longer run.
IGA Sector Weighting (Voya)
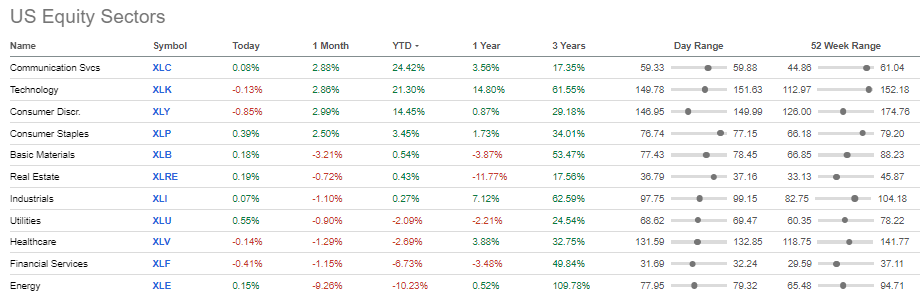
Healthcare also was its second largest exposure, followed by industrials. Each weighting was previously 16.04% and 11.18%, respectively. This can help reflect why the fund's performance has been mostly flat through 2023, even though the 'market' is making new highs. The market making new highs as measured by the S&P 500 is more reserved for the mega-cap tech names driving the results. It has very little to do with the other ~495 holdings in the index.
The largest geographic weighting of the fund is allocated to U.S. investments. This has also been a fairly static breakdown for the fund too. At ~63.5% of the fund, though, that still leaves a meaningful weighting to countries outside of the U.S. as well.
IGA Geographic Allocation (Voya)
When looking at the fund's top ten holdings, most of these names will be recognizable by most investors. These are large-cap names that provide goods and services for everyday people. The top ten holdings aren't too large either in terms of their fund composition at just over 13.3%.
IGA Top Ten Holdings (Voya)
Similar to the fund's sector weightings and geographic weighting, several of these top ten names have been consistent. Johnson & Johnson ( JNJ ) also goes back to being the fund's largest holding over a year ago. If we go back to the first time I covered IGA in early 2020 , it was the second largest holding only behind Microsoft ( MSFT ).
Conclusion
IGA carries a value-oriented portfolio that has treated it well through 2022. The heavy financial exposure this year has dented 2023's results. The fund remains attractively valued with a deep discount. Thanks to the large discount, investors receive a meaningfully higher distribution rate than the fund's underlying portfolio has to earn. For now, the payout seems reasonable at the current level. However, as an equity fund, it will always depend on what they are able to produce for capital gains.
For further details see:
IGA: Discount Looking Attractive