IGSB - IGSB: Investment Grade Corporate Bonds Attractive Risk/Reward Proposition
2023-09-27 14:53:10 ET
Summary
- The iShares 1-5 Year Investment Grade Corporate Bond ETF seeks to track an index of short-term investment-grade corporate bonds.
- The fund has a duration of 2.57 years and a collateral weighted average maturity of 2.96 years.
- Although Banking is the largest sectoral allocation, the probability of default is mitigated by the fund's granular build, with larger than 1% exposure only allocated to systemically important banks.
- The main risk factors for the fund are interest rates and credit spreads.
- In our base case scenario, the fund has an attractive risk/reward ratio with a 4.5x coverage in terms of yield/drawdown.
Thesis
The iShares 1-5 Year Investment Grade Corporate Bond ETF ( IGSB ) is a fixed income exchange traded fund. As per its literature, the fund:
Seeks to track the investment results of an index composed of U.S. dollar-denominated investment-grade corporate bonds with remaining maturities between one and five years.
The respective index is the ICE BofA 1-5 Year US Corporate Index with the Bloomberg ticker CVA04PM. The index, and implicitly the fund, targets shorter duration investment grade corporate bonds. IGSB has a duration of 2.57 years and a collateral weighted average maturity of 2.96 years.
This fund is similar in its intent to the much better known iShares iBoxx $ Investment Grade Corporate Bond ETF ( LQD ), but LQD targets the intermediate portion of the yield curve with an 8.2-year duration.
An investor in IGSB runs rates and credit spread risk, with rates being the prevalent risk factor. Given the fund's duration profile, the three-year yield curve node can be used here. The fund's option adjusted spread is 94 bps currently, and is going to fluctuate with risk-on/risk-off environments, but represents a small percentage of the overall fund all-in yield.
The fund currently has a 5.7% 30-day SEC yield and a portfolio yield to maturity of 5.97%. All else equal (i.e., no changes in rates or credit spreads), the fund will see its 30-day SEC yield move toward the portfolio yield as time passes by.
We are in the midst of one of the most aggressive monetary tightening cycles in recent history:
Hike Profile (Federal Reserve)
The steeper the curve in the above graph, the more aggressive the tightening cycle. The 2022/2023 one stands out as the most aggressive in recent history by the magnitude of Fed Funds changes in a short period of time.
The front end of the yield curve is now hugging the 5% yield mark, displaying the narrowest spread to Fed Funds. While we wrote about 2-year rates when we covered SHY, this name is mainly driven by 3-year yields, which are slightly inverted:
Yield Curve (Investing.com)
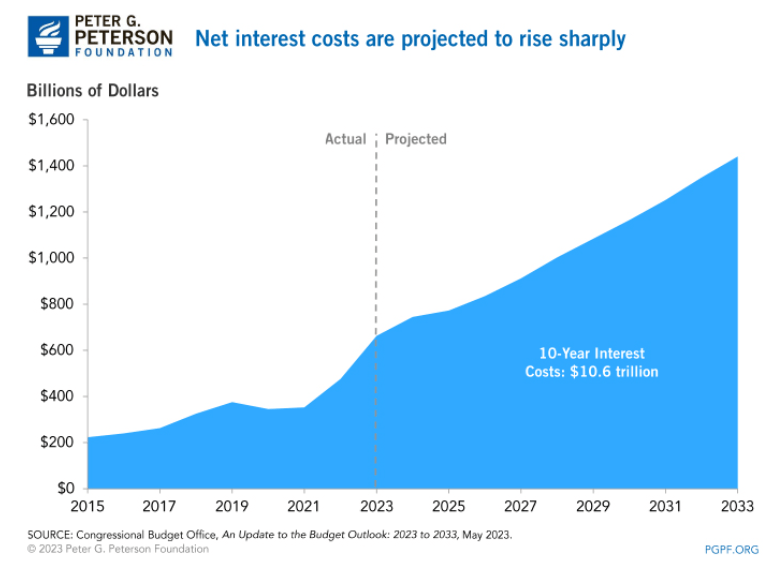
Assuming the Fed is done hiking, we expect 3-year yields to be range bound in the 4.7% to 5% range until the market starts pricing Fed cuts. Despite a bombastic prediction from the JPM CEO, we do not think the Fed is going to go to 7% in Fed Funds, with the full impact of tighter credit conditions now percolating through the economy. Furthermore, the net interest cost to the U.S. is spiraling out of control at the current levels:
We are paying out now in net cash 3x of what was disbursed as recently as 2015. And there is a double whammy effect coming from higher nominal debt levels combined with higher interest rates.
We feel the Fed is done raising rates, and will let the tighter economic conditions and balance sheet run-off do the rest for them in terms of monetary tightening.
Analytics
AUM: $22.5 billion
Sharpe Ratio: -0.86 (3Y)
Std. Deviation: 3.21 (3Y)
Yield: 5.7% (30-day SEC Yield)
Portfolio YTM: 5.97%
Z-stat: n/a
Leverage Ratio: 0%
Duration: 2.57 yrs
Composition: Short Duration IG Corp Bonds
Expense Ratio: 0.04%
Holdings
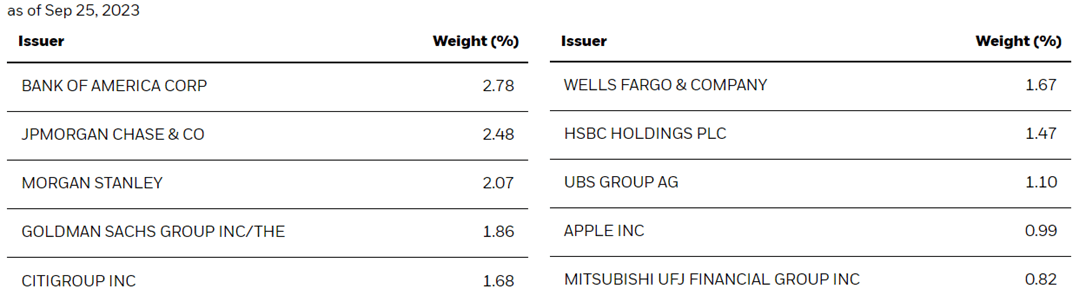
The fund is extremely granular, with over 3000 names in its portfolio, and with most individual issuers having a weighting of less than 1%:
We can see from the above table that the top issuers are mainly large, systemically important financial institutions, with only the first 8 names having a weight above 1% of the fund holdings.
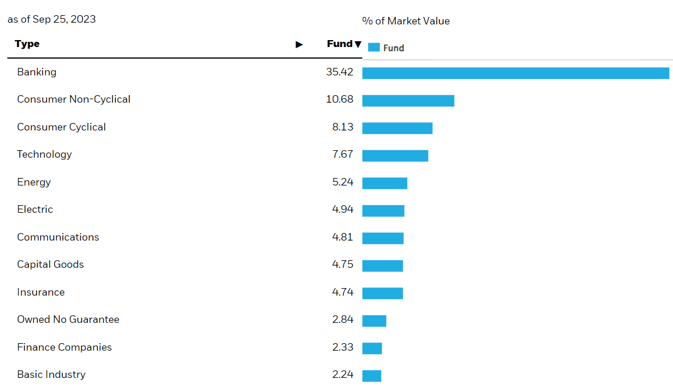
Banking is the top sectoral allocation:
Most large investment banks have a short-tenor funding profile, given the lower cost of funds for low-duration maturities. Banks generally engage in this type of maturity arbitrage, by lending long term at a higher yield, while funding short term at a lower cost. Regulators have set more stringent capital and funding requirements (such as the LCR ) post the Great Financial Crisis regarding funding tenors, but still the maturity profile is fairly short-dated when compared to other industries. Lehman famously filed for bankruptcy after it was closed out of the short-term funding markets after rumors regarding its CRE losses became widespread.
The vast majority of the collateral in this fund is rated investment grade:
Ratings (Fund Website)
We can see the fund being overweight 'A' and 'BBB' credits. The small 'BB' bucket is related to 'fallen angels' bonds.
Performance
From a pure price performance, IGSB has a similar profile to the treasuries only iShares 1-3 Year Treasury Bond ETF ( SHY ):
This correlation is due to their very similar duration profiles, with some outliers. One of those outliers was the Covid crisis, when we can see IGSB's price collapsing due to concerns around significant corporate bankruptcies. The fund had a 'V' shaped recovery there, as a result of the significant actions taken by the regulators to inject liquidity into the system and create new funding facilities. In a normalized economic environment without credit shocks, do expect a very tight correlation between these two tickers.
Risk Factors
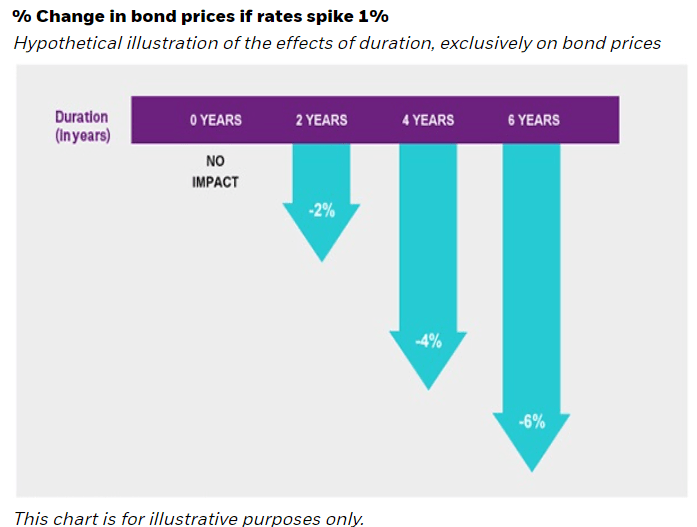
The main risk factor for this fund is represented by rates, followed by credit spreads. We can see that from the YTM decomposition - risk-free rates are roughly 5%, while credit spreads are 1%. Let us have a look at the duration impact:
With a 2.5-year duration, this fund will produce a -2.5% price performance if the 3-year point in the yield curve moves up by 100 bps. We feel that is highly unlikely, since it would imply another 75 bps to 100 bps in Fed Funds increases.
The more likely scenario in our opinion is a range-bound 3-year yield, which moves closer to Fed Funds and breaches 5% (from its current 4.8% level). That would result in a -0.5% loss in price given the fund's duration profile.
On the credit spread front, if we do get a recession next year, we will see a widening in credit spreads. Let us take a look at an IG bond index:
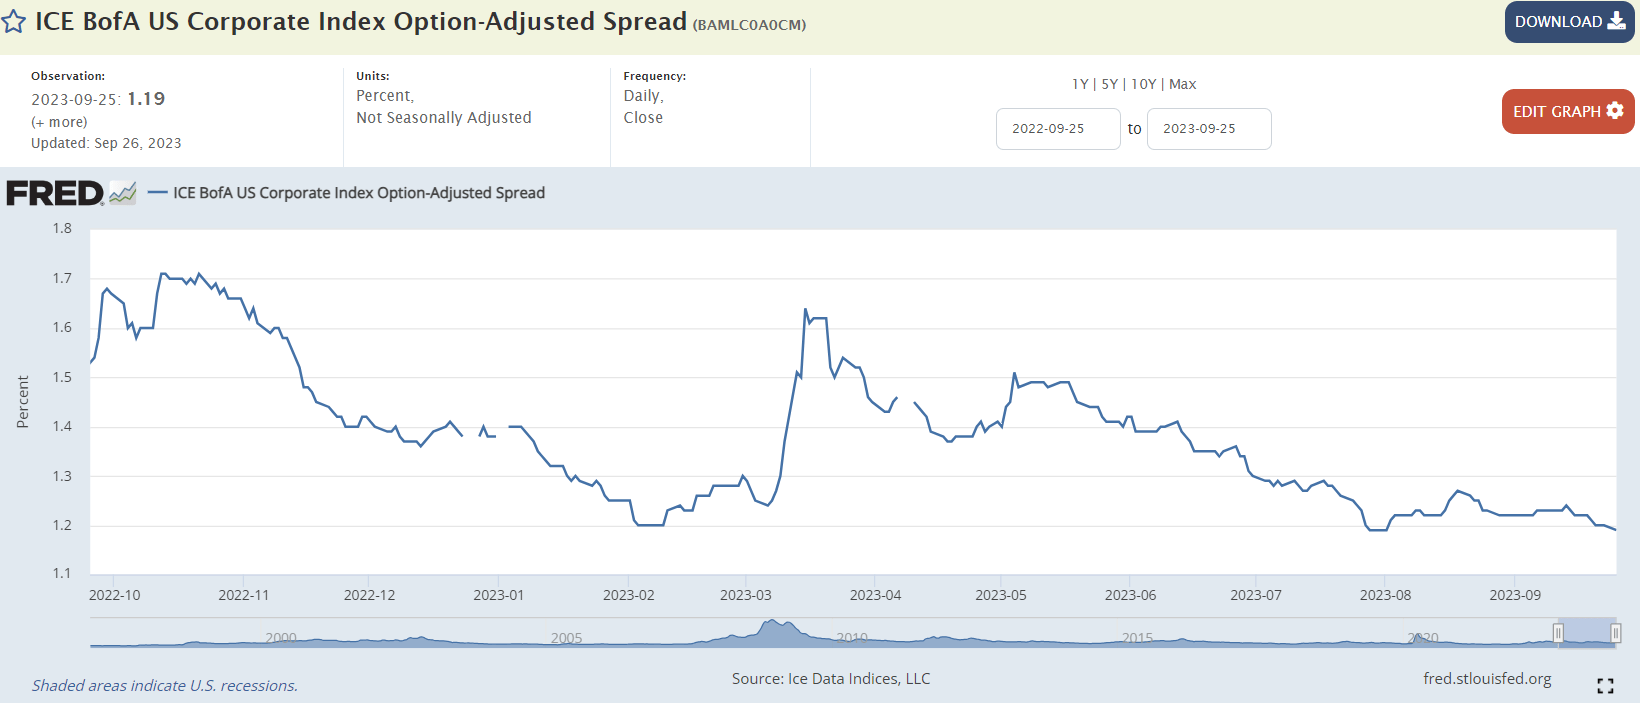
The above graph portrays the ICE BofA US Corporate Index, with its current option-adjusted spread trading at 119 bps, fairly close to the IGSB OAS. We can see that, during the October 2022 market risk-off event, the index had a gap of up to 170 bps in terms of spread. If we assume a slightly wider gap-up in spreads, we get a rough 100 bps move up in credit spreads during a recession.
A credit spread shock will thus result in a -2.5% price performance for the ETF. However, one has to keep in mind the current dynamics of the economic cycle - if we do get a recession, the Fed will be forced to cut, thus IGSB has an embedded hedge. We thus anticipate a -50 bps reduction in risk-free rates corroborated with a +100 bps increase in credit spreads, thus bringing us to a pro forma drawdown of only -1.25%.
Our base case is for the 3-year yield to briefly touch 5% next, with a mild recession next year seeing credit spreads widen while risk-free rates will start moving down. The base case drawdown profile is therefore -1.25%, offset by the fund's carry of 5.7%. We therefore have a 4.5x coverage in terms of yield/drawdown, an attractive risk ratio.
Conclusion
IGSB is a fixed income exchange traded fund. The vehicle targets shorter duration investment grade corporate bonds via its build, aiming to track the ICE BofA 1-5 Year US Corporate Index. The vehicle has a 2.5-year duration and a 3-year standard deviation of 3.2%.
The main risk factors for this name are risk-free rates and credit spreads. The vehicle is priced off the 3-year on-the-run treasury plus a current OAS of 94 bps. The current 30-day SEC yield for the fund is 5.7%.
In our base case, we only see a -1.25% drawdown profile for the fund, if the Fed maintains rates around current levels or raises another 25 bps. During a mild recession, the fund's increase in credit spreads will be offset by a partial reduction in risk-free rates, as the Fed will be forced to cut.
The current fund yield and its base case drawdown profile provide for an attractive risk/reward ratio, with IGSB having a 4.5x coverage in terms of yield/drawdown. We anticipate an 8% total return for this name in the next 16 months, driven by the fund's carry corroborated with a duration backwind once the Fed starts cutting rates in mid-2024.
For further details see:
IGSB: Investment Grade Corporate Bonds, Attractive Risk/Reward Proposition