IJS - IJS: It May Be Time To Consider Small Cap Value
2023-09-19 12:15:20 ET
Summary
- Small cap stocks have struggled this year as money flows into mega-cap tech stocks, but there may be potential in small cap value.
- The iShares S&P Small-Cap 600 Value ETF is completing a long consolidation and could see a significant bounce heading into year-end.
- IJS is a cheap and liquid fund that invests in small cap stocks with strong value characteristics, and it tends to perform well during periods of value rotation.
Small cap stocks have struggled on a relative basis this year, as money has flowed heavily into mega-cap stocks, particularly those of the tech variety. That may continue to be the case going forward, but there's an interesting setup in small cap value at the moment.
There are countless small cap ETPs out there, but in this case, we're taking a look at the iShares S&P Small-Cap 600 Value ETF ( IJS ). The fund appears to be completing a very long symmetrical triangle consolidation, meaning it may struggle for the coming weeks for direction. However, heading into year-end, I think it's good for a significant potential bounce, if not more.
What is IJS?
In short, this is a fund that invests in small cap stocks from the S&P 600 that "exhibit the strongest value characteristics". Those characteristics include price to book value, price to earnings, and price to sales ratios. The value components of the S&P 600 are about half of the total index, implying the other half is growth-oriented. To be included, stocks must have market caps of between $750 million and $4.6 billion, so we're looking at a fairly significant range.
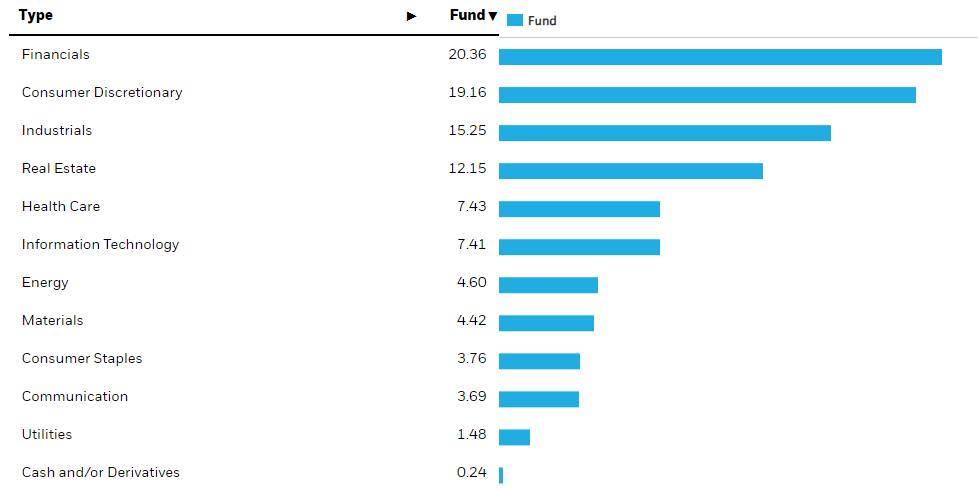
Given it's a value fund, it's heavily oriented towards areas you'd think of when thinking value. That would be defensive areas like financials, industrials, real estate, and healthcare, with consumer discretionary being the outlier in the top sectors. Still, this fund is going to thrive when more defensive sectors lead, which is part of the reason why it's not performed all that well against the larger indices this year; growth has led in 2023, and IJS doesn't have much of that. When money rotates back into value, it will perform better on a relative basis. I believe we're approaching one of those periods now.
Before we get to that, a couple of additional characteristics that are of note for holders of IJS are the cost and the yield.
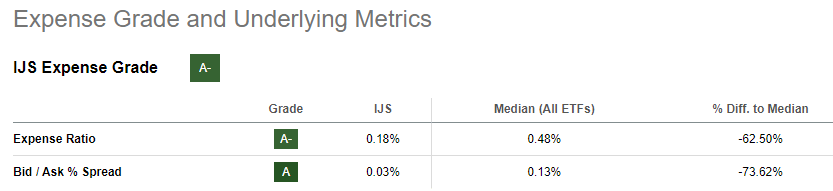
IJS is very cheap at just 18 basis points annually, and it's highly liquid with an average bid/ask of just three basis points. The best ETPs are cheap and highly liquid, and IJS checks both of those boxes.
In addition, you get a 1.6% yield with IJS, which is roughly congruent with that of the S&P 500. Is it amazing? No, but you get a market-matching yield if that's your thing.
Which way will we break?
That's the key question, but before we get there, let's take a look at the chart to see how the consolidation is forming thus far.
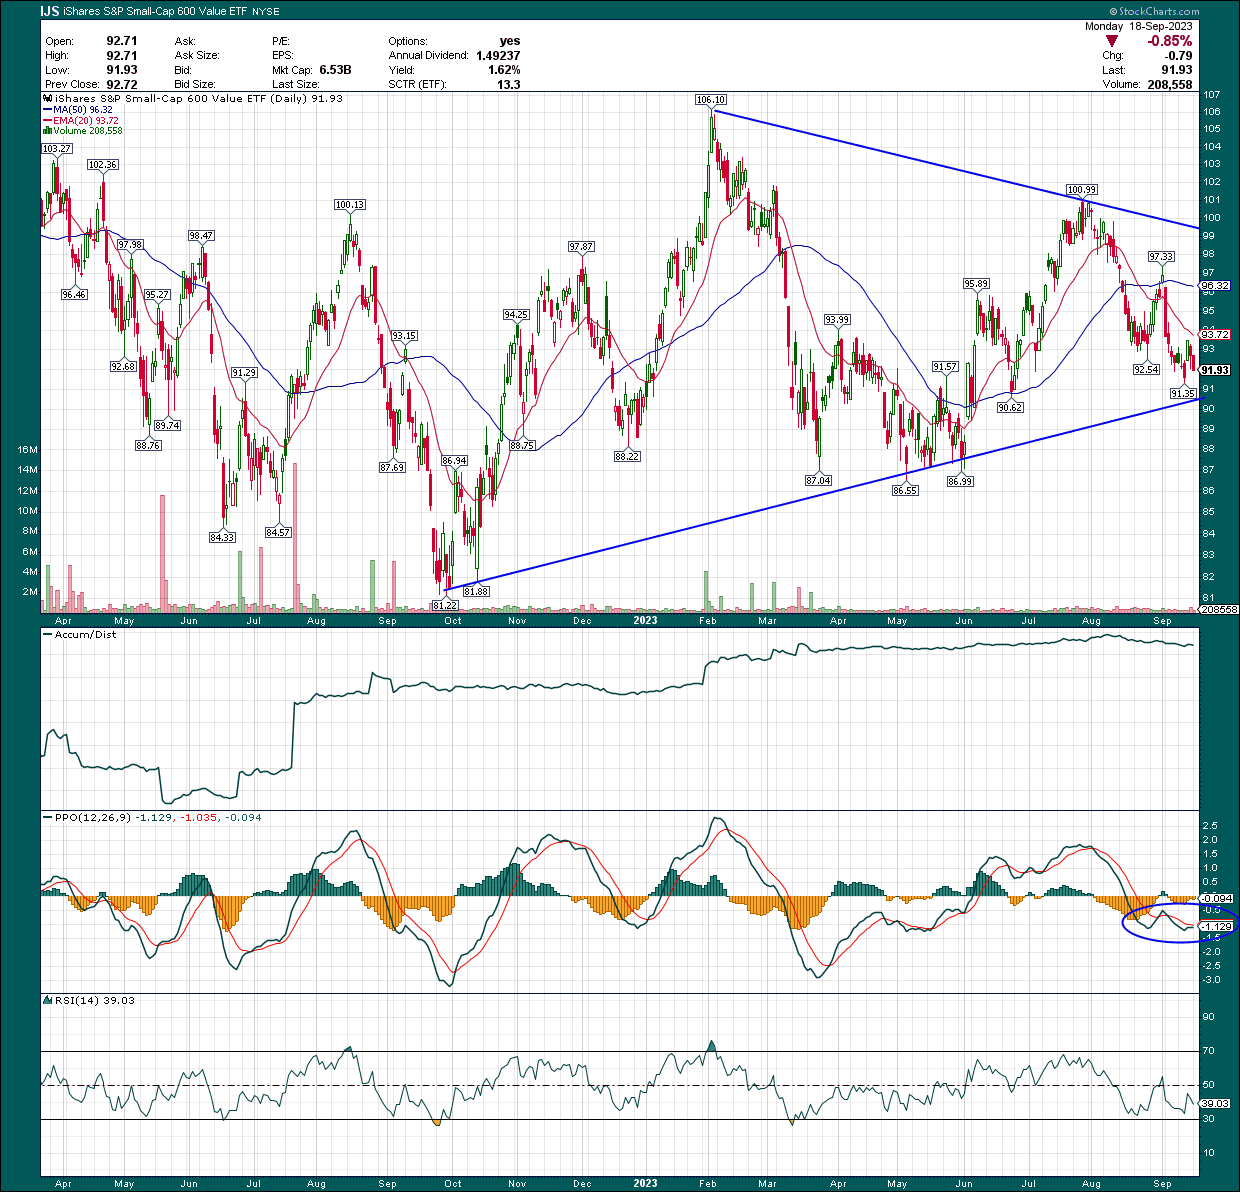
I've drawn in a symmetrical triangle consolidation that's been underway for almost a year. Small caps in general have been chopping around, and IJS is no different. Small cap value has underperformed the mega-cap indices by miles this year, but we're approaching a time of year when value generally leads, so it may be time for a nice rally.
So long as that bottom end of the triangle holds, IJS is a potential long. We're pretty close to testing it again, and if it fails, we'd be looking at a more sideways consolidation with support around $87. That would be a decidedly less bullish outcome, so factor that in if you're looking to take a position.
On the plus side, the accumulation/distribution line remains at its highs, meaning that we're seeing more intraday buying than selling. The PPO is under the centerline, as is the 14-day RSI, neither of which are bullish signals. Initial indications of a rally can be found with the 14-day RSI turning higher while price goes lower or sideways; we're not there quite yet but getting close.
Now, why do I keep saying we're approaching a bullish time of year? We tend to see value outperform growth into year-end. That simply means sectors like financials and industrials tend to outperform high beta sectors like technology into year-end. If that happens again this year, IJS probably stands to do pretty well.
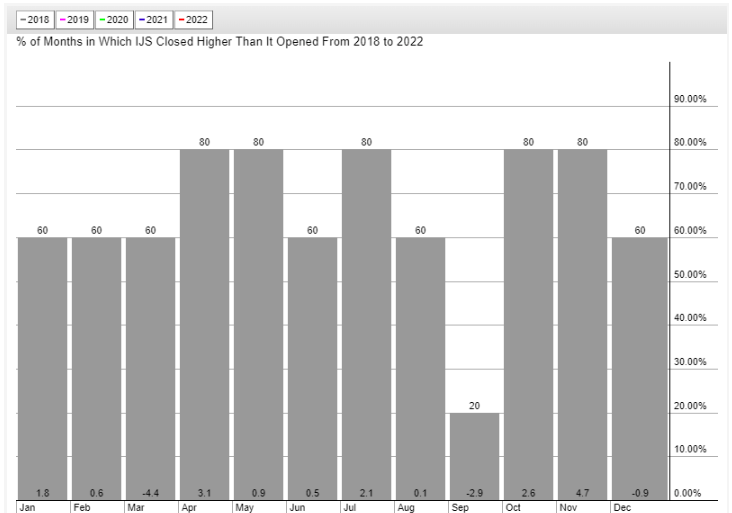
Below is the past five years of seasonality data for IJS, which shows the percentage of the time where IJS finished higher, and by how much, on average.
September is rough for just about all equities, and IJS feels that pain as well. But October is almost always higher, as is November, and by big margins; October averages a 2.6% gain while November averages tacking on a further 4.7%. These are big numbers, and by far the best two months of the year for IJS. That's pretty attractive if you're looking to start building a position.
Remember I said value tends to outperform growth into year-end? Below we have a direct comparison of IJS (small cap value) to IWO (small cap growth).
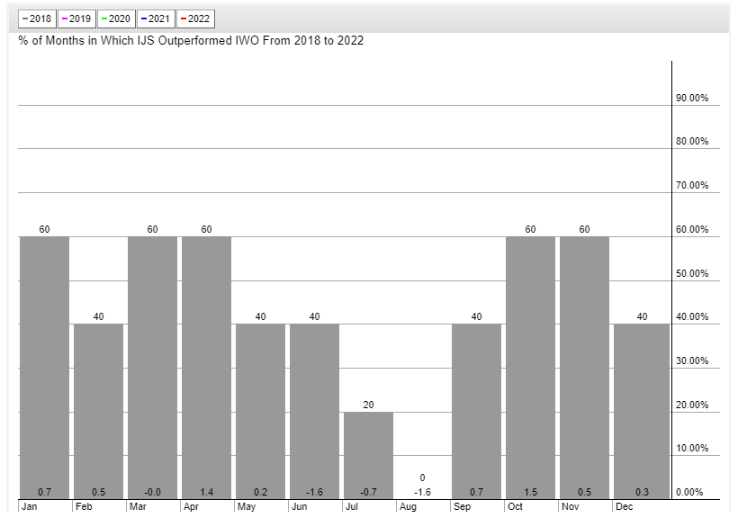
IJS outperforms IWO for all four months into year-end, and then the first two months of the year after that. The margins aren't large, but collectively for the six months of September to February, it's just over 4% of outperformance. Remember this is relative outperformance, not outright gains, which are larger. Technical analysis is all about placing the odds in your favor, and it's hard to find a more compelling way to put the odds in your favor than what we see above from a seasonality perspective.
Keep in mind that seasonality is just one indicator, and markets can (and sometimes do) completely ignore these tendencies. However, they are tendencies because they occur more often than not. With the confluence of support from the symmetrical triangle, as well as this overwhelmingly bullish seasonality data, if you're looking to take a position in small cap value, there's scarcely a better time than the next few weeks.
For further details see:
IJS: It May Be Time To Consider Small Cap Value